List of Tables
Table 1. Global Bioenergy Market Size Growth Rate by Type (US$ Million): 2021 vs 2025 vs 2032
Table 2. Key Players of Biomass Power Generation
Table 3. Key Players of Biomass Heating
Table 4. Key Players of Others
Table 5. Key Players of 1
Table 6. Global Bioenergy Market Size Growth by Application (US$ Million): 2021 vs 2025 vs 2032
Table 7. Global Bioenergy Market Size by Region (US$ Million): 2021 vs 2025 vs 2032
Table 8. Global Bioenergy Market Size by Region (US$ Million), 2021–2026
Table 9. Global Bioenergy Market Share by Region (2021–2026)
Table 10. Global Bioenergy Forecasted Market Size by Region (US$ Million), 2027–2032
Table 11. Global Bioenergy Market Share by Region (2027–2032)
Table 12. Bioenergy Market Trends
Table 13. Bioenergy Market Drivers
Table 14. Bioenergy Market Challenges
Table 15. Bioenergy Market Restraints
Table 16. Global Bioenergy Revenue by Players (US$ Million), 2021–2026
Table 17. Global Bioenergy Market Share by Players (2021–2026)
Table 18. Global Top Bioenergy Players by Tier (Tier 1, Tier 2, and Tier 3), based on Bioenergy Revenue, 2025
Table 19. Ranking of Global Top Bioenergy Companies by Revenue (US$ Million) in 2025
Table 20. Global 5 Largest Players Market Share by Bioenergy Revenue (CR5 and HHI), 2021–2026
Table 21. Global Key Players of Bioenergy, Headquarters and Area Served
Table 22. Global Key Players of Bioenergy, Products and Applications
Table 23. Global Key Players of Bioenergy, Date of General Availability (GA)
Table 24. Mergers and Acquisitions, Expansion Plans
Table 25. Global Bioenergy Market Size by Type (US$ Million), 2021–2026
Table 26. Global Bioenergy Revenue Market Share by Type (2021–2026)
Table 27. Global Bioenergy Forecasted Market Size by Type (US$ Million), 2027–2032
Table 28. Global Bioenergy Revenue Market Share by Type (2027–2032)
Table 29. Global Bioenergy Market Size by Application (US$ Million), 2021–2026
Table 30. Global Bioenergy Revenue Market Share by Application (2021–2026)
Table 31. Global Bioenergy Forecasted Market Size by Application (US$ Million), 2027–2032
Table 32. Global Bioenergy Revenue Market Share by Application (2027–2032)
Table 33. North America Bioenergy Market Size Growth Rate by Country (US$ Million): 2021 vs 2025 vs 2032
Table 34. North America Bioenergy Market Size by Country (US$ Million), 2021–2026
Table 35. North America Bioenergy Market Size by Country (US$ Million), 2027–2032
Table 36. Europe Bioenergy Market Size Growth Rate by Country (US$ Million): 2021 vs 2025 vs 2032
Table 37. Europe Bioenergy Market Size by Country (US$ Million), 2021–2026
Table 38. Europe Bioenergy Market Size by Country (US$ Million), 2027–2032
Table 39. Asia-Pacific Bioenergy Market Size Growth Rate by Region (US$ Million): 2021 vs 2025 vs 2032
Table 40. Asia-Pacific Bioenergy Market Size by Region (US$ Million), 2021–2026
Table 41. Asia-Pacific Bioenergy Market Size by Region (US$ Million), 2027–2032
Table 42. Latin America Bioenergy Market Size Growth Rate by Country (US$ Million): 2021 vs 2025 vs 2032
Table 43. Latin America Bioenergy Market Size by Country (US$ Million), 2021–2026
Table 44. Latin America Bioenergy Market Size by Country (US$ Million), 2027–2032
Table 45. Middle East & Africa Bioenergy Market Size Growth Rate by Country (US$ Million): 2021 vs 2025 vs 2032
Table 46. Middle East & Africa Bioenergy Market Size by Country (US$ Million), 2021–2026
Table 47. Middle East & Africa Bioenergy Market Size by Country (US$ Million), 2027–2032
Table 48. China Three Gorges Corporation (CTG) Company Details
Table 49. China Three Gorges Corporation (CTG) Business Overview
Table 50. China Three Gorges Corporation (CTG) Bioenergy Product
Table 51. China Three Gorges Corporation (CTG) Revenue in Bioenergy Business (US$ Million), 2021–2026
Table 52. China Three Gorges Corporation (CTG) Recent Development
Table 53. Vattenfall AB Company Details
Table 54. Vattenfall AB Business Overview
Table 55. Vattenfall AB Bioenergy Product
Table 56. Vattenfall AB Revenue in Bioenergy Business (US$ Million), 2021–2026
Table 57. Vattenfall AB Recent Development
Table 58. Iberdrola Company Details
Table 59. Iberdrola Business Overview
Table 60. Iberdrola Bioenergy Product
Table 61. Iberdrola Revenue in Bioenergy Business (US$ Million), 2021–2026
Table 62. Iberdrola Recent Development
Table 63. Enel Company Details
Table 64. Enel Business Overview
Table 65. Enel Bioenergy Product
Table 66. Enel Revenue in Bioenergy Business (US$ Million), 2021–2026
Table 67. Enel Recent Development
Table 68. RWE Group Company Details
Table 69. RWE Group Business Overview
Table 70. RWE Group Bioenergy Product
Table 71. RWE Group Revenue in Bioenergy Business (US$ Million), 2021–2026
Table 72. RWE Group Recent Development
Table 73. Xcel Energy Inc Company Details
Table 74. Xcel Energy Inc Business Overview
Table 75. Xcel Energy Inc Bioenergy Product
Table 76. Xcel Energy Inc Revenue in Bioenergy Business (US$ Million), 2021–2026
Table 77. Xcel Energy Inc Recent Development
Table 78. ACCIONA Company Details
Table 79. ACCIONA Business Overview
Table 80. ACCIONA Bioenergy Product
Table 81. ACCIONA Revenue in Bioenergy Business (US$ Million), 2021–2026
Table 82. ACCIONA Recent Development
Table 83. Guangdong Chant Group Inc Company Details
Table 84. Guangdong Chant Group Inc Business Overview
Table 85. Guangdong Chant Group Inc Bioenergy Product
Table 86. Guangdong Chant Group Inc Revenue in Bioenergy Business (US$ Million), 2021–2026
Table 87. Guangdong Chant Group Inc Recent Development
Table 88. Luenmei Quantum Co.,Ltd Company Details
Table 89. Luenmei Quantum Co.,Ltd Business Overview
Table 90. Luenmei Quantum Co.,Ltd Bioenergy Product
Table 91. Luenmei Quantum Co.,Ltd Revenue in Bioenergy Business (US$ Million), 2021–2026
Table 92. Luenmei Quantum Co.,Ltd Recent Development
Table 93. Drax Group Plc Company Details
Table 94. Drax Group Plc Business Overview
Table 95. Drax Group Plc Bioenergy Product
Table 96. Drax Group Plc Revenue in Bioenergy Business (US$ Million), 2021–2026
Table 97. Drax Group Plc Recent Development
Table 98. Tianjin TEDA Resources Recycling Group Co., Ltd Company Details
Table 99. Tianjin TEDA Resources Recycling Group Co., Ltd Business Overview
Table 100. Tianjin TEDA Resources Recycling Group Co., Ltd Bioenergy Product
Table 101. Tianjin TEDA Resources Recycling Group Co., Ltd Revenue in Bioenergy Business (US$ Million), 2021–2026
Table 102. Tianjin TEDA Resources Recycling Group Co., Ltd Recent Development
Table 103. China Tianying Inc Company Details
Table 104. China Tianying Inc Business Overview
Table 105. China Tianying Inc Bioenergy Product
Table 106. China Tianying Inc Revenue in Bioenergy Business (US$ Million), 2021–2026
Table 107. China Tianying Inc Recent Development
Table 108. Henan Bccy Environmental Energy Co., Ltd Company Details
Table 109. Henan Bccy Environmental Energy Co., Ltd Business Overview
Table 110. Henan Bccy Environmental Energy Co., Ltd Bioenergy Product
Table 111. Henan Bccy Environmental Energy Co., Ltd Revenue in Bioenergy Business (US$ Million), 2021–2026
Table 112. Henan Bccy Environmental Energy Co., Ltd Recent Development
Table 113. Beijing China Sciences Runyu Environmental Technology Co., Ltd Company Details
Table 114. Beijing China Sciences Runyu Environmental Technology Co., Ltd Business Overview
Table 115. Beijing China Sciences Runyu Environmental Technology Co., Ltd Bioenergy Product
Table 116. Beijing China Sciences Runyu Environmental Technology Co., Ltd Revenue in Bioenergy Business (US$ Million), 2021–2026
Table 117. Beijing China Sciences Runyu Environmental Technology Co., Ltd Recent Development
Table 118. Dynagreen Environmental Protection Group Co., Ltd Company Details
Table 119. Dynagreen Environmental Protection Group Co., Ltd Business Overview
Table 120. Dynagreen Environmental Protection Group Co., Ltd Bioenergy Product
Table 121. Dynagreen Environmental Protection Group Co., Ltd Revenue in Bioenergy Business (US$ Million), 2021–2026
Table 122. Dynagreen Environmental Protection Group Co., Ltd Recent Development
Table 123. Yonker Environmental Protection Co., Ltd Company Details
Table 124. Yonker Environmental Protection Co., Ltd Business Overview
Table 125. Yonker Environmental Protection Co., Ltd Bioenergy Product
Table 126. Yonker Environmental Protection Co., Ltd Revenue in Bioenergy Business (US$ Million), 2021–2026
Table 127. Yonker Environmental Protection Co., Ltd Recent Development
Table 128. Reang Eco-Energy Corp., Ltd Company Details
Table 129. Reang Eco-Energy Corp., Ltd Business Overview
Table 130. Reang Eco-Energy Corp., Ltd Bioenergy Product
Table 131. Reang Eco-Energy Corp., Ltd Revenue in Bioenergy Business (US$ Million), 2021–2026
Table 132. Reang Eco-Energy Corp., Ltd Recent Development
Table 133. QiQuan Group Company Details
Table 134. QiQuan Group Business Overview
Table 135. QiQuan Group Bioenergy Product
Table 136. QiQuan Group Revenue in Bioenergy Business (US$ Million), 2021–2026
Table 137. QiQuan Group Recent Development
Table 138. Chongqing Sanfeng Environment Group Corp., Ltd Company Details
Table 139. Chongqing Sanfeng Environment Group Corp., Ltd Business Overview
Table 140. Chongqing Sanfeng Environment Group Corp., Ltd Bioenergy Product
Table 141. Chongqing Sanfeng Environment Group Corp., Ltd Revenue in Bioenergy Business (US$ Million), 2021–2026
Table 142. Chongqing Sanfeng Environment Group Corp., Ltd Recent Development
Table 143. China Everbright Environment Group Limited Company Details
Table 144. China Everbright Environment Group Limited Business Overview
Table 145. China Everbright Environment Group Limited Bioenergy Product
Table 146. China Everbright Environment Group Limited Revenue in Bioenergy Business (US$ Million), 2021–2026
Table 147. China Everbright Environment Group Limited Recent Development
Table 148. Sussus Environment Company Details
Table 149. Sussus Environment Business Overview
Table 150. Sussus Environment Bioenergy Product
Table 151. Sussus Environment Revenue in Bioenergy Business (US$ Million), 2021–2026
Table 152. Sussus Environment Recent Development
Table 153. Zhejiang Weiming Environment Protection Co., Ltd Company Details
Table 154. Zhejiang Weiming Environment Protection Co., Ltd Business Overview
Table 155. Zhejiang Weiming Environment Protection Co., Ltd Bioenergy Product
Table 156. Zhejiang Weiming Environment Protection Co., Ltd Revenue in Bioenergy Business (US$ Million), 2021–2026
Table 157. Zhejiang Weiming Environment Protection Co., Ltd Recent Development
Table 158. Infore Environment Technology Group Co., Ltd Company Details
Table 159. Infore Environment Technology Group Co., Ltd Business Overview
Table 160. Infore Environment Technology Group Co., Ltd Bioenergy Product
Table 161. Infore Environment Technology Group Co., Ltd Revenue in Bioenergy Business (US$ Million), 2021–2026
Table 162. Infore Environment Technology Group Co., Ltd Recent Development
Table 163. Research Programs/Design for This Report
Table 164. Key Data Information from Secondary Sources
Table 165. Key Data Information from Primary Sources
Table 166. Authors List of This Report
List of Figures
Figure 1. Bioenergy Picture
Figure 2. Global Bioenergy Market Size Comparison by Type (US$ Million), 2021–2032
Figure 3. Global Bioenergy Market Share by Type: 2025 vs 2032
Figure 4. Biomass Power Generation Features
Figure 5. Biomass Heating Features
Figure 6. Others Features
Figure 7. 1 Features
Figure 8. Global Bioenergy Market Size by Application (US$ Million), 2021–2032
Figure 9. Global Bioenergy Market Share by Application: 2025 vs 2032
Figure 10. Industrial Case Studies
Figure 11. Commerce/Residential Case Studies
Figure 12. Agriculture/Forestry Case Studies
Figure 13. Others Case Studies
Figure 14. Bioenergy Report Years Considered
Figure 15. Global Bioenergy Market Size (US$ Million), Year-over-Year: 2021–2032
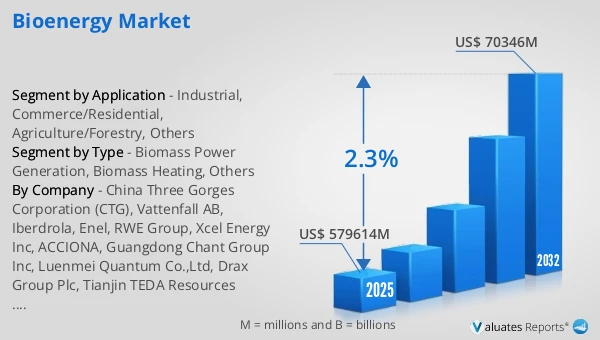
Figure 16. Global Bioenergy Market Size, (US$ Million), 2021 vs 2025 vs 2032
Figure 17. Global Bioenergy Market Share by Region: 2025 vs 2032
Figure 18. Global Bioenergy Market Share by Players in 2025
Figure 19. Global Bioenergy Market Share by Company Type (Tier 1, Tier 2, and Tier 3)
Figure 20. The Top 10 and 5 Players Market Share by Bioenergy Revenue in 2025
Figure 21. North America Bioenergy Market Size YoY Growth (US$ Million), 2021–2032
Figure 22. North America Bioenergy Market Share by Country (2021–2032)
Figure 23. United States Bioenergy Market Size YoY Growth (US$ Million), 2021–2032
Figure 24. Canada Bioenergy Market Size YoY Growth (US$ Million), 2021–2032
Figure 25. Europe Bioenergy Market Size YoY Growth (US$ Million), 2021–2032
Figure 26. Europe Bioenergy Market Share by Country (2021–2032)
Figure 27. Germany Bioenergy Market Size YoY Growth (US$ Million), 2021–2032
Figure 28. France Bioenergy Market Size YoY Growth (US$ Million), 2021–2032
Figure 29. U.K. Bioenergy Market Size YoY Growth (US$ Million), 2021–2032
Figure 30. Italy Bioenergy Market Size YoY Growth (US$ Million), 2021–2032
Figure 31. Russia Bioenergy Market Size YoY Growth (US$ Million), 2021–2032
Figure 32. Ireland Bioenergy Market Size YoY Growth (US$ Million), 2021–2032
Figure 33. Asia-Pacific Bioenergy Market Size YoY Growth (US$ Million), 2021–2032
Figure 34. Asia-Pacific Bioenergy Market Share by Region (2021–2032)
Figure 35. China Bioenergy Market Size YoY Growth (US$ Million), 2021–2032
Figure 36. Japan Bioenergy Market Size YoY Growth (US$ Million), 2021–2032
Figure 37. South Korea Bioenergy Market Size YoY Growth (US$ Million), 2021–2032
Figure 38. Southeast Asia Bioenergy Market Size YoY Growth (US$ Million), 2021–2032
Figure 39. India Bioenergy Market Size YoY Growth (US$ Million), 2021–2032
Figure 40. Australia & New Zealand Bioenergy Market Size YoY Growth (US$ Million), 2021–2032
Figure 41. Latin America Bioenergy Market Size YoY Growth (US$ Million), 2021–2032
Figure 42. Latin America Bioenergy Market Share by Country (2021–2032)
Figure 43. Mexico Bioenergy Market Size YoY Growth (US$ Million), 2021–2032
Figure 44. Brazil Bioenergy Market Size YoY Growth (US$ Million), 2021–2032
Figure 45. Middle East & Africa Bioenergy Market Size YoY Growth (US$ Million), 2021–2032
Figure 46. Middle East & Africa Bioenergy Market Share by Country (2021–2032)
Figure 47. Israel Bioenergy Market Size YoY Growth (US$ Million), 2021–2032
Figure 48. Saudi Arabia Bioenergy Market Size YoY Growth (US$ Million), 2021–2032
Figure 49. UAE Bioenergy Market Size YoY Growth (US$ Million), 2021–2032
Figure 50. China Three Gorges Corporation (CTG) Revenue Growth Rate in Bioenergy Business (2021–2026)
Figure 51. Vattenfall AB Revenue Growth Rate in Bioenergy Business (2021–2026)
Figure 52. Iberdrola Revenue Growth Rate in Bioenergy Business (2021–2026)
Figure 53. Enel Revenue Growth Rate in Bioenergy Business (2021–2026)
Figure 54. RWE Group Revenue Growth Rate in Bioenergy Business (2021–2026)
Figure 55. Xcel Energy Inc Revenue Growth Rate in Bioenergy Business (2021–2026)
Figure 56. ACCIONA Revenue Growth Rate in Bioenergy Business (2021–2026)
Figure 57. Guangdong Chant Group Inc Revenue Growth Rate in Bioenergy Business (2021–2026)
Figure 58. Luenmei Quantum Co.,Ltd Revenue Growth Rate in Bioenergy Business (2021–2026)
Figure 59. Drax Group Plc Revenue Growth Rate in Bioenergy Business (2021–2026)
Figure 60. Tianjin TEDA Resources Recycling Group Co., Ltd Revenue Growth Rate in Bioenergy Business (2021–2026)
Figure 61. China Tianying Inc Revenue Growth Rate in Bioenergy Business (2021–2026)
Figure 62. Henan Bccy Environmental Energy Co., Ltd Revenue Growth Rate in Bioenergy Business (2021–2026)
Figure 63. Beijing China Sciences Runyu Environmental Technology Co., Ltd Revenue Growth Rate in Bioenergy Business (2021–2026)
Figure 64. Dynagreen Environmental Protection Group Co., Ltd Revenue Growth Rate in Bioenergy Business (2021–2026)
Figure 65. Yonker Environmental Protection Co., Ltd Revenue Growth Rate in Bioenergy Business (2021–2026)
Figure 66. Reang Eco-Energy Corp., Ltd Revenue Growth Rate in Bioenergy Business (2021–2026)
Figure 67. QiQuan Group Revenue Growth Rate in Bioenergy Business (2021–2026)
Figure 68. Chongqing Sanfeng Environment Group Corp., Ltd Revenue Growth Rate in Bioenergy Business (2021–2026)
Figure 69. China Everbright Environment Group Limited Revenue Growth Rate in Bioenergy Business (2021–2026)
Figure 70. Sussus Environment Revenue Growth Rate in Bioenergy Business (2021–2026)
Figure 71. Zhejiang Weiming Environment Protection Co., Ltd Revenue Growth Rate in Bioenergy Business (2021–2026)
Figure 72. Infore Environment Technology Group Co., Ltd Revenue Growth Rate in Bioenergy Business (2021–2026)
Figure 73. Bottom-up and Top-down Approaches for This Report
Figure 74. Data Triangulation
Figure 75. Key Executives Interviewed