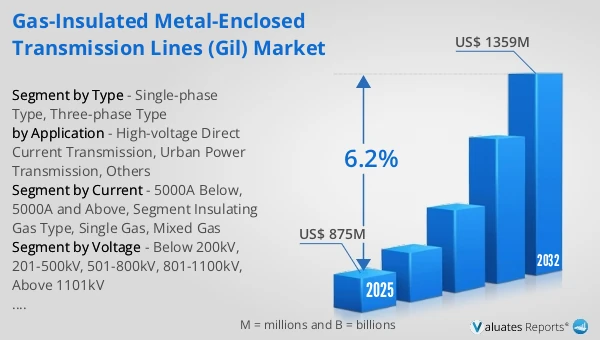
The global Gas-Insulated Metal-Enclosed Transmission Lines (GIL) market was valued at US$ 875 million in 2025 and is anticipated to reach US$ 1359 million by 2032, at a CAGR of 6.2% from 2026 to 2032.
Gas-Insulated Metal-Enclosed Transmission Lines (GIL) Market
The 2025 U.S. tariff policies introduce profound uncertainty into the global economic landscape. This report critically examines the implications of recent tariff adjustments and international strategic countermeasures on Gas-Insulated Metal-Enclosed Transmission Lines (GIL) competitive dynamics, regional economic interdependencies, and supply chain reconfigurations.
In 2025, global Gas-Insulated Metal-Enclosed Transmission Lines (GIL) production reached approximately 180 Km, with an average global market price of around 4.5-5.5M USD per Km.
A Gas-Insulated Metal-Enclosed Transmission Lines (GIL) is a high-voltage power transmission conductor enclosed inside a sealed, grounded metal tube and insulated by a pressurized insulating gas (SF₆ or mixed with N₂). In a typical design, an aluminum (or copper) conductor is centered within the tubular enclosure using solid insulating spacers, creating a coaxial structure that provides high dielectric strength, low losses, and strong shielding from external electromagnetic effects. GIL is used where overhead lines or conventional cables are difficult or undesirable—such as tunnels, urban corridors, river crossings, steep terrain, or substation interconnections—because it offers high transmission capacity, high reliability, and good thermal performance in a compact, mechanically robust form.
The upstream raw materials for Gas-Insulated Metal-Enclosed Transmission Lines (GIL) mainly include copper conductors, steel, aluminum and other shell and structural components, sulfur hexafluoride insulating gas, epoxy resin, polytetrafluoroethylene and other solid insulating materials, as well as sealing materials. Typical raw material suppliers include Baosteel, Jiangxi Copper, Linde, Honeywell, Hexafluo and others. Downstream applications are mainly in urban power transmission, high voltage direct current transmission and grid connection of renewable energy generation.
The single-line capacity of Gas-Insulated Metal-Enclosed Transmission Lines (GIL) varies greatly depending on voltage level, production shifts, and level of process automation, typically ranging from 50 to 100 kilometers. The industry's gross profit margin is higher than that of traditional power transmission equipment, generally ranging from 40% to 60%.
Gas-Insulated Metal-Enclosed Transmission Lines (GIL) is a high-voltage power transmission equipment that uses insulating gas as the medium and a metal pipe as the outer shell. It employs a compact structure with the conductor and shell coaxial, achieving efficient and safe power transmission through its sealed design, earning it the title of a "super pipeline" in the power transmission field. As a high-end alternative to traditional overhead lines and cables, GIL can flexibly adapt to complex scenarios such as outdoor environments, underground utility tunnels, cross-river and sea crossings, and high-altitude and frigid zones. It covers all voltage levels from high voltage to ultra-high voltage and is a key core piece of equipment connecting energy bases, urban power grids, and industrial load centers in new power systems. In the power generation sector, GIL applications are currently relatively mature, and its future development in pumped storage and nuclear power is expected to continue. However, GIL applications in urban high-capacity power transmission, industrial power, data centers, and energy storage power stations are still in their early stages.
GIL, with its unique advantages of high efficiency, stability, and environmental adaptability, precisely addresses the core pain points in the current power transmission field. Its sealed structure, combined with high-performance insulating gas, possesses both the low-loss and high-capacity characteristics of overhead lines and the small footprint and interference resistance advantages of cables. This perfectly solves the problems of limited space for undergrounding overhead lines in urban core areas and the scarcity of power transmission corridor resources in ecologically sensitive areas. The fully enclosed design effectively resists erosion from harsh environments such as wind, sandstorms, heavy rain, and salt spray, completely changing the current situation where traditional power transmission equipment is prone to failure and has high maintenance costs under extreme conditions. Currently, the construction of new power systems is accelerating globally, the demand for green electricity transmission from new energy bases is surging, coupled with policy drivers for urban underground utility tunnel construction and smart grid upgrades, further supported by breakthroughs in environmentally friendly insulating gas technology and the promotion of domestic substitution, all contributing to a strong and continuous development momentum for the GIL industry.
GIL, as a high-voltage, high-capacity power transmission technology, has been maturely applied in traditional power systems. With the explosion of AI, data centers are developing towards high power, high density, and high reliability. GIL technology, due to its unique advantages, may become a potential solution to the energy transmission bottleneck in data centers. For example, with the increasing use of high-power server racks in data centers, power distribution systems face high load pressure, with backbone transmission currents reaching over 3000A, requiring multi-circuit cables. GIL products can effectively replace the traditional multi-circuit cable layout in data centers, enabling high (medium) and low-voltage power distribution system layouts. The application potential of GIL in data centers and future intelligent computing and supercomputing centers is concentrated in three major scenarios: high-voltage, high-capacity power transmission, high-reliability power distribution, and green energy integration. It has certain application potential in power transmission for petabyte-level supercomputing centers or space-constrained urban data centers. Meanwhile, domestic urban power grid upgrades and new energy transmission projects will constitute core demands, and infrastructure expansion in emerging overseas markets will also open up new growth opportunities. Domestic companies, leveraging technological breakthroughs and accumulated engineering experience, are gradually gaining a dominant position in the global market.
This report delivers a comprehensive overview of the global Gas-Insulated Metal-Enclosed Transmission Lines (GIL) market, with both quantitative and qualitative analyses, to help readers develop growth strategies, assess the competitive landscape, evaluate their position in the current market, and make informed business decisions regarding Gas-Insulated Metal-Enclosed Transmission Lines (GIL). The Gas-Insulated Metal-Enclosed Transmission Lines (GIL) market size, estimates, and forecasts are provided in terms of output/shipments (Km) and revenue (US$ millions), with 2025 as the base year and historical and forecast data for 2021–2032.
The report segments the global Gas-Insulated Metal-Enclosed Transmission Lines (GIL) market comprehensively. Regional market sizes by Type, by Application, by Voltage, and by company are also provided. For deeper insight, the report profiles the competitive landscape, key competitors, and their respective market rankings, and discusses technological trends and new product developments.
This report will assist Gas-Insulated Metal-Enclosed Transmission Lines (GIL) manufacturers, new entrants, and companies across the industry value chain with information on revenues, production, and average prices for the overall market and its sub-segments, by company, by Type, by Application, and by region.
Market Segmentation
Scope of Gas-Insulated Metal-Enclosed Transmission Lines (GIL) Market Report
| Report Metric |
Details |
| Report Name |
Gas-Insulated Metal-Enclosed Transmission Lines (GIL) Market |
| Accounted market size in 2025 |
US$ 875 million |
| Forecasted market size in 2032 |
US$ 1359 million |
| CAGR |
6.2% |
| Base Year |
2025 |
| Forecasted years |
2026 - 2032 |
| Segment by Type |
- Single-phase Type
- Three-phase Type
|
| Segment by Voltage |
- Below 200kV
- 201-500kV
- 501-800kV
- 801-1100kV
- Above 1101kV
|
| Segment by Current |
- 5000A Below
- 5000A and Above
- Segment Insulating Gas Type
- Single Gas
- Mixed Gas
|
| by Application |
- High-voltage Direct Current Transmission
- Urban Power Transmission
- Others
|
| Production by Region |
- North America
- Europe
- China
- Japan
|
| Consumption by Region |
- North America (United States, Canada)
- Europe (Germany, France, UK, Italy, Russia)
- Asia-Pacific (China, Japan, South Korea, Taiwan)
- Southeast Asia (India)
- Latin America (Mexico, Brazil)
|
| By Company |
Siemens, GE, Hitachi, Toshiba, Jiangsu Ankura Smart Transmission Engineering Technology, Henan Pinggao Electric, Xian XD Switchgear Electric, Nari Technology, Shandong Electrical Engineering&Equipment, Shandong Taikai High-Volt Switchgear, Sieyuan Electric |
| Forecast units |
USD million in value |
| Report coverage |
Revenue and volume forecast, company share, competitive landscape, growth factors and trends |
Chapter Outline
- Chapter 1: Defines the scope of the report and presents an executive summary of market segments (by Type, by Application, by Voltage, etc.), including the size of each segment and its future growth potential. It offers a high-level view of the current market and its likely evolution in the short, medium, and long term.
- Chapter 2: Provides a detailed analysis of the competitive landscape for Gas-Insulated Metal-Enclosed Transmission Lines (GIL) manufacturers, including prices, production, value-based market shares, latest development plans, and information on mergers and acquisitions.
- Chapter 3: Examines Gas-Insulated Metal-Enclosed Transmission Lines (GIL) production/output and value by region and country, providing a quantitative assessment of market size and growth potential for each region over the next six years.
- Chapter 4: Analyzes Gas-Insulated Metal-Enclosed Transmission Lines (GIL) consumption at the regional and country levels. It quantifies market size and growth potential for each region and its key countries, and outlines market development, outlook, addressable space, and national production.
- Chapter 5: Analyzes market segments by Type, covering the size and growth potential of each segment to help readers identify “blue ocean” opportunities.
- Chapter 6: Analyzes market segments by Application, covering the size and growth potential of each segment to help readers identify “blue ocean” opportunities in downstream markets.
- Chapter 7: Profiles key players, detailing the fundamentals of major companies, including product production/output, value, price, gross margin, product portfolio/introductions, and recent developments.
- Chapter 8: Reviews the industry value chain, including upstream and downstream segments.
- Chapter 9: Discusses market dynamics and recent developments, including drivers, restraints, challenges and risks for manufacturers, U.S. Tariffs and relevant policy analysis.
- Chapter 10: Summarizes the key findings and conclusions of the report.
Ans: The main players in the Gas-Insulated Metal-Enclosed Transmission Lines (GIL) Market are Siemens, GE, Hitachi, Toshiba, Jiangsu Ankura Smart Transmission Engineering Technology, Henan Pinggao Electric, Xian XD Switchgear Electric, Nari Technology, Shandong Electrical Engineering&Equipment, Shandong Taikai High-Volt Switchgear, Sieyuan Electric
Ans: The Applications covered in the Gas-Insulated Metal-Enclosed Transmission Lines (GIL) Market report are High-voltage Direct Current Transmission, Urban Power Transmission, Others
Ans: The Types covered in the Gas-Insulated Metal-Enclosed Transmission Lines (GIL) Market report are Single-phase Type, Three-phase Type