List of Tables
Table 1. Global Old-age Facilities Construction Market Size Growth Rate by Scale (US$ Million): 2021 vs 2025 vs 2032
Table 2. Key Players of Nursery
Table 3. Key Players of Nursing Home for the Elderly
Table 4. Key Players of Senior Service Center
Table 5. Key Players of Nursing Home
Table 6. Key Players of Elderly Day Care Center
Table 7. Global Old-age Facilities Construction Market Size Growth Rate by Function (US$ Million): 2021 vs 2025 vs 2032
Table 8. Key Players of Self-care
Table 9. Key Players of Mediating
Table 10. Key Players of Nursing
Table 11. Global Old-age Facilities Construction Market Size Growth Rate by Service Object (US$ Million): 2021 vs 2025 vs 2032
Table 12. Key Players of Home Care Facilities
Table 13. Key Players of Community Pension Service Facilities
Table 14. Key Players of Institutional Retirement Facilities
Table 15. Global Old-age Facilities Construction Market Size Growth by Application (US$ Million): 2021 vs 2025 vs 2032
Table 16. Global Old-age Facilities Construction Market Size by Region (US$ Million): 2021 vs 2025 vs 2032
Table 17. Global Old-age Facilities Construction Market Size by Region (US$ Million), 2021–2026
Table 18. Global Old-age Facilities Construction Market Share by Region (2021–2026)
Table 19. Global Old-age Facilities Construction Forecasted Market Size by Region (US$ Million), 2027–2032
Table 20. Global Old-age Facilities Construction Market Share by Region (2027–2032)
Table 21. Old-age Facilities Construction Market Trends
Table 22. Old-age Facilities Construction Market Drivers
Table 23. Old-age Facilities Construction Market Challenges
Table 24. Old-age Facilities Construction Market Restraints
Table 25. Global Old-age Facilities Construction Revenue by Players (US$ Million), 2021–2026
Table 26. Global Old-age Facilities Construction Market Share by Players (2021–2026)
Table 27. Global Top Old-age Facilities Construction Players by Tier (Tier 1, Tier 2, and Tier 3), based on Old-age Facilities Construction Revenue, 2025
Table 28. Ranking of Global Top Old-age Facilities Construction Companies by Revenue (US$ Million) in 2025
Table 29. Global 5 Largest Players Market Share by Old-age Facilities Construction Revenue (CR5 and HHI), 2021–2026
Table 30. Global Key Players of Old-age Facilities Construction, Headquarters and Area Served
Table 31. Global Key Players of Old-age Facilities Construction, Products and Applications
Table 32. Global Key Players of Old-age Facilities Construction, Date of General Availability (GA)
Table 33. Mergers and Acquisitions, Expansion Plans
Table 34. Global Old-age Facilities Construction Market Size by Scale (US$ Million), 2021–2026
Table 35. Global Old-age Facilities Construction Revenue Market Share by Scale (2021–2026)
Table 36. Global Old-age Facilities Construction Forecasted Market Size by Scale (US$ Million), 2027–2032
Table 37. Global Old-age Facilities Construction Revenue Market Share by Scale (2027–2032)
Table 38. Global Old-age Facilities Construction Market Size by Application (US$ Million), 2021–2026
Table 39. Global Old-age Facilities Construction Revenue Market Share by Application (2021–2026)
Table 40. Global Old-age Facilities Construction Forecasted Market Size by Application (US$ Million), 2027–2032
Table 41. Global Old-age Facilities Construction Revenue Market Share by Application (2027–2032)
Table 42. North America Old-age Facilities Construction Market Size Growth Rate by Country (US$ Million): 2021 vs 2025 vs 2032
Table 43. North America Old-age Facilities Construction Market Size by Country (US$ Million), 2021–2026
Table 44. North America Old-age Facilities Construction Market Size by Country (US$ Million), 2027–2032
Table 45. Europe Old-age Facilities Construction Market Size Growth Rate by Country (US$ Million): 2021 vs 2025 vs 2032
Table 46. Europe Old-age Facilities Construction Market Size by Country (US$ Million), 2021–2026
Table 47. Europe Old-age Facilities Construction Market Size by Country (US$ Million), 2027–2032
Table 48. Asia-Pacific Old-age Facilities Construction Market Size Growth Rate by Region (US$ Million): 2021 vs 2025 vs 2032
Table 49. Asia-Pacific Old-age Facilities Construction Market Size by Region (US$ Million), 2021–2026
Table 50. Asia-Pacific Old-age Facilities Construction Market Size by Region (US$ Million), 2027–2032
Table 51. Latin America Old-age Facilities Construction Market Size Growth Rate by Country (US$ Million): 2021 vs 2025 vs 2032
Table 52. Latin America Old-age Facilities Construction Market Size by Country (US$ Million), 2021–2026
Table 53. Latin America Old-age Facilities Construction Market Size by Country (US$ Million), 2027–2032
Table 54. Middle East & Africa Old-age Facilities Construction Market Size Growth Rate by Country (US$ Million): 2021 vs 2025 vs 2032
Table 55. Middle East & Africa Old-age Facilities Construction Market Size by Country (US$ Million), 2021–2026
Table 56. Middle East & Africa Old-age Facilities Construction Market Size by Country (US$ Million), 2027–2032
Table 57. Atria Senior Living, Inc. Company Details
Table 58. Atria Senior Living, Inc. Business Overview
Table 59. Atria Senior Living, Inc. Old-age Facilities Construction Product
Table 60. Atria Senior Living, Inc. Revenue in Old-age Facilities Construction Business (US$ Million), 2021–2026
Table 61. Atria Senior Living, Inc. Recent Development
Table 62. Kindred Healthcare, Inc. Company Details
Table 63. Kindred Healthcare, Inc. Business Overview
Table 64. Kindred Healthcare, Inc. Old-age Facilities Construction Product
Table 65. Kindred Healthcare, Inc. Revenue in Old-age Facilities Construction Business (US$ Million), 2021–2026
Table 66. Kindred Healthcare, Inc. Recent Development
Table 67. Brookdale Senior Living Solutions Company Details
Table 68. Brookdale Senior Living Solutions Business Overview
Table 69. Brookdale Senior Living Solutions Old-age Facilities Construction Product
Table 70. Brookdale Senior Living Solutions Revenue in Old-age Facilities Construction Business (US$ Million), 2021–2026
Table 71. Brookdale Senior Living Solutions Recent Development
Table 72. Integral Senior Living Company Details
Table 73. Integral Senior Living Business Overview
Table 74. Integral Senior Living Old-age Facilities Construction Product
Table 75. Integral Senior Living Revenue in Old-age Facilities Construction Business (US$ Million), 2021–2026
Table 76. Integral Senior Living Recent Development
Table 77. Five Star Senior Living Company Details
Table 78. Five Star Senior Living Business Overview
Table 79. Five Star Senior Living Old-age Facilities Construction Product
Table 80. Five Star Senior Living Revenue in Old-age Facilities Construction Business (US$ Million), 2021–2026
Table 81. Five Star Senior Living Recent Development
Table 82. Sunrise Senior Living, Inc. Company Details
Table 83. Sunrise Senior Living, Inc. Business Overview
Table 84. Sunrise Senior Living, Inc. Old-age Facilities Construction Product
Table 85. Sunrise Senior Living, Inc. Revenue in Old-age Facilities Construction Business (US$ Million), 2021–2026
Table 86. Sunrise Senior Living, Inc. Recent Development
Table 87. Merrill Gardens Company Details
Table 88. Merrill Gardens Business Overview
Table 89. Merrill Gardens Old-age Facilities Construction Product
Table 90. Merrill Gardens Revenue in Old-age Facilities Construction Business (US$ Million), 2021–2026
Table 91. Merrill Gardens Recent Development
Table 92. Capital Senior Living Company Details
Table 93. Capital Senior Living Business Overview
Table 94. Capital Senior Living Old-age Facilities Construction Product
Table 95. Capital Senior Living Revenue in Old-age Facilities Construction Business (US$ Million), 2021–2026
Table 96. Capital Senior Living Recent Development
Table 97. Gardant Management Bradley Company Details
Table 98. Gardant Management Bradley Business Overview
Table 99. Gardant Management Bradley Old-age Facilities Construction Product
Table 100. Gardant Management Bradley Revenue in Old-age Facilities Construction Business (US$ Million), 2021–2026
Table 101. Gardant Management Bradley Recent Development
Table 102. Belmont Village Company Details
Table 103. Belmont Village Business Overview
Table 104. Belmont Village Old-age Facilities Construction Product
Table 105. Belmont Village Revenue in Old-age Facilities Construction Business (US$ Million), 2021–2026
Table 106. Belmont Village Recent Development
Table 107. CarDon & Associates Company Details
Table 108. CarDon & Associates Business Overview
Table 109. CarDon & Associates Old-age Facilities Construction Product
Table 110. CarDon & Associates Revenue in Old-age Facilities Construction Business (US$ Million), 2021–2026
Table 111. CarDon & Associates Recent Development
Table 112. Vi Senior Living Company Details
Table 113. Vi Senior Living Business Overview
Table 114. Vi Senior Living Old-age Facilities Construction Product
Table 115. Vi Senior Living Revenue in Old-age Facilities Construction Business (US$ Million), 2021–2026
Table 116. Vi Senior Living Recent Development
Table 117. Sonida Senior Living Company Details
Table 118. Sonida Senior Living Business Overview
Table 119. Sonida Senior Living Old-age Facilities Construction Product
Table 120. Sonida Senior Living Revenue in Old-age Facilities Construction Business (US$ Million), 2021–2026
Table 121. Sonida Senior Living Recent Development
Table 122. Extendicare Company Details
Table 123. Extendicare Business Overview
Table 124. Extendicare Old-age Facilities Construction Product
Table 125. Extendicare Revenue in Old-age Facilities Construction Business (US$ Million), 2021–2026
Table 126. Extendicare Recent Development
Table 127. Sienna Senior Living Company Details
Table 128. Sienna Senior Living Business Overview
Table 129. Sienna Senior Living Old-age Facilities Construction Product
Table 130. Sienna Senior Living Revenue in Old-age Facilities Construction Business (US$ Million), 2021–2026
Table 131. Sienna Senior Living Recent Development
Table 132. Churchill Living Company Details
Table 133. Churchill Living Business Overview
Table 134. Churchill Living Old-age Facilities Construction Product
Table 135. Churchill Living Revenue in Old-age Facilities Construction Business (US$ Million), 2021–2026
Table 136. Churchill Living Recent Development
Table 137. Holiday Retirement Company Details
Table 138. Holiday Retirement Business Overview
Table 139. Holiday Retirement Old-age Facilities Construction Product
Table 140. Holiday Retirement Revenue in Old-age Facilities Construction Business (US$ Million), 2021–2026
Table 141. Holiday Retirement Recent Development
Table 142. Life Care Services Company Details
Table 143. Life Care Services Business Overview
Table 144. Life Care Services Old-age Facilities Construction Product
Table 145. Life Care Services Revenue in Old-age Facilities Construction Business (US$ Million), 2021–2026
Table 146. Life Care Services Recent Development
Table 147. Shimao Property Company Details
Table 148. Shimao Property Business Overview
Table 149. Shimao Property Old-age Facilities Construction Product
Table 150. Shimao Property Revenue in Old-age Facilities Construction Business (US$ Million), 2021–2026
Table 151. Shimao Property Recent Development
Table 152. Sino-Ocean Group Company Details
Table 153. Sino-Ocean Group Business Overview
Table 154. Sino-Ocean Group Old-age Facilities Construction Product
Table 155. Sino-Ocean Group Revenue in Old-age Facilities Construction Business (US$ Million), 2021–2026
Table 156. Sino-Ocean Group Recent Development
Table 157. Longfor Group Company Details
Table 158. Longfor Group Business Overview
Table 159. Longfor Group Old-age Facilities Construction Product
Table 160. Longfor Group Revenue in Old-age Facilities Construction Business (US$ Million), 2021–2026
Table 161. Longfor Group Recent Development
Table 162. Poly Real Estate Company Details
Table 163. Poly Real Estate Business Overview
Table 164. Poly Real Estate Old-age Facilities Construction Product
Table 165. Poly Real Estate Revenue in Old-age Facilities Construction Business (US$ Million), 2021–2026
Table 166. Poly Real Estate Recent Development
Table 167. Vanke Company Details
Table 168. Vanke Business Overview
Table 169. Vanke Old-age Facilities Construction Product
Table 170. Vanke Revenue in Old-age Facilities Construction Business (US$ Million), 2021–2026
Table 171. Vanke Recent Development
Table 172. China Resources Land Company Details
Table 173. China Resources Land Business Overview
Table 174. China Resources Land Old-age Facilities Construction Product
Table 175. China Resources Land Revenue in Old-age Facilities Construction Business (US$ Million), 2021–2026
Table 176. China Resources Land Recent Development
Table 177. Beijing Capital Land Company Details
Table 178. Beijing Capital Land Business Overview
Table 179. Beijing Capital Land Old-age Facilities Construction Product
Table 180. Beijing Capital Land Revenue in Old-age Facilities Construction Business (US$ Million), 2021–2026
Table 181. Beijing Capital Land Recent Development
Table 182. Greenland Holdings Company Details
Table 183. Greenland Holdings Business Overview
Table 184. Greenland Holdings Old-age Facilities Construction Product
Table 185. Greenland Holdings Revenue in Old-age Facilities Construction Business (US$ Million), 2021–2026
Table 186. Greenland Holdings Recent Development
Table 187. Research Programs/Design for This Report
Table 188. Key Data Information from Secondary Sources
Table 189. Key Data Information from Primary Sources
Table 190. Authors List of This Report
List of Figures
Figure 1. Old-age Facilities Construction Picture
Figure 2. Global Old-age Facilities Construction Market Size Comparison by Scale (US$ Million), 2021–2032
Figure 3. Global Old-age Facilities Construction Market Share by Scale: 2025 vs 2032
Figure 4. Nursery Features
Figure 5. Nursing Home for the Elderly Features
Figure 6. Senior Service Center Features
Figure 7. Nursing Home Features
Figure 8. Elderly Day Care Center Features
Figure 9. Global Old-age Facilities Construction Market Size Comparison by Function (US$ Million), 2021–2032
Figure 10. Self-care Features
Figure 11. Mediating Features
Figure 12. Nursing Features
Figure 13. Global Old-age Facilities Construction Market Size Comparison by Service Object (US$ Million), 2021–2032
Figure 14. Home Care Facilities Features
Figure 15. Community Pension Service Facilities Features
Figure 16. Institutional Retirement Facilities Features
Figure 17. Global Old-age Facilities Construction Market Size by Application (US$ Million), 2021–2032
Figure 18. Global Old-age Facilities Construction Market Share by Application: 2025 vs 2032
Figure 19. More than 85 years Case Studies
Figure 20. 75-84 years Case Studies
Figure 21. 65-74 years Case Studies
Figure 22. Less than 65 years Case Studies
Figure 23. Old-age Facilities Construction Report Years Considered
Figure 24. Global Old-age Facilities Construction Market Size (US$ Million), Year-over-Year: 2021–2032
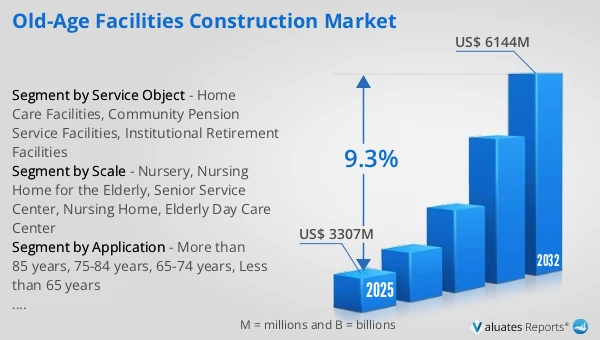
Figure 25. Global Old-age Facilities Construction Market Size, (US$ Million), 2021 vs 2025 vs 2032
Figure 26. Global Old-age Facilities Construction Market Share by Region: 2025 vs 2032
Figure 27. Global Old-age Facilities Construction Market Share by Players in 2025
Figure 28. Global Old-age Facilities Construction Market Share by Company Type (Tier 1, Tier 2, and Tier 3)
Figure 29. The Top 10 and 5 Players Market Share by Old-age Facilities Construction Revenue in 2025
Figure 30. North America Old-age Facilities Construction Market Size YoY Growth (US$ Million), 2021–2032
Figure 31. North America Old-age Facilities Construction Market Share by Country (2021–2032)
Figure 32. United States Old-age Facilities Construction Market Size YoY Growth (US$ Million), 2021–2032
Figure 33. Canada Old-age Facilities Construction Market Size YoY Growth (US$ Million), 2021–2032
Figure 34. Europe Old-age Facilities Construction Market Size YoY Growth (US$ Million), 2021–2032
Figure 35. Europe Old-age Facilities Construction Market Share by Country (2021–2032)
Figure 36. Germany Old-age Facilities Construction Market Size YoY Growth (US$ Million), 2021–2032
Figure 37. France Old-age Facilities Construction Market Size YoY Growth (US$ Million), 2021–2032
Figure 38. U.K. Old-age Facilities Construction Market Size YoY Growth (US$ Million), 2021–2032
Figure 39. Italy Old-age Facilities Construction Market Size YoY Growth (US$ Million), 2021–2032
Figure 40. Russia Old-age Facilities Construction Market Size YoY Growth (US$ Million), 2021–2032
Figure 41. Ireland Old-age Facilities Construction Market Size YoY Growth (US$ Million), 2021–2032
Figure 42. Asia-Pacific Old-age Facilities Construction Market Size YoY Growth (US$ Million), 2021–2032
Figure 43. Asia-Pacific Old-age Facilities Construction Market Share by Region (2021–2032)
Figure 44. China Old-age Facilities Construction Market Size YoY Growth (US$ Million), 2021–2032
Figure 45. Japan Old-age Facilities Construction Market Size YoY Growth (US$ Million), 2021–2032
Figure 46. South Korea Old-age Facilities Construction Market Size YoY Growth (US$ Million), 2021–2032
Figure 47. Southeast Asia Old-age Facilities Construction Market Size YoY Growth (US$ Million), 2021–2032
Figure 48. India Old-age Facilities Construction Market Size YoY Growth (US$ Million), 2021–2032
Figure 49. Australia & New Zealand Old-age Facilities Construction Market Size YoY Growth (US$ Million), 2021–2032
Figure 50. Latin America Old-age Facilities Construction Market Size YoY Growth (US$ Million), 2021–2032
Figure 51. Latin America Old-age Facilities Construction Market Share by Country (2021–2032)
Figure 52. Mexico Old-age Facilities Construction Market Size YoY Growth (US$ Million), 2021–2032
Figure 53. Brazil Old-age Facilities Construction Market Size YoY Growth (US$ Million), 2021–2032
Figure 54. Middle East & Africa Old-age Facilities Construction Market Size YoY Growth (US$ Million), 2021–2032
Figure 55. Middle East & Africa Old-age Facilities Construction Market Share by Country (2021–2032)
Figure 56. Israel Old-age Facilities Construction Market Size YoY Growth (US$ Million), 2021–2032
Figure 57. Saudi Arabia Old-age Facilities Construction Market Size YoY Growth (US$ Million), 2021–2032
Figure 58. UAE Old-age Facilities Construction Market Size YoY Growth (US$ Million), 2021–2032
Figure 59. Atria Senior Living, Inc. Revenue Growth Rate in Old-age Facilities Construction Business (2021–2026)
Figure 60. Kindred Healthcare, Inc. Revenue Growth Rate in Old-age Facilities Construction Business (2021–2026)
Figure 61. Brookdale Senior Living Solutions Revenue Growth Rate in Old-age Facilities Construction Business (2021–2026)
Figure 62. Integral Senior Living Revenue Growth Rate in Old-age Facilities Construction Business (2021–2026)
Figure 63. Five Star Senior Living Revenue Growth Rate in Old-age Facilities Construction Business (2021–2026)
Figure 64. Sunrise Senior Living, Inc. Revenue Growth Rate in Old-age Facilities Construction Business (2021–2026)
Figure 65. Merrill Gardens Revenue Growth Rate in Old-age Facilities Construction Business (2021–2026)
Figure 66. Capital Senior Living Revenue Growth Rate in Old-age Facilities Construction Business (2021–2026)
Figure 67. Gardant Management Bradley Revenue Growth Rate in Old-age Facilities Construction Business (2021–2026)
Figure 68. Belmont Village Revenue Growth Rate in Old-age Facilities Construction Business (2021–2026)
Figure 69. CarDon & Associates Revenue Growth Rate in Old-age Facilities Construction Business (2021–2026)
Figure 70. Vi Senior Living Revenue Growth Rate in Old-age Facilities Construction Business (2021–2026)
Figure 71. Sonida Senior Living Revenue Growth Rate in Old-age Facilities Construction Business (2021–2026)
Figure 72. Extendicare Revenue Growth Rate in Old-age Facilities Construction Business (2021–2026)
Figure 73. Sienna Senior Living Revenue Growth Rate in Old-age Facilities Construction Business (2021–2026)
Figure 74. Churchill Living Revenue Growth Rate in Old-age Facilities Construction Business (2021–2026)
Figure 75. Holiday Retirement Revenue Growth Rate in Old-age Facilities Construction Business (2021–2026)
Figure 76. Life Care Services Revenue Growth Rate in Old-age Facilities Construction Business (2021–2026)
Figure 77. Shimao Property Revenue Growth Rate in Old-age Facilities Construction Business (2021–2026)
Figure 78. Sino-Ocean Group Revenue Growth Rate in Old-age Facilities Construction Business (2021–2026)
Figure 79. Longfor Group Revenue Growth Rate in Old-age Facilities Construction Business (2021–2026)
Figure 80. Poly Real Estate Revenue Growth Rate in Old-age Facilities Construction Business (2021–2026)
Figure 81. Vanke Revenue Growth Rate in Old-age Facilities Construction Business (2021–2026)
Figure 82. China Resources Land Revenue Growth Rate in Old-age Facilities Construction Business (2021–2026)
Figure 83. Beijing Capital Land Revenue Growth Rate in Old-age Facilities Construction Business (2021–2026)
Figure 84. Greenland Holdings Revenue Growth Rate in Old-age Facilities Construction Business (2021–2026)
Figure 85. Bottom-up and Top-down Approaches for This Report
Figure 86. Data Triangulation
Figure 87. Key Executives Interviewed