List of Tables
Table 1. Global Chemical Storage and Logistics Market Size Growth Rate by Type (US$ Million): 2020 VS 2024 VS 2031
Table 2. Key Players of Chemical Storage
Table 3. Key Players of Chemical Logistics
Table 4. Global Chemical Storage and Logistics Market Size Growth Rate by Hazard Characteristics (US$ Million): 2020 VS 2024 VS 2031
Table 5. Key Players of Non-hazardous Chemical
Table 6. Key Players of Hazardous Chemical
Table 7. Global Chemical Storage and Logistics Market Size Growth Rate by Transport Mode (US$ Million): 2020 VS 2024 VS 2031
Table 8. Key Players of Railway Transport
Table 9. Key Players of Waterway Transport
Table 10. Key Players of Pipeline Transport
Table 11. Key Players of Multimodal Transport
Table 12. Global Chemical Storage and Logistics Market Size Growth by Application (US$ Million): 2020 VS 2024 VS 2031
Table 13. Global Chemical Storage and Logistics Market Size by Region (US$ Million): 2020 VS 2024 VS 2031
Table 14. Global Chemical Storage and Logistics Market Size by Region (2020-2025) & (US$ Million)
Table 15. Global Chemical Storage and Logistics Market Share by Region (2020-2025)
Table 16. Global Chemical Storage and Logistics Forecasted Market Size by Region (2026-2031) & (US$ Million)
Table 17. Global Chemical Storage and Logistics Market Share by Region (2026-2031)
Table 18. Chemical Storage and Logistics Market Trends
Table 19. Chemical Storage and Logistics Market Drivers
Table 20. Chemical Storage and Logistics Market Challenges
Table 21. Chemical Storage and Logistics Market Restraints
Table 22. Global Chemical Storage and Logistics Revenue by Players (2020-2025) & (US$ Million)
Table 23. Global Chemical Storage and Logistics Market Share by Players (2020-2025)
Table 24. Global Top Chemical Storage and Logistics Players by Company Type (Tier 1, Tier 2, and Tier 3) & (based on the Revenue in Chemical Storage and Logistics as of 2024)
Table 25. Ranking of Global Top Chemical Storage and Logistics Companies by Revenue (US$ Million) in 2024
Table 26. Global 5 Largest Players Market Share by Chemical Storage and Logistics Revenue (CR5 and HHI) & (2020-2025)
Table 27. Global Key Players of Chemical Storage and Logistics, Headquarters and Area Served
Table 28. Global Key Players of Chemical Storage and Logistics, Product and Application
Table 29. Global Key Players of Chemical Storage and Logistics, Date of Enter into This Industry
Table 30. Mergers & Acquisitions, Expansion Plans
Table 31. Global Chemical Storage and Logistics Market Size by Type (2020-2025) & (US$ Million)
Table 32. Global Chemical Storage and Logistics Revenue Market Share by Type (2020-2025)
Table 33. Global Chemical Storage and Logistics Forecasted Market Size by Type (2026-2031) & (US$ Million)
Table 34. Global Chemical Storage and Logistics Revenue Market Share by Type (2026-2031)
Table 35. Global Chemical Storage and Logistics Market Size by Application (2020-2025) & (US$ Million)
Table 36. Global Chemical Storage and Logistics Revenue Market Share by Application (2020-2025)
Table 37. Global Chemical Storage and Logistics Forecasted Market Size by Application (2026-2031) & (US$ Million)
Table 38. Global Chemical Storage and Logistics Revenue Market Share by Application (2026-2031)
Table 39. North America Chemical Storage and Logistics Market Size Growth Rate by Country (US$ Million): 2020 VS 2024 VS 2031
Table 40. North America Chemical Storage and Logistics Market Size by Country (2020-2025) & (US$ Million)
Table 41. North America Chemical Storage and Logistics Market Size by Country (2026-2031) & (US$ Million)
Table 42. Europe Chemical Storage and Logistics Market Size Growth Rate by Country (US$ Million): 2020 VS 2024 VS 2031
Table 43. Europe Chemical Storage and Logistics Market Size by Country (2020-2025) & (US$ Million)
Table 44. Europe Chemical Storage and Logistics Market Size by Country (2026-2031) & (US$ Million)
Table 45. Asia-Pacific Chemical Storage and Logistics Market Size Growth Rate by Region (US$ Million): 2020 VS 2024 VS 2031
Table 46. Asia-Pacific Chemical Storage and Logistics Market Size by Region (2020-2025) & (US$ Million)
Table 47. Asia-Pacific Chemical Storage and Logistics Market Size by Region (2026-2031) & (US$ Million)
Table 48. Latin America Chemical Storage and Logistics Market Size Growth Rate by Country (US$ Million): 2020 VS 2024 VS 2031
Table 49. Latin America Chemical Storage and Logistics Market Size by Country (2020-2025) & (US$ Million)
Table 50. Latin America Chemical Storage and Logistics Market Size by Country (2026-2031) & (US$ Million)
Table 51. Middle East & Africa Chemical Storage and Logistics Market Size Growth Rate by Country (US$ Million): 2020 VS 2024 VS 2031
Table 52. Middle East & Africa Chemical Storage and Logistics Market Size by Country (2020-2025) & (US$ Million)
Table 53. Middle East & Africa Chemical Storage and Logistics Market Size by Country (2026-2031) & (US$ Million)
Table 54. Rhenus Company Details
Table 55. Rhenus Business Overview
Table 56. Rhenus Chemical Storage and Logistics Product
Table 57. Rhenus Revenue in Chemical Storage and Logistics Business (2020-2025) & (US$ Million)
Table 58. Rhenus Recent Development
Table 59. Kinder Morgan Company Details
Table 60. Kinder Morgan Business Overview
Table 61. Kinder Morgan Chemical Storage and Logistics Product
Table 62. Kinder Morgan Revenue in Chemical Storage and Logistics Business (2020-2025) & (US$ Million)
Table 63. Kinder Morgan Recent Development
Table 64. DHL Company Details
Table 65. DHL Business Overview
Table 66. DHL Chemical Storage and Logistics Product
Table 67. DHL Revenue in Chemical Storage and Logistics Business (2020-2025) & (US$ Million)
Table 68. DHL Recent Development
Table 69. DB Schenker Company Details
Table 70. DB Schenker Business Overview
Table 71. DB Schenker Chemical Storage and Logistics Product
Table 72. DB Schenker Revenue in Chemical Storage and Logistics Business (2020-2025) & (US$ Million)
Table 73. DB Schenker Recent Development
Table 74. C.H. Robinson Company Details
Table 75. C.H. Robinson Business Overview
Table 76. C.H. Robinson Chemical Storage and Logistics Product
Table 77. C.H. Robinson Revenue in Chemical Storage and Logistics Business (2020-2025) & (US$ Million)
Table 78. C.H. Robinson Recent Development
Table 79. SINOPEC Pipeline Storage & Transportation Company Details
Table 80. SINOPEC Pipeline Storage & Transportation Business Overview
Table 81. SINOPEC Pipeline Storage & Transportation Chemical Storage and Logistics Product
Table 82. SINOPEC Pipeline Storage & Transportation Revenue in Chemical Storage and Logistics Business (2020-2025) & (US$ Million)
Table 83. SINOPEC Pipeline Storage & Transportation Recent Development
Table 84. BDP International Company Details
Table 85. BDP International Business Overview
Table 86. BDP International Chemical Storage and Logistics Product
Table 87. BDP International Revenue in Chemical Storage and Logistics Business (2020-2025) & (US$ Million)
Table 88. BDP International Recent Development
Table 89. DACHSER Company Details
Table 90. DACHSER Business Overview
Table 91. DACHSER Chemical Storage and Logistics Product
Table 92. DACHSER Revenue in Chemical Storage and Logistics Business (2020-2025) & (US$ Million)
Table 93. DACHSER Recent Development
Table 94. Agility Company Details
Table 95. Agility Business Overview
Table 96. Agility Chemical Storage and Logistics Product
Table 97. Agility Revenue in Chemical Storage and Logistics Business (2020-2025) & (US$ Million)
Table 98. Agility Recent Development
Table 99. A&R Logistics Company Details
Table 100. A&R Logistics Business Overview
Table 101. A&R Logistics Chemical Storage and Logistics Product
Table 102. A&R Logistics Revenue in Chemical Storage and Logistics Business (2020-2025) & (US$ Million)
Table 103. A&R Logistics Recent Development
Table 104. Odyssey Company Details
Table 105. Odyssey Business Overview
Table 106. Odyssey Chemical Storage and Logistics Product
Table 107. Odyssey Revenue in Chemical Storage and Logistics Business (2020-2025) & (US$ Million)
Table 108. Odyssey Recent Development
Table 109. Mecalux Company Details
Table 110. Mecalux Business Overview
Table 111. Mecalux Chemical Storage and Logistics Product
Table 112. Mecalux Revenue in Chemical Storage and Logistics Business (2020-2025) & (US$ Million)
Table 113. Mecalux Recent Development
Table 114. Milkyway Company Details
Table 115. Milkyway Business Overview
Table 116. Milkyway Chemical Storage and Logistics Product
Table 117. Milkyway Revenue in Chemical Storage and Logistics Business (2020-2025) & (US$ Million)
Table 118. Milkyway Recent Development
Table 119. SINOTRANS Company Details
Table 120. SINOTRANS Business Overview
Table 121. SINOTRANS Chemical Storage and Logistics Product
Table 122. SINOTRANS Revenue in Chemical Storage and Logistics Business (2020-2025) & (US$ Million)
Table 123. SINOTRANS Recent Development
Table 124. Hub Group Company Details
Table 125. Hub Group Business Overview
Table 126. Hub Group Chemical Storage and Logistics Product
Table 127. Hub Group Revenue in Chemical Storage and Logistics Business (2020-2025) & (US$ Million)
Table 128. Hub Group Recent Development
Table 129. Sinochem Group Company Details
Table 130. Sinochem Group Business Overview
Table 131. Sinochem Group Chemical Storage and Logistics Product
Table 132. Sinochem Group Revenue in Chemical Storage and Logistics Business (2020-2025) & (US$ Million)
Table 133. Sinochem Group Recent Development
Table 134. Jingbo Logistics Company Details
Table 135. Jingbo Logistics Business Overview
Table 136. Jingbo Logistics Chemical Storage and Logistics Product
Table 137. Jingbo Logistics Revenue in Chemical Storage and Logistics Business (2020-2025) & (US$ Million)
Table 138. Jingbo Logistics Recent Development
Table 139. Freetrade Science & Technology Company Details
Table 140. Freetrade Science & Technology Business Overview
Table 141. Freetrade Science & Technology Chemical Storage and Logistics Product
Table 142. Freetrade Science & Technology Revenue in Chemical Storage and Logistics Business (2020-2025) & (US$ Million)
Table 143. Freetrade Science & Technology Recent Development
Table 144. FW Logistics Company Details
Table 145. FW Logistics Business Overview
Table 146. FW Logistics Chemical Storage and Logistics Product
Table 147. FW Logistics Revenue in Chemical Storage and Logistics Business (2020-2025) & (US$ Million)
Table 148. FW Logistics Recent Development
Table 149. Amware Company Details
Table 150. Amware Business Overview
Table 151. Amware Chemical Storage and Logistics Product
Table 152. Amware Revenue in Chemical Storage and Logistics Business (2020-2025) & (US$ Million)
Table 153. Amware Recent Development
Table 154. LogCoop GmbH Company Details
Table 155. LogCoop GmbH Business Overview
Table 156. LogCoop GmbH Chemical Storage and Logistics Product
Table 157. LogCoop GmbH Revenue in Chemical Storage and Logistics Business (2020-2025) & (US$ Million)
Table 158. LogCoop GmbH Recent Development
Table 159. ADLI Logistics Company Details
Table 160. ADLI Logistics Business Overview
Table 161. ADLI Logistics Chemical Storage and Logistics Product
Table 162. ADLI Logistics Revenue in Chemical Storage and Logistics Business (2020-2025) & (US$ Million)
Table 163. ADLI Logistics Recent Development
Table 164. Broekman Logistics Company Details
Table 165. Broekman Logistics Business Overview
Table 166. Broekman Logistics Chemical Storage and Logistics Product
Table 167. Broekman Logistics Revenue in Chemical Storage and Logistics Business (2020-2025) & (US$ Million)
Table 168. Broekman Logistics Recent Development
Table 169. Pfenning logistics Company Details
Table 170. Pfenning logistics Business Overview
Table 171. Pfenning logistics Chemical Storage and Logistics Product
Table 172. Pfenning logistics Revenue in Chemical Storage and Logistics Business (2020-2025) & (US$ Million)
Table 173. Pfenning logistics Recent Development
Table 174. Metrix Logistics Group Company Details
Table 175. Metrix Logistics Group Business Overview
Table 176. Metrix Logistics Group Chemical Storage and Logistics Product
Table 177. Metrix Logistics Group Revenue in Chemical Storage and Logistics Business (2020-2025) & (US$ Million)
Table 178. Metrix Logistics Group Recent Development
Table 179. Keppel Logistics Company Details
Table 180. Keppel Logistics Business Overview
Table 181. Keppel Logistics Chemical Storage and Logistics Product
Table 182. Keppel Logistics Revenue in Chemical Storage and Logistics Business (2020-2025) & (US$ Million)
Table 183. Keppel Logistics Recent Development
Table 184. Grupo Marítima Sureste Company Details
Table 185. Grupo Marítima Sureste Business Overview
Table 186. Grupo Marítima Sureste Chemical Storage and Logistics Product
Table 187. Grupo Marítima Sureste Revenue in Chemical Storage and Logistics Business (2020-2025) & (US$ Million)
Table 188. Grupo Marítima Sureste Recent Development
Table 189. Palisades Logistics Company Details
Table 190. Palisades Logistics Business Overview
Table 191. Palisades Logistics Chemical Storage and Logistics Product
Table 192. Palisades Logistics Revenue in Chemical Storage and Logistics Business (2020-2025) & (US$ Million)
Table 193. Palisades Logistics Recent Development
Table 194. Value Chemical Logistics Company Details
Table 195. Value Chemical Logistics Business Overview
Table 196. Value Chemical Logistics Chemical Storage and Logistics Product
Table 197. Value Chemical Logistics Revenue in Chemical Storage and Logistics Business (2020-2025) & (US$ Million)
Table 198. Value Chemical Logistics Recent Development
Table 199. Bdtrans Company Details
Table 200. Bdtrans Business Overview
Table 201. Bdtrans Chemical Storage and Logistics Product
Table 202. Bdtrans Revenue in Chemical Storage and Logistics Business (2020-2025) & (US$ Million)
Table 203. Bdtrans Recent Development
Table 204. Research Programs/Design for This Report
Table 205. Key Data Information from Secondary Sources
Table 206. Key Data Information from Primary Sources
Table 207. Authors List of This Report
List of Figures
Figure 1. Chemical Storage and Logistics Picture
Figure 2. Global Chemical Storage and Logistics Market Size Comparison by Type (2020-2031) & (US$ Million)
Figure 3. Global Chemical Storage and Logistics Market Share by Type: 2024 VS 2031
Figure 4. Chemical Storage Features
Figure 5. Chemical Logistics Features
Figure 6. Global Chemical Storage and Logistics Market Size Comparison by Hazard Characteristics (2020-2031) & (US$ Million)
Figure 7. Non-hazardous Chemical Features
Figure 8. Hazardous Chemical Features
Figure 9. Global Chemical Storage and Logistics Market Size Comparison by Transport Mode (2020-2031) & (US$ Million)
Figure 10. Railway Transport Features
Figure 11. Waterway Transport Features
Figure 12. Pipeline Transport Features
Figure 13. Multimodal Transport Features
Figure 14. Global Chemical Storage and Logistics Market Size by Application (2020-2031) & (US$ Million)
Figure 15. Global Chemical Storage and Logistics Market Share by Application: 2024 VS 2031
Figure 16. Chemicals Case Studies
Figure 17. Agriculture Case Studies
Figure 18. Pharmaceuticals Case Studies
Figure 19. Electronics Case Studies
Figure 20. Others Case Studies
Figure 21. Chemical Storage and Logistics Report Years Considered
Figure 22. Global Chemical Storage and Logistics Market Size (US$ Million), Year-over-Year: 2020-2031
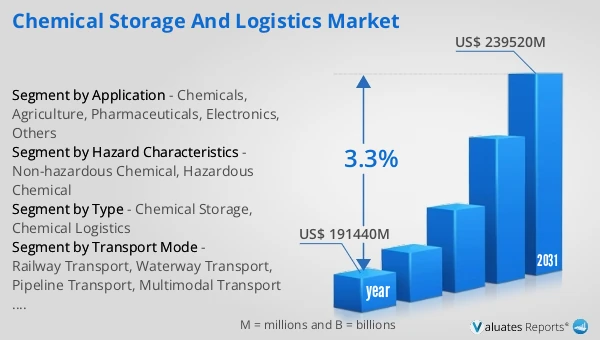
Figure 23. Global Chemical Storage and Logistics Market Size, (US$ Million), 2020 VS 2024 VS 2031
Figure 24. Global Chemical Storage and Logistics Market Share by Region: 2024 VS 2031
Figure 25. Global Chemical Storage and Logistics Market Share by Players in 2024
Figure 26. Global Chemical Storage and Logistics Market Share by Company Type (Tier 1, Tier 2, and Tier 3)
Figure 27. The Top 10 and 5 Players Market Share by Chemical Storage and Logistics Revenue in 2024
Figure 28. North America Chemical Storage and Logistics Market Size YoY Growth (2020-2031) & (US$ Million)
Figure 29. North America Chemical Storage and Logistics Market Share by Country (2020-2031)
Figure 30. United States Chemical Storage and Logistics Market Size YoY Growth (2020-2031) & (US$ Million)
Figure 31. Canada Chemical Storage and Logistics Market Size YoY Growth (2020-2031) & (US$ Million)
Figure 32. Europe Chemical Storage and Logistics Market Size YoY Growth (2020-2031) & (US$ Million)
Figure 33. Europe Chemical Storage and Logistics Market Share by Country (2020-2031)
Figure 34. Germany Chemical Storage and Logistics Market Size YoY Growth (2020-2031) & (US$ Million)
Figure 35. France Chemical Storage and Logistics Market Size YoY Growth (2020-2031) & (US$ Million)
Figure 36. U.K. Chemical Storage and Logistics Market Size YoY Growth (2020-2031) & (US$ Million)
Figure 37. Italy Chemical Storage and Logistics Market Size YoY Growth (2020-2031) & (US$ Million)
Figure 38. Russia Chemical Storage and Logistics Market Size YoY Growth (2020-2031) & (US$ Million)
Figure 39. Ireland Chemical Storage and Logistics Market Size YoY Growth (2020-2031) & (US$ Million)
Figure 40. Asia-Pacific Chemical Storage and Logistics Market Size YoY Growth (2020-2031) & (US$ Million)
Figure 41. Asia-Pacific Chemical Storage and Logistics Market Share by Region (2020-2031)
Figure 42. China Chemical Storage and Logistics Market Size YoY Growth (2020-2031) & (US$ Million)
Figure 43. Japan Chemical Storage and Logistics Market Size YoY Growth (2020-2031) & (US$ Million)
Figure 44. South Korea Chemical Storage and Logistics Market Size YoY Growth (2020-2031) & (US$ Million)
Figure 45. Southeast Asia Chemical Storage and Logistics Market Size YoY Growth (2020-2031) & (US$ Million)
Figure 46. India Chemical Storage and Logistics Market Size YoY Growth (2020-2031) & (US$ Million)
Figure 47. Australia & New Zealand Chemical Storage and Logistics Market Size YoY Growth (2020-2031) & (US$ Million)
Figure 48. Latin America Chemical Storage and Logistics Market Size YoY Growth (2020-2031) & (US$ Million)
Figure 49. Latin America Chemical Storage and Logistics Market Share by Country (2020-2031)
Figure 50. Mexico Chemical Storage and Logistics Market Size YoY Growth (2020-2031) & (US$ Million)
Figure 51. Brazil Chemical Storage and Logistics Market Size YoY Growth (2020-2031) & (US$ Million)
Figure 52. Middle East & Africa Chemical Storage and Logistics Market Size YoY Growth (2020-2031) & (US$ Million)
Figure 53. Middle East & Africa Chemical Storage and Logistics Market Share by Country (2020-2031)
Figure 54. Israel Chemical Storage and Logistics Market Size YoY Growth (2020-2031) & (US$ Million)
Figure 55. Saudi Arabia Chemical Storage and Logistics Market Size YoY Growth (2020-2031) & (US$ Million)
Figure 56. UAE Chemical Storage and Logistics Market Size YoY Growth (2020-2031) & (US$ Million)
Figure 57. Rhenus Revenue Growth Rate in Chemical Storage and Logistics Business (2020-2025)
Figure 58. Kinder Morgan Revenue Growth Rate in Chemical Storage and Logistics Business (2020-2025)
Figure 59. DHL Revenue Growth Rate in Chemical Storage and Logistics Business (2020-2025)
Figure 60. DB Schenker Revenue Growth Rate in Chemical Storage and Logistics Business (2020-2025)
Figure 61. C.H. Robinson Revenue Growth Rate in Chemical Storage and Logistics Business (2020-2025)
Figure 62. SINOPEC Pipeline Storage & Transportation Revenue Growth Rate in Chemical Storage and Logistics Business (2020-2025)
Figure 63. BDP International Revenue Growth Rate in Chemical Storage and Logistics Business (2020-2025)
Figure 64. DACHSER Revenue Growth Rate in Chemical Storage and Logistics Business (2020-2025)
Figure 65. Agility Revenue Growth Rate in Chemical Storage and Logistics Business (2020-2025)
Figure 66. A&R Logistics Revenue Growth Rate in Chemical Storage and Logistics Business (2020-2025)
Figure 67. Odyssey Revenue Growth Rate in Chemical Storage and Logistics Business (2020-2025)
Figure 68. Mecalux Revenue Growth Rate in Chemical Storage and Logistics Business (2020-2025)
Figure 69. Milkyway Revenue Growth Rate in Chemical Storage and Logistics Business (2020-2025)
Figure 70. SINOTRANS Revenue Growth Rate in Chemical Storage and Logistics Business (2020-2025)
Figure 71. Hub Group Revenue Growth Rate in Chemical Storage and Logistics Business (2020-2025)
Figure 72. Sinochem Group Revenue Growth Rate in Chemical Storage and Logistics Business (2020-2025)
Figure 73. Jingbo Logistics Revenue Growth Rate in Chemical Storage and Logistics Business (2020-2025)
Figure 74. Freetrade Science & Technology Revenue Growth Rate in Chemical Storage and Logistics Business (2020-2025)
Figure 75. FW Logistics Revenue Growth Rate in Chemical Storage and Logistics Business (2020-2025)
Figure 76. Amware Revenue Growth Rate in Chemical Storage and Logistics Business (2020-2025)
Figure 77. LogCoop GmbH Revenue Growth Rate in Chemical Storage and Logistics Business (2020-2025)
Figure 78. ADLI Logistics Revenue Growth Rate in Chemical Storage and Logistics Business (2020-2025)
Figure 79. Broekman Logistics Revenue Growth Rate in Chemical Storage and Logistics Business (2020-2025)
Figure 80. Pfenning logistics Revenue Growth Rate in Chemical Storage and Logistics Business (2020-2025)
Figure 81. Metrix Logistics Group Revenue Growth Rate in Chemical Storage and Logistics Business (2020-2025)
Figure 82. Keppel Logistics Revenue Growth Rate in Chemical Storage and Logistics Business (2020-2025)
Figure 83. Grupo Marítima Sureste Revenue Growth Rate in Chemical Storage and Logistics Business (2020-2025)
Figure 84. Palisades Logistics Revenue Growth Rate in Chemical Storage and Logistics Business (2020-2025)
Figure 85. Value Chemical Logistics Revenue Growth Rate in Chemical Storage and Logistics Business (2020-2025)
Figure 86. Bdtrans Revenue Growth Rate in Chemical Storage and Logistics Business (2020-2025)
Figure 87. Bottom-up and Top-down Approaches for This Report
Figure 88. Data Triangulation
Figure 89. Key Executives Interviewed