List of Tables
Table 1. Landscaping Services Market Trends
Table 2. Landscaping Services Market Drivers & Opportunity
Table 3. Landscaping Services Market Challenges
Table 4. Landscaping Services Market Restraints
Table 5. Global Landscaping Services Revenue by Company (2019-2024) & (US$ Million)
Table 6. Global Landscaping Services Revenue Market Share by Company (2019-2024)
Table 7. Key Companies Landscaping Services Manufacturing Base Distribution and Headquarters
Table 8. Key Companies Landscaping Services Product Type
Table 9. Key Companies Time to Begin Mass Production of Landscaping Services
Table 10. Global Landscaping Services Companies Market Concentration Ratio (CR5 and HHI)
Table 11. Global Top Companies Market Share by Company Type (Tier 1, Tier 2, and Tier 3) & (based on the Revenue in Landscaping Services as of 2023)
Table 12. Mergers & Acquisitions, Expansion Plans
Table 13. Global Landscaping Services Sales Value by Type: 2019 VS 2023 VS 2030 (US$ Million)
Table 14. Global Landscaping Services Sales Value by Type (2019-2024) & (US$ Million)
Table 15. Global Landscaping Services Sales Value by Type (2025-2030) & (US$ Million)
Table 16. Global Landscaping Services Sales Market Share in Value by Type (2019-2024) & (%)
Table 17. Global Landscaping Services Sales Market Share in Value by Type (2025-2030) & (%)
Table 18. Global Landscaping Services Sales Value by Application: 2019 VS 2023 VS 2030 (US$ Million)
Table 19. Global Landscaping Services Sales Value by Application (2019-2024) & (US$ Million)
Table 20. Global Landscaping Services Sales Value by Application (2025-2030) & (US$ Million)
Table 21. Global Landscaping Services Sales Market Share in Value by Application (2019-2024) & (%)
Table 22. Global Landscaping Services Sales Market Share in Value by Application (2025-2030) & (%)
Table 23. Global Landscaping Services Sales Value by Region: 2019 VS 2023 VS 2030 (US$ Million)
Table 24. Global Landscaping Services Sales Value by Region (2019-2024) & (US$ Million)
Table 25. Global Landscaping Services Sales Value by Region (2025-2030) & (US$ Million)
Table 26. Global Landscaping Services Sales Value by Region (2019-2024) & (%)
Table 27. Global Landscaping Services Sales Value by Region (2025-2030) & (%)
Table 28. Key Countries/Regions Landscaping Services Sales Value Growth Trends, (US$ Million): 2019 VS 2023 VS 2030
Table 29. Key Countries/Regions Landscaping Services Sales Value, (2019-2024) & (US$ Million)
Table 30. Key Countries/Regions Landscaping Services Sales Value, (2025-2030) & (US$ Million)
Table 31. Asplundh Tree Expert Basic Information List
Table 32. Asplundh Tree Expert Description and Business Overview
Table 33. Asplundh Tree Expert Landscaping Services Products, Services and Solutions
Table 34. Revenue (US$ Million) in Landscaping Services Business of Asplundh Tree Expert (2019-2024)
Table 35. Asplundh Tree Expert Recent Developments
Table 36. BrightView Landscapes Basic Information List
Table 37. BrightView Landscapes Description and Business Overview
Table 38. BrightView Landscapes Landscaping Services Products, Services and Solutions
Table 39. Revenue (US$ Million) in Landscaping Services Business of BrightView Landscapes (2019-2024)
Table 40. BrightView Landscapes Recent Developments
Table 41. The Davey Tree Expert Company Basic Information List
Table 42. The Davey Tree Expert Company Description and Business Overview
Table 43. The Davey Tree Expert Company Landscaping Services Products, Services and Solutions
Table 44. Revenue (US$ Million) in Landscaping Services Business of The Davey Tree Expert Company (2019-2024)
Table 45. The Davey Tree Expert Company Recent Developments
Table 46. TruGreen Basic Information List
Table 47. TruGreen Description and Business Overview
Table 48. TruGreen Landscaping Services Products, Services and Solutions
Table 49. Revenue (US$ Million) in Landscaping Services Business of TruGreen (2019-2024)
Table 50. TruGreen Recent Developments
Table 51. Active Tree Services Basic Information List
Table 52. Active Tree Services Description and Business Overview
Table 53. Active Tree Services Landscaping Services Products, Services and Solutions
Table 54. Revenue (US$ Million) in Landscaping Services Business of Active Tree Services (2019-2024)
Table 55. Active Tree Services Recent Developments
Table 56. Adverse Basic Information List
Table 57. Adverse Description and Business Overview
Table 58. Adverse Landscaping Services Products, Services and Solutions
Table 59. Revenue (US$ Million) in Landscaping Services Business of Adverse (2019-2024)
Table 60. Adverse Recent Developments
Table 61. The Brickman Group Basic Information List
Table 62. The Brickman Group Description and Business Overview
Table 63. The Brickman Group Landscaping Services Products, Services and Solutions
Table 64. Revenue (US$ Million) in Landscaping Services Business of The Brickman Group (2019-2024)
Table 65. The Brickman Group Recent Developments
Table 66. The Davey Tree Expert Company Basic Information List
Table 67. The Davey Tree Expert Company Description and Business Overview
Table 68. The Davey Tree Expert Company Landscaping Services Products, Services and Solutions
Table 69. Revenue (US$ Million) in Landscaping Services Business of The Davey Tree Expert Company (2019-2024)
Table 70. The Davey Tree Expert Company Recent Developments
Table 71. Scotts Basic Information List
Table 72. Scotts Description and Business Overview
Table 73. Scotts Landscaping Services Products, Services and Solutions
Table 74. Revenue (US$ Million) in Landscaping Services Business of Scotts (2019-2024)
Table 75. Scotts Recent Developments
Table 76. ValleyCrest Companies Basic Information List
Table 77. ValleyCrest Companies Description and Business Overview
Table 78. ValleyCrest Companies Landscaping Services Products, Services and Solutions
Table 79. Revenue (US$ Million) in Landscaping Services Business of ValleyCrest Companies (2019-2024)
Table 80. ValleyCrest Companies Recent Developments
Table 81. Brogan Landscaping Basic Information List
Table 82. Brogan Landscaping Description and Business Overview
Table 83. Brogan Landscaping Landscaping Services Products, Services and Solutions
Table 84. Revenue (US$ Million) in Landscaping Services Business of Brogan Landscaping (2019-2024)
Table 85. Brogan Landscaping Recent Developments
Table 86. Chapel Valley Landscape Basic Information List
Table 87. Chapel Valley Landscape Description and Business Overview
Table 88. Chapel Valley Landscape Landscaping Services Products, Services and Solutions
Table 89. Revenue (US$ Million) in Landscaping Services Business of Chapel Valley Landscape (2019-2024)
Table 90. Chapel Valley Landscape Recent Developments
Table 91. Gothic Landscape Basic Information List
Table 92. Gothic Landscape Description and Business Overview
Table 93. Gothic Landscape Landscaping Services Products, Services and Solutions
Table 94. Revenue (US$ Million) in Landscaping Services Business of Gothic Landscape (2019-2024)
Table 95. Gothic Landscape Recent Developments
Table 96. Stantec Basic Information List
Table 97. Stantec Description and Business Overview
Table 98. Stantec Landscaping Services Products, Services and Solutions
Table 99. Revenue (US$ Million) in Landscaping Services Business of Stantec (2019-2024)
Table 100. Stantec Recent Developments
Table 101. The Lawn Doctors Basic Information List
Table 102. The Lawn Doctors Description and Business Overview
Table 103. The Lawn Doctors Landscaping Services Products, Services and Solutions
Table 104. Revenue (US$ Million) in Landscaping Services Business of The Lawn Doctors (2019-2024)
Table 105. The Lawn Doctors Recent Developments
Table 106. The ServiceMaster Company Basic Information List
Table 107. The ServiceMaster Company Description and Business Overview
Table 108. The ServiceMaster Company Landscaping Services Products, Services and Solutions
Table 109. Revenue (US$ Million) in Landscaping Services Business of The ServiceMaster Company (2019-2024)
Table 110. The ServiceMaster Company Recent Developments
Table 111. USM Basic Information List
Table 112. USM Description and Business Overview
Table 113. USM Landscaping Services Products, Services and Solutions
Table 114. Revenue (US$ Million) in Landscaping Services Business of USM (2019-2024)
Table 115. USM Recent Developments
Table 116. Vila & Son Landscaping Corporation Basic Information List
Table 117. Vila & Son Landscaping Corporation Description and Business Overview
Table 118. Vila & Son Landscaping Corporation Landscaping Services Products, Services and Solutions
Table 119. Revenue (US$ Million) in Landscaping Services Business of Vila & Son Landscaping Corporation (2019-2024)
Table 120. Vila & Son Landscaping Corporation Recent Developments
Table 121. Weed Man Basic Information List
Table 122. Weed Man Description and Business Overview
Table 123. Weed Man Landscaping Services Products, Services and Solutions
Table 124. Revenue (US$ Million) in Landscaping Services Business of Weed Man (2019-2024)
Table 125. Weed Man Recent Developments
Table 126. Yellowstone Landscape Group Basic Information List
Table 127. Yellowstone Landscape Group Description and Business Overview
Table 128. Yellowstone Landscape Group Landscaping Services Products, Services and Solutions
Table 129. Revenue (US$ Million) in Landscaping Services Business of Yellowstone Landscape Group (2019-2024)
Table 130. Yellowstone Landscape Group Recent Developments
Table 131. Key Raw Materials Lists
Table 132. Raw Materials Key Suppliers Lists
Table 133. Landscaping Services Downstream Customers
Table 134. Landscaping Services Distributors List
Table 135. Research Programs/Design for This Report
Table 136. Key Data Information from Secondary Sources
Table 137. Key Data Information from Primary Sources
Table 138. Business Unit and Senior & Team Lead Analysts
List of Figures
Figure 1. Landscaping Services Product Picture
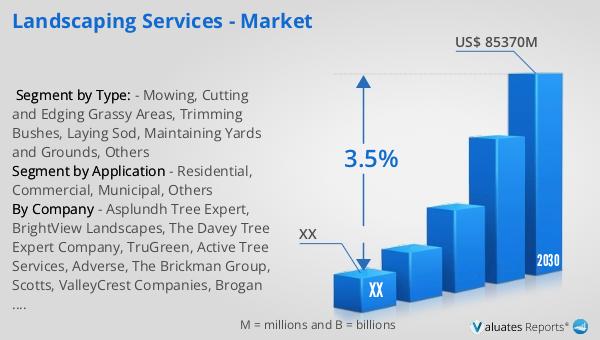
Figure 2. Global Landscaping Services Sales Value, 2019 VS 2023 VS 2030 (US$ Million)
Figure 3. Global Landscaping Services Sales Value (2019-2030) & (US$ Million)
Figure 4. Landscaping Services Report Years Considered
Figure 5. Global Landscaping Services Players Revenue Ranking (2023) & (US$ Million)
Figure 6. The 5 and 10 Largest Manufacturers in the World: Market Share by Landscaping Services Revenue in 2023
Figure 7. Landscaping Services Market Share by Company Type (Tier 1, Tier 2, and Tier 3): 2019 VS 2023
Figure 8. Mowing Picture
Figure 9. Cutting and Edging Grassy Areas Picture
Figure 10. Trimming Bushes Picture
Figure 11. Laying Sod Picture
Figure 12. Maintaining Yards and Grounds Picture
Figure 13. Others Picture
Figure 14. Global Landscaping Services Sales Value by Type (2019 VS 2023 VS 2030) & (US$ Million)
Figure 15. Global Landscaping Services Sales Value Market Share by Type, 2023 & 2030
Figure 16. Product Picture of Residential
Figure 17. Product Picture of Commercial
Figure 18. Product Picture of Municipal
Figure 19. Product Picture of Others
Figure 20. Global Landscaping Services Sales Value by Application (2019 VS 2023 VS 2030) & (US$ Million)
Figure 21. Global Landscaping Services Sales Value Market Share by Application, 2023 & 2030
Figure 22. North America Landscaping Services Sales Value (2019-2030) & (US$ Million)
Figure 23. North America Landscaping Services Sales Value by Country (%), 2023 VS 2030
Figure 24. Europe Landscaping Services Sales Value (2019-2030) & (US$ Million)
Figure 25. Europe Landscaping Services Sales Value by Country (%), 2023 VS 2030
Figure 26. Asia Pacific Landscaping Services Sales Value (2019-2030) & (US$ Million)
Figure 27. Asia Pacific Landscaping Services Sales Value by Country (%), 2023 VS 2030
Figure 28. South America Landscaping Services Sales Value (2019-2030) & (US$ Million)
Figure 29. South America Landscaping Services Sales Value by Country (%), 2023 VS 2030
Figure 30. Middle East & Africa Landscaping Services Sales Value (2019-2030) & (US$ Million)
Figure 31. Middle East & Africa Landscaping Services Sales Value by Country (%), 2023 VS 2030
Figure 32. Key Countries/Regions Landscaping Services Sales Value (%), (2019-2030)
Figure 33. United States Landscaping Services Sales Value, (2019-2030) & (US$ Million)
Figure 34. United States Landscaping Services Sales Value by Type (%), 2023 VS 2030
Figure 35. United States Landscaping Services Sales Value by Application (%), 2023 VS 2030
Figure 36. Europe Landscaping Services Sales Value, (2019-2030) & (US$ Million)
Figure 37. Europe Landscaping Services Sales Value by Type (%), 2023 VS 2030
Figure 38. Europe Landscaping Services Sales Value by Application (%), 2023 VS 2030
Figure 39. China Landscaping Services Sales Value, (2019-2030) & (US$ Million)
Figure 40. China Landscaping Services Sales Value by Type (%), 2023 VS 2030
Figure 41. China Landscaping Services Sales Value by Application (%), 2023 VS 2030
Figure 42. Japan Landscaping Services Sales Value, (2019-2030) & (US$ Million)
Figure 43. Japan Landscaping Services Sales Value by Type (%), 2023 VS 2030
Figure 44. Japan Landscaping Services Sales Value by Application (%), 2023 VS 2030
Figure 45. South Korea Landscaping Services Sales Value, (2019-2030) & (US$ Million)
Figure 46. South Korea Landscaping Services Sales Value by Type (%), 2023 VS 2030
Figure 47. South Korea Landscaping Services Sales Value by Application (%), 2023 VS 2030
Figure 48. Southeast Asia Landscaping Services Sales Value, (2019-2030) & (US$ Million)
Figure 49. Southeast Asia Landscaping Services Sales Value by Type (%), 2023 VS 2030
Figure 50. Southeast Asia Landscaping Services Sales Value by Application (%), 2023 VS 2030
Figure 51. India Landscaping Services Sales Value, (2019-2030) & (US$ Million)
Figure 52. India Landscaping Services Sales Value by Type (%), 2023 VS 2030
Figure 53. India Landscaping Services Sales Value by Application (%), 2023 VS 2030
Figure 54. Landscaping Services Industrial Chain
Figure 55. Landscaping Services Manufacturing Cost Structure
Figure 56. Channels of Distribution (Direct Sales, and Distribution)
Figure 57. Bottom-up and Top-down Approaches for This Report
Figure 58. Data Triangulation