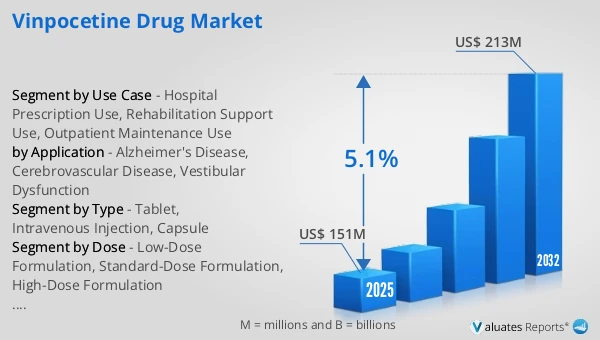
The global Vinpocetine Drug market was valued at US$ 151 million in 2025 and is anticipated to reach US$ 213 million by 2032, at a CAGR of 5.1% from 2026 to 2032.
Vinpocetine Drug Market
The 2025 U.S. tariff policies introduce profound uncertainty into the global economic landscape. This report critically examines the implications of recent tariff adjustments and international strategic countermeasures on Vinpocetine Drug competitive dynamics, regional economic interdependencies, and supply chain reconfigurations.
Vinpocetine drug refers to pharmaceutical preparations in which vinpocetine is the active ingredient, commonly available as oral tablets/capsules and, in some markets, injectable formulations used in hospital settings. The product is intended to address symptoms and functional impairment associated with reduced cerebral perfusion and microcirculatory dysfunction—such as dizziness, headache, tinnitus, and cognitive complaints—and is also used in certain regions as an adjunct in post-ischemic cerebrovascular recovery or vascular cognitive impairment pathways. Rather than replacing etiological treatment, vinpocetine products are positioned to support neurological function by improving microvascular circulation and helping tissues tolerate ischemic/hypoxic stress, thereby facilitating functional rehabilitation and quality-of-life improvements. Historically, vinpocetine was developed from a semi-synthetic derivative route related to vinca alkaloid chemistry and was first introduced as a prescription medicine in parts of Europe, later expanding internationally with established oral regimens and selected parenteral options; due to differences in regulatory frameworks, clinical practice, and reimbursement, its market positioning can vary from predominantly prescription use to limited extension into OTC or supplement channels in some jurisdictions. Upstream in the value chain, key inputs include natural-origin or synthetic starting materials (e.g., vinca-related intermediates or alternative chemical precursors), solvents and reagents/catalysts, pharmaceutical excipients, and primary packaging materials. Manufacturing spans API synthesis and purification, formulation steps such as blending/granulation and tableting for oral dosage forms or aseptic compounding, sterilizing filtration, filling, and (where applicable) lyophilization for injectables, supported by QC consumables such as analytical reagents and reference standards. “Component/consumable” suppliers mainly relate to sterile production—filtration modules, single-use tubing sets, filling-line consumables, cleanroom infrastructure, and in-process sensors/controls—collectively ensuring batch consistency, sterility assurance, and long-term stability.In 2025, the global production capacity of vinpocetine drugs is estimated at 45 million packs, with sales volume reaching 36.82 million packs. The average selling price is approximately USD 4.1 per unit, and corporate gross margins generally range between 30% and 40%.
The current vinpocetine drug market is characterized by divergent clinical adoption patterns and pronounced regional differences in use. In prescription-centric jurisdictions, demand is shaped by evidence expectations, guideline alignment, and pharmacovigilance, with hospital procurement and prescribing constrained by formulary governance, reimbursement rules, and clinical consensus. In other regions, where “brain health,” “cognitive support,” and microcirculatory improvement remain salient consumer and outpatient themes, vinpocetine-related products can retain visibility beyond hospitals; however, compliance boundaries around claims, labeling, and permissible indications are more sensitive, pushing companies toward more conservative market education and channel strategies. Competitive dynamics also differ: mature markets tend to reward stable, compliant supply under established prescribing norms, while many emerging markets are driven by local generics and multi-dosage coverage, competing through supply assurance, operational efficiency, and distribution reach. Across markets, quality consistency—especially impurity control, batch-to-batch reproducibility, and robust quality systems—has become a decisive factor for long-term contracts and institutional trust, requiring sustained investment in validation, QA governance, and safety monitoring.
Looking ahead, growth will increasingly depend on stronger evidence, sharper scenario focus, and compliance-led repositioning. On the clinical side, assessment of adjunct neurovascular therapies is moving toward stricter endpoints and greater reliance on real-world evidence; companies that articulate a clearer value proposition for defined patient segments and care pathways—such as functional recovery in rehabilitation settings, targeted symptom relief, or integration with baseline therapies—are more likely to sustain hospital utilization. In parallel, formulation and “use-experience” improvements may create structural opportunities, including better adherence design, enhanced quality uniformity, and presentations that fit hospital workflows and dispensing practices. For outpatient channels, tightening regulatory scrutiny is likely to standardize messaging, population definitions, and risk communication, shifting the market from broad, generalized cognition narratives toward compliant health-management communication. This will elevate the importance of professional education, claim review governance, and end-to-end traceability to reduce volatility from policy changes across jurisdictions.
Key tailwinds and headwinds coexist and frequently offset each other. Tailwinds include growing attention to cerebrovascular health and cognitive management in aging populations, pragmatic demand for symptom improvement and rehabilitation support—especially in primary care—and, in certain regions, a continued emphasis on accessibility to established legacy therapies. Supply-side maturity in API production and sterile manufacturing can also improve availability and operational efficiency. Headwinds concentrate on regulatory uncertainty driven by inconsistent product classification across countries, limitations in evidence strength and guideline endorsement levels, and heightened requirements for adverse event surveillance and drug-interaction risk management. In addition, procurement consolidation, reimbursement tightening, and stricter hospital prescribing controls can reduce pricing and channel flexibility, forcing competition to shift toward quality consistency, supply reliability, and compliant market access. Overall, winning strategies are increasingly defined by evidence and compliance capability, robust quality systems and supply assurance, and disciplined, scenario-specific commercialization rather than broad distribution or generalized claims.
This report delivers a comprehensive overview of the global Vinpocetine Drug market, with both quantitative and qualitative analyses, to help readers develop growth strategies, assess the competitive landscape, evaluate their position in the current market, and make informed business decisions regarding Vinpocetine Drug. The Vinpocetine Drug market size, estimates, and forecasts are provided in terms of sales volume (K Units) and revenue (US$ millions), with 2025 as the base year and historical and forecast data for 2021–2032.
The report segments the global Vinpocetine Drug market comprehensively. Regional market sizes by Type, by Application, by Dose, and by company are also provided. For deeper insight, the report profiles the competitive landscape, key competitors, and their respective market rankings, and discusses technological trends and new product developments.
This report will assist Vinpocetine Drug manufacturers, new entrants, and companies across the industry value chain with information on revenues, sales volume, and average prices for the overall market and its sub-segments, by company, by Type, by Application, and by region.
Market Segmentation
Scope of Vinpocetine Drug Market Report
| Report Metric |
Details |
| Report Name |
Vinpocetine Drug Market |
| Accounted market size in 2025 |
US$ 151 million |
| Forecasted market size in 2032 |
US$ 213 million |
| CAGR |
5.1% |
| Base Year |
2025 |
| Forecasted years |
2026 - 2032 |
| Segment by Type |
- Tablet
- Intravenous Injection
- Capsule
|
| Segment by Dose |
- Low-Dose Formulation
- Standard-Dose Formulation
- High-Dose Formulation
|
| Segment by Use Case |
- Hospital Prescription Use
- Rehabilitation Support Use
- Outpatient Maintenance Use
|
| by Application |
- Alzheimer's Disease
- Cerebrovascular Disease
- Vestibular Dysfunction
|
| Consumption by Region |
- North America (United States, Canada)
- Europe (Germany, France, UK, Italy, Russia)
- Asia-Pacific (China, Japan, South Korea, Taiwan)
- Southeast Asia (India)
- Latin America (Mexico, Brazil)
|
| By Company |
Gedeon Richter, Runhong, Northeast Pharma, Zhejiang Tailison, Zhitong Biopharma, Hunan WZT, Pude Pharmaceutical, Anhui Wellman, Suicheng Pharmaceutical, Harbin Medisan Pharmaceutical, Lei Yunshang Pharmaceutical, Biofarm SA, COVEX |
| Forecast units |
USD million in value |
| Report coverage |
Revenue and volume forecast, company share, competitive landscape, growth factors and trends |
Chapter Outline
- Chapter 1: Defines the scope of the report and presents an executive summary of market segments (by Type, by Application, by Dose, etc.), including the size of each segment and its future growth potential. It offers a high-level view of the current market and its likely evolution in the short, medium, and long term.
- Chapter 2: Provides a detailed analysis of the competitive landscape for Vinpocetine Drug manufacturers, covering pricing, sales and revenue shares, latest development plans, and mergers and acquisitions.
- Chapter 3: Examines Vinpocetine Drug sales and revenue at the regional and country levels. It quantifies market size and growth potential for each region and its key countries, and outlines market development, outlook, addressable space, and national market size.
- Chapter 4: Analyzes segments by Type, detailing the size and growth potential of each segment to help readers identify “blue ocean” opportunities.
- Chapter 5: Analyzes market segments by Application, covering the size and growth potential of each segment to help readers identify “blue ocean” opportunities in downstream markets.
- Chapter 6: Profiles key players, presenting core information on leading companies, including product sales, revenue, pricing, gross margin, product portfolio/introductions, and recent developments.
- Chapter 7: Reviews the industry value chain, including upstream and downstream segments.
- Chapter 8: Discusses market dynamics and recent developments, including drivers, restraints, challenges and risks for manufacturers, U.S. Tariffs and relevant policy analysis.
- Chapter 9: Summarizes the key findings and conclusions of the report.
Ans: The Vinpocetine Drug Market witnessing a CAGR of 5.1% during the forecast period 2026-2032.
Ans: The Vinpocetine Drug Market size in 2032 will be US$ 213 million.
Ans: The main players in the Vinpocetine Drug Market are Gedeon Richter, Runhong, Northeast Pharma, Zhejiang Tailison, Zhitong Biopharma, Hunan WZT, Pude Pharmaceutical, Anhui Wellman, Suicheng Pharmaceutical, Harbin Medisan Pharmaceutical, Lei Yunshang Pharmaceutical, Biofarm SA, COVEX
Ans: The Applications covered in the Vinpocetine Drug Market report are Alzheimer's Disease, Cerebrovascular Disease, Vestibular Dysfunction
Ans: The Types covered in the Vinpocetine Drug Market report are Tablet, Intravenous Injection, Capsule