
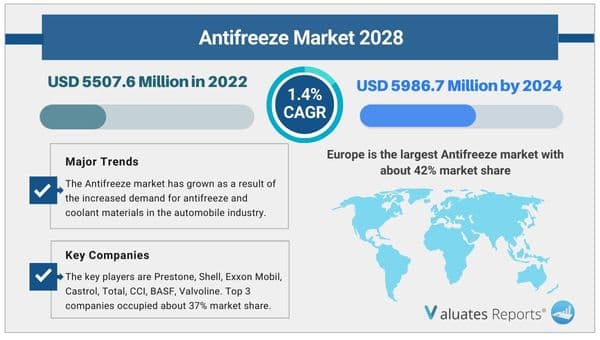
Considering the economic change due to COVID-19 and Russia-Ukraine War Influence, the global Antifreeze market is projected to reach USD 5986.7 Million by 2028 from an estimated USD 5507.6 Million in 2022, at a CAGR of 1.4% during 2023 and 2028.
Antifreeze is a type of coolant with antifreeze function. It is generally used for cars, trucks, bus, tractors, train locomotives and engineering machinery etc. Antifreeze has the function of anti-freezing, anti-boiling, anti-corrosion, anti-incrustation scale etc. For the relatively large market share of automotive antifreeze, this report mainly talks about auto antifreeze, the 30%~70% diluent antifreeze.
Europe is the largest Antifreeze market with about 42% market share. USA is follower, accounting for about 25% market share.
The key players are Prestone, Shell, Exxon Mobil, Castrol, Total, CCI, BASF, Valvoline, Old World Industries, KMCO, Chevron, SONAX, Getz Nordic, Kost USA, Recochem, Amsoil, MITAN, Gulf Oil International, Paras Lubricants, Solar Applied Materials, Pentosin, Millers Oils, Silverhook, Evans, ABRO, Sinopec, CNPC, Lanzhou BlueStar, Zhongkun Petrochemical, China-TEEC etc. Top 3 companies occupied about 37% market share.
This report aims to provide a comprehensive presentation of the global market for Antifreeze, with both quantitative and qualitative analysis, to help readers develop business/growth strategies, assess the market competitive situation, analyse their position in the current marketplace, and make informed business decisions regarding Antifreeze.
The Antifreeze market size, estimations, and forecasts are provided in terms of sales volume (MT) and revenue ($ millions), considering 2021 as the base year, with history and forecast data for the period from 2017 to 2028. This report segments the global Antifreeze market comprehensively. Regional market sizes, concerning products by types, by application, and by players, are also provided. The influence of COVID-19 and the Russia-Ukraine War were considered while estimating market sizes.
For a more in-depth understanding of the market, the report provides profiles of the competitive landscape, key competitors, and their respective market ranks. The report also discusses technological trends and new product developments.
The report will help the Antifreeze manufacturers, new entrants, and industry chain related companies in this market with information on the revenues, sales volume, and average price for the overall market and the sub-segments across the different segments, by company, product type, application, and regions.
In this section, the readers will gain an understanding of the key players competing. This report has studied the key growth strategies, such as innovative trends and developments, intensification of product portfolio, mergers and acquisitions, collaborations, new product innovation, and geographical expansion, undertaken by these participants to maintain their presence. Apart from business strategies, the study includes current developments and key financials. The readers will also get access to the data related to global revenue, price, and sales by manufacturers for the period 2017-2022. This all-inclusive report will certainly serve the clients to stay updated and make effective decisions in their businesses.
|
Report Metric |
Details |
|
Report Name |
Antifreeze Market |
|
Market size value in 2022 |
USD 5507.6 Million |
|
Revenue forecast in 2028 |
USD 5986.7 Million |
|
Growth Rate |
CAGR of 1.4% |
|
Base year considered |
2022 |
|
Forecast Period |
2023-2028 |
|
By Propulsion Type |
Ethylene Glycol, Propylene Glycol |
|
By Application |
Commercial Vehicles, Passenger Vehicles |
|
Report Coverage |
Revenue & volume forecast, company share, competitive landscape, growth factors, and trends |
|
Segments Covered |
By Type, Application, and Region |
|
Geographic Regions Covered |
North America, Europe, Asia Pacific, Latin America, Middle East & Africa |
Ans. Yes, we do provide the option to buy chapters in a report. We also can customize the report based on your specific requirements.
Ans. Considering the economic change due to COVID-19 and Russia-Ukraine War Influence, the global Antifreeze market is projected to reach US$ 5986.7 million by 2028 from an estimated US$ 5507.6 million in 2022, at a CAGR of 1.4% during 2023 and 2028.
Ans. Yes, the report includes a COVID-19 impact analysis. Also, it is further extended into every individual segment of the report.
1 Study Coverage
1.1 Antifreeze Product Introduction
1.2 Market by Type
1.2.1 Global Antifreeze Market Size Growth Rate by Type (2017 VS 2021 VS 2028)
1.2.2 Ethylene Glycol
1.2.3 Propylene Glycol
1.2.4 Others
1.3 Market by Application
1.3.1 Global Antifreeze Market Size Growth Rate by Application (2017 VS 2021 VS 2028)
1.3.2 Passenger Vehicles
1.3.3 Commercial Vehicles
1.4 Study Objectives
1.5 Years Considered
2 Executive Summary
2.1 Global Antifreeze Market Size Estimates and Forecasts
2.1.1 Global Antifreeze Revenue 2017-2028
2.1.2 Global Antifreeze Sales 2017-2028
2.2 Antifreeze Market Size by Region: 2022 Versus 2028
2.3 Antifreeze Sales by Region (2017-2028)
2.3.1 Global Antifreeze Sales by Region: 2017-2022
2.3.2 Global Antifreeze Sales Forecast by Region (2023-2028)
2.3.3 Global Antifreeze Sales Market Share by Region (2017-2028)
2.4 Antifreeze Market Estimates and Projections by Region (2023-2028)
2.4.1 Global Antifreeze Revenue by Region: 2017-2022
2.4.2 Global Antifreeze Revenue Forecast by Region (2023-2028)
2.4.3 Global Antifreeze Revenue Market Share by Region (2017-2028)
3 Global Antifreeze by Manufacturers
3.1 Global Top Antifreeze Manufacturers by Sales
3.1.1 Global Antifreeze Sales by Manufacturer (2017-2022)
3.1.2 Global Antifreeze Sales Market Share by Manufacturer (2017-2022)
3.2 Global Top Antifreeze Manufacturers by Revenue
3.2.1 Global Antifreeze Revenue by Manufacturer (2017-2022)
3.2.2 Global Antifreeze Revenue Share by Manufacturer (2017-2022)
3.3 Global Antifreeze Price by Manufacturer (2017-2022)
3.4 Competitive Landscape
3.4.1 Key Antifreeze Manufacturers Covered: Ranking by Revenue
3.4.2 Global Antifreeze Market Concentration Ratio (CR5 and HHI) & (2017-2022)
3.4.3 Global Antifreeze Market Share by Company Type (Tier 1, Tier 2 and Tier 3)
3.5 Global Antifreeze Manufacturing Base Distribution, Product Type
3.5.1 Antifreeze Manufacturers Manufacturing Base Distribution, Headquarters
3.5.2 Manufacturers Antifreeze Product Type
3.5.3 Date of International Manufacturers Enter into Antifreeze Market
3.6 Manufacturers Mergers & Acquisitions, Expansion Plans
4 Company Profiles
4.1 Prestone
4.1.1 Prestone Corporation Information
4.1.2 Prestone Description, Business Overview
4.1.3 Prestone Antifreeze Products Offered
4.1.4 Prestone Antifreeze Sales, Revenue and Gross Margin (2017-2022)
4.1.5 Prestone Antifreeze Sales by Product in 2021
4.1.6 Prestone Antifreeze Sales by Application in 2021
4.1.7 Prestone Antifreeze Sales by Geographic Area in 2021
4.1.8 Prestone Recent Developments
4.2 Shell
4.2.1 Shell Corporation Information
4.2.2 Shell Description, Business Overview
4.2.3 Shell Antifreeze Products Offered
4.2.4 Shell Antifreeze Sales, Revenue and Gross Margin (2017-2022)
4.2.5 Shell Antifreeze Sales by Product in 2021
4.2.6 Shell Antifreeze Sales by Application in 2021
4.2.7 Shell Antifreeze Sales by Geographic Area in 2021
4.2.8 Shell Recent Developments
4.3 Exxon Mobil
4.3.1 Exxon Mobil Corporation Information
4.3.2 Exxon Mobil Description, Business Overview
4.3.3 Exxon Mobil Antifreeze Products Offered
4.3.4 Exxon Mobil Antifreeze Sales, Revenue and Gross Margin (2017-2022)
4.3.5 Exxon Mobil Antifreeze Sales by Product in 2021
4.3.6 Exxon Mobil Antifreeze Sales by Application in 2021
4.3.7 Exxon Mobil Antifreeze Sales by Geographic Area in 2021
4.3.8 Exxon Mobil Recent Developments
4.4 Castrol
4.4.1 Castrol Corporation Information
4.4.2 Castrol Description, Business Overview
4.4.3 Castrol Antifreeze Products Offered
4.4.4 Castrol Antifreeze Sales, Revenue and Gross Margin (2017-2022)
4.4.5 Castrol Antifreeze Sales by Product in 2021
4.4.6 Castrol Antifreeze Sales by Application in 2021
4.4.7 Castrol Antifreeze Sales by Geographic Area in 2021
4.4.8 Castrol Recent Developments
4.5 Total
4.5.1 Total Corporation Information
4.5.2 Total Description, Business Overview
4.5.3 Total Antifreeze Products Offered
4.5.4 Total Antifreeze Sales, Revenue and Gross Margin (2017-2022)
4.5.5 Total Antifreeze Sales by Product in 2021
4.5.6 Total Antifreeze Sales by Application in 2021
4.5.7 Total Antifreeze Sales by Geographic Area in 2021
4.5.8 Total Recent Developments
4.6 CCI
4.6.1 CCI Corporation Information
4.6.2 CCI Description, Business Overview
4.6.3 CCI Antifreeze Products Offered
4.6.4 CCI Antifreeze Sales, Revenue and Gross Margin (2017-2022)
4.6.5 CCI Antifreeze Sales by Product in 2021
4.6.6 CCI Antifreeze Sales by Application in 2021
4.6.7 CCI Antifreeze Sales by Geographic Area in 2021
4.6.8 CCI Recent Development
4.7 BASF
4.7.1 BASF Corporation Information
4.7.2 BASF Description, Business Overview
4.7.3 BASF Antifreeze Products Offered
4.7.4 BASF Antifreeze Sales, Revenue and Gross Margin (2017-2022)
4.7.5 BASF Antifreeze Sales by Product in 2021
4.7.6 BASF Antifreeze Sales by Application in 2021
4.7.7 BASF Antifreeze Sales by Geographic Area in 2021
4.7.8 BASF Recent Development
4.8 Valvoline
4.8.1 Valvoline Corporation Information
4.8.2 Valvoline Description, Business Overview
4.8.3 Valvoline Antifreeze Products Offered
4.8.4 Valvoline Antifreeze Sales, Revenue and Gross Margin (2017-2022)
4.8.5 Valvoline Antifreeze Sales by Product in 2021
4.8.6 Valvoline Antifreeze Sales by Application in 2021
4.8.7 Valvoline Antifreeze Sales by Geographic Area in 2021
4.8.8 Valvoline Recent Development
4.9 Old World Industries
4.9.1 Old World Industries Corporation Information
4.9.2 Old World Industries Description, Business Overview
4.9.3 Old World Industries Antifreeze Products Offered
4.9.4 Old World Industries Antifreeze Sales, Revenue and Gross Margin (2017-2022)
4.9.5 Old World Industries Antifreeze Sales by Product in 2021
4.9.6 Old World Industries Antifreeze Sales by Application in 2021
4.9.7 Old World Industries Antifreeze Sales by Geographic Area in 2021
4.9.8 Old World Industries Recent Development
4.10 KMCO
4.10.1 KMCO Corporation Information
4.10.2 KMCO Description, Business Overview
4.10.3 KMCO Antifreeze Products Offered
4.10.4 KMCO Antifreeze Sales, Revenue and Gross Margin (2017-2022)
4.10.5 KMCO Antifreeze Sales by Product in 2021
4.10.6 KMCO Antifreeze Sales by Application in 2021
4.10.7 KMCO Antifreeze Sales by Geographic Area in 2021
4.10.8 KMCO Recent Development
4.11 Chevron
4.11.1 Chevron Corporation Information
4.11.2 Chevron Description, Business Overview
4.11.3 Chevron Antifreeze Products Offered
4.11.4 Chevron Antifreeze Sales, Revenue and Gross Margin (2017-2022)
4.11.5 Chevron Antifreeze Sales by Product in 2021
4.11.6 Chevron Antifreeze Sales by Application in 2021
4.11.7 Chevron Antifreeze Sales by Geographic Area in 2021
4.11.8 Chevron Recent Development
4.12 SONAX
4.12.1 SONAX Corporation Information
4.12.2 SONAX Description, Business Overview
4.12.3 SONAX Antifreeze Products Offered
4.12.4 SONAX Antifreeze Sales, Revenue and Gross Margin (2017-2022)
4.12.5 SONAX Antifreeze Sales by Product in 2021
4.12.6 SONAX Antifreeze Sales by Application in 2021
4.12.7 SONAX Antifreeze Sales by Geographic Area in 2021
4.12.8 SONAX Recent Development
4.13 Getz Nordic
4.13.1 Getz Nordic Corporation Information
4.13.2 Getz Nordic Description, Business Overview
4.13.3 Getz Nordic Antifreeze Products Offered
4.13.4 Getz Nordic Antifreeze Sales, Revenue and Gross Margin (2017-2022)
4.13.5 Getz Nordic Antifreeze Sales by Product in 2021
4.13.6 Getz Nordic Antifreeze Sales by Application in 2021
4.13.7 Getz Nordic Antifreeze Sales by Geographic Area in 2021
4.13.8 Getz Nordic Recent Development
4.14 Kost USA
4.14.1 Kost USA Corporation Information
4.14.2 Kost USA Description, Business Overview
4.14.3 Kost USA Antifreeze Products Offered
4.14.4 Kost USA Antifreeze Sales, Revenue and Gross Margin (2017-2022)
4.14.5 Kost USA Antifreeze Sales by Product in 2021
4.14.6 Kost USA Antifreeze Sales by Application in 2021
4.14.7 Kost USA Antifreeze Sales by Geographic Area in 2021
4.14.8 Kost USA Recent Development
4.15 Recochem
4.15.1 Recochem Corporation Information
4.15.2 Recochem Description, Business Overview
4.15.3 Recochem Antifreeze Products Offered
4.15.4 Recochem Antifreeze Sales, Revenue and Gross Margin (2017-2022)
4.15.5 Recochem Antifreeze Sales by Product in 2021
4.15.6 Recochem Antifreeze Sales by Application in 2021
4.15.7 Recochem Antifreeze Sales by Geographic Area in 2021
4.15.8 Recochem Recent Development
4.16 Amsoil
4.16.1 Amsoil Corporation Information
4.16.2 Amsoil Description, Business Overview
4.16.3 Amsoil Antifreeze Products Offered
4.16.4 Amsoil Antifreeze Sales, Revenue and Gross Margin (2017-2022)
4.16.5 Amsoil Antifreeze Sales by Product in 2021
4.16.6 Amsoil Antifreeze Sales by Application in 2021
4.16.7 Amsoil Antifreeze Sales by Geographic Area in 2021
4.16.8 Amsoil Recent Development
4.17 MITAN
4.17.1 MITAN Corporation Information
4.17.2 MITAN Description, Business Overview
4.17.3 MITAN Antifreeze Products Offered
4.17.4 MITAN Antifreeze Sales, Revenue and Gross Margin (2017-2022)
4.17.5 MITAN Antifreeze Sales by Product in 2021
4.17.6 MITAN Antifreeze Sales by Application in 2021
4.17.7 MITAN Antifreeze Sales by Geographic Area in 2021
4.17.8 MITAN Recent Development
4.18 Gulf Oil International
4.18.1 Gulf Oil International Corporation Information
4.18.2 Gulf Oil International Description, Business Overview
4.18.3 Gulf Oil International Antifreeze Products Offered
4.18.4 Gulf Oil International Antifreeze Sales, Revenue and Gross Margin (2017-2022)
4.18.5 Gulf Oil International Antifreeze Sales by Product in 2021
4.18.6 Gulf Oil International Antifreeze Sales by Application in 2021
4.18.7 Gulf Oil International Antifreeze Sales by Geographic Area in 2021
4.18.8 Gulf Oil International Recent Development
4.19 Paras Lubricants
4.19.1 Paras Lubricants Corporation Information
4.19.2 Paras Lubricants Description, Business Overview
4.19.3 Paras Lubricants Antifreeze Products Offered
4.19.4 Paras Lubricants Antifreeze Sales, Revenue and Gross Margin (2017-2022)
4.19.5 Paras Lubricants Antifreeze Sales by Product in 2021
4.19.6 Paras Lubricants Antifreeze Sales by Application in 2021
4.19.7 Paras Lubricants Antifreeze Sales by Geographic Area in 2021
4.19.8 Paras Lubricants Recent Development
4.20 Solar Applied Materials
4.20.1 Solar Applied Materials Corporation Information
4.20.2 Solar Applied Materials Description, Business Overview
4.20.3 Solar Applied Materials Antifreeze Products Offered
4.20.4 Solar Applied Materials Antifreeze Sales, Revenue and Gross Margin (2017-2022)
4.20.5 Solar Applied Materials Antifreeze Sales by Product in 2021
4.20.6 Solar Applied Materials Antifreeze Sales by Application in 2021
4.20.7 Solar Applied Materials Antifreeze Sales by Geographic Area in 2021
4.20.8 Solar Applied Materials Recent Development
4.21 Pentosin
4.21.1 Pentosin Corporation Information
4.21.2 Pentosin Description, Business Overview
4.21.3 Pentosin Antifreeze Products Offered
4.21.4 Pentosin Antifreeze Sales, Revenue and Gross Margin (2017-2022)
4.21.5 Pentosin Antifreeze Sales by Product in 2021
4.21.6 Pentosin Antifreeze Sales by Application in 2021
4.21.7 Pentosin Antifreeze Sales by Geographic Area in 2021
4.21.8 Pentosin Recent Development
4.22 Millers Oils
4.22.1 Millers Oils Corporation Information
4.22.2 Millers Oils Description, Business Overview
4.22.3 Millers Oils Antifreeze Products Offered
4.22.4 Millers Oils Antifreeze Sales, Revenue and Gross Margin (2017-2022)
4.22.5 Millers Oils Antifreeze Sales by Product in 2021
4.22.6 Millers Oils Antifreeze Sales by Application in 2021
4.22.7 Millers Oils Antifreeze Sales by Geographic Area in 2021
4.22.8 Millers Oils Recent Development
4.23 Silverhook
4.23.1 Silverhook Corporation Information
4.23.2 Silverhook Description, Business Overview
4.23.3 Silverhook Antifreeze Products Offered
4.23.4 Silverhook Antifreeze Sales, Revenue and Gross Margin (2017-2022)
4.23.5 Silverhook Antifreeze Sales by Product in 2021
4.23.6 Silverhook Antifreeze Sales by Application in 2021
4.23.7 Silverhook Antifreeze Sales by Geographic Area in 2021
4.23.8 Silverhook Recent Development
4.24 Evans
4.24.1 Evans Corporation Information
4.24.2 Evans Description, Business Overview
4.24.3 Evans Antifreeze Products Offered
4.24.4 Evans Antifreeze Sales, Revenue and Gross Margin (2017-2022)
4.24.5 Evans Antifreeze Sales by Product in 2021
4.24.6 Evans Antifreeze Sales by Application in 2021
4.24.7 Evans Antifreeze Sales by Geographic Area in 2021
4.24.8 Evans Recent Development
4.25 ABRO
4.25.1 ABRO Corporation Information
4.25.2 ABRO Description, Business Overview
4.25.3 ABRO Antifreeze Products Offered
4.25.4 ABRO Antifreeze Sales, Revenue and Gross Margin (2017-2022)
4.25.5 ABRO Antifreeze Sales by Product in 2021
4.25.6 ABRO Antifreeze Sales by Application in 2021
4.25.7 ABRO Antifreeze Sales by Geographic Area in 2021
4.25.8 ABRO Recent Development
4.26 Sinopec
4.26.1 Sinopec Corporation Information
4.26.2 Sinopec Description, Business Overview
4.26.3 Sinopec Antifreeze Products Offered
4.26.4 Sinopec Antifreeze Sales, Revenue and Gross Margin (2017-2022)
4.26.5 Sinopec Antifreeze Sales by Product in 2021
4.26.6 Sinopec Antifreeze Sales by Application in 2021
4.26.7 Sinopec Antifreeze Sales by Geographic Area in 2021
4.26.8 Sinopec Recent Development
4.27 CNPC
4.27.1 CNPC Corporation Information
4.27.2 CNPC Description, Business Overview
4.27.3 CNPC Antifreeze Products Offered
4.27.4 CNPC Antifreeze Sales, Revenue and Gross Margin (2017-2022)
4.27.5 CNPC Antifreeze Sales by Product in 2021
4.27.6 CNPC Antifreeze Sales by Application in 2021
4.27.7 CNPC Antifreeze Sales by Geographic Area in 2021
4.27.8 CNPC Recent Development
4.28 Lanzhou BlueStar
4.28.1 Lanzhou BlueStar Corporation Information
4.28.2 Lanzhou BlueStar Description, Business Overview
4.28.3 Lanzhou BlueStar Antifreeze Products Offered
4.28.4 Lanzhou BlueStar Antifreeze Sales, Revenue and Gross Margin (2017-2022)
4.28.5 Lanzhou BlueStar Antifreeze Sales by Product in 2021
4.28.6 Lanzhou BlueStar Antifreeze Sales by Application in 2021
4.28.7 Lanzhou BlueStar Antifreeze Sales by Geographic Area in 2021
4.28.8 Lanzhou BlueStar Recent Development
4.29 Zhongkun Petrochemical
4.29.1 Zhongkun Petrochemical Corporation Information
4.29.2 Zhongkun Petrochemical Description, Business Overview
4.29.3 Zhongkun Petrochemical Antifreeze Products Offered
4.29.4 Zhongkun Petrochemical Antifreeze Sales, Revenue and Gross Margin (2017-2022)
4.29.5 Zhongkun Petrochemical Antifreeze Sales by Product in 2021
4.29.6 Zhongkun Petrochemical Antifreeze Sales by Application in 2021
4.29.7 Zhongkun Petrochemical Antifreeze Sales by Geographic Area in 2021
4.29.8 Zhongkun Petrochemical Recent Development
4.30 China-TEEC
4.30.1 China-TEEC Corporation Information
4.30.2 China-TEEC Description, Business Overview
4.30.3 China-TEEC Antifreeze Products Offered
4.30.4 China-TEEC Antifreeze Sales, Revenue and Gross Margin (2017-2022)
4.30.5 China-TEEC Antifreeze Sales by Product in 2021
4.30.6 China-TEEC Antifreeze Sales by Application in 2021
4.30.7 China-TEEC Antifreeze Sales by Geographic Area in 2021
4.30.8 China-TEEC Recent Development
5 Breakdown Data by Type
5.1 Global Antifreeze Sales by Type (2017-2028)
5.1.1 Global Antifreeze Sales by Type (2017-2022)
5.1.2 Global Antifreeze Sales Forecast by Type (2023-2028)
5.1.3 Global Antifreeze Sales Market Share by Type (2017-2028)
5.2 Global Antifreeze Revenue Forecast by Type (2017-2028)
5.2.1 Global Antifreeze Revenue by Type (2017-2022)
5.2.2 Global Antifreeze Revenue Forecast by Type (2023-2028)
5.2.3 Global Antifreeze Revenue Market Share by Type (2017-2028)
5.3 Antifreeze Average Selling Price (ASP) by Type (2017-2028)
6 Breakdown Data by Application
6.1 Global Antifreeze Sales by Application (2017-2028)
6.1.1 Global Antifreeze Sales by Application (2017-2022)
6.1.2 Global Antifreeze Sales Forecast by Application (2023-2028)
6.1.3 Global Antifreeze Sales Market Share by Application (2017-2028)
6.2 Global Antifreeze Revenue Forecast by Application (2017-2028)
6.2.1 Global Antifreeze Revenue by Application (2017-2022)
6.2.2 Global Antifreeze Revenue Forecast by Application (2023-2028)
6.2.3 Global Antifreeze Revenue Market Share by Application (2017-2028)
6.3 Antifreeze Average Selling Price (ASP) by Application (2017-2028)
7 North America
7.1 North America Antifreeze Market Size YoY Growth 2017-2028
7.2 North America Antifreeze Market Facts & Figures by Country
7.2.1 North America Antifreeze Sales by Country (2017-2028)
7.2.2 North America Antifreeze Revenue by Country (2017-2028)
7.3 North America Antifreeze Sales by Type
7.4 North America Antifreeze Sales by Application
8 Asia-Pacific
8.1 Asia-Pacific Antifreeze Market Size YoY Growth 2017-2028
8.2 Asia-Pacific Antifreeze Market Facts & Figures by Region
8.2.1 Asia-Pacific Antifreeze Sales by Region (2017-2028)
8.2.2 Asia-Pacific Antifreeze Revenue by Region (2017-2028)
8.3 Asia-Pacific Antifreeze Sales by Type
8.4 Asia-Pacific Antifreeze Sales by Application
9 Europe
9.1 Europe Antifreeze Market Size YoY Growth 2017-2028
9.2 Europe Antifreeze Market Facts & Figures by Country
9.2.1 Europe Antifreeze Sales by Country (2017-2028)
9.2.2 Europe Antifreeze Revenue by Country (2017-2028)
9.3 Europe Antifreeze Sales by Type
9.4 Europe Antifreeze Sales by Application
10 Latin America
10.1 Latin America Antifreeze Market Size YoY Growth 2017-2028
10.2 Latin America Antifreeze Market Facts & Figures by Country
10.2.1 Latin America Antifreeze Sales by Country (2017-2028)
10.2.2 Latin America Antifreeze Revenue by Country (2017-2028)
10.3 Latin America Antifreeze Sales by Type
10.4 Latin America Antifreeze Sales by Application
11 Middle East and Africa
11.1 Middle East and Africa Antifreeze Market Size YoY Growth 2017-2028
11.2 Middle East and Africa Antifreeze Market Facts & Figures by Country
11.2.1 Middle East and Africa Antifreeze Sales by Country (2017-2028)
11.2.2 Middle East and Africa Antifreeze Revenue by Country (2017-2028)
11.3 Middle East and Africa Antifreeze Sales by Type
11.4 Middle East and Africa Antifreeze Sales by Application
12 Supply Chain and Sales Channel Analysis
12.1 Antifreeze Supply Chain Analysis
12.2 Antifreeze Key Raw Materials and Upstream Suppliers
12.3 Antifreeze Clients Analysis
12.4 Antifreeze Sales Channel and Sales Model Analysis
12.4.1 Antifreeze Distribution Channel Analysis: Indirect Sales VS Direct Sales
12.4.2 Antifreeze Distribution Channel Analysis: Online Sales VS Offline Sales
12.4.3 Antifreeze Distributors
13 Market Dynamics
13.1 Antifreeze Industry Trends
13.2 Antifreeze Market Drivers
13.3 Antifreeze Market Challenges
13.4 Antifreeze Market Restraints
13.5 Porter’s Five Forces Analysis
14 Research Findings and Conclusion
15 Appendix
15.1 Research Methodology
15.1.1 Methodology/Research Approach
15.1.2 Data Source
15.2 Author Details
15.3 Disclaimer
List of Tables
Table 1. Global Antifreeze Market Size Growth Rate by Type (US$ Million): 2017 VS 2021 VS 2028
Table 2. Major Manufacturers of Ethylene Glycol
Table 3. Major Manufacturers of Propylene Glycol
Table 4. Major Manufacturers of Others
Table 5. Global Antifreeze Market Size Growth by Application (US$ Million): 2017 VS 2021 VS 2028
Table 6. Global Antifreeze Market Size by Region (US$ Million): 2021 VS 2022 VS 2028
Table 7. Global Antifreeze Sales by Region (2017-2022) & (MT)
Table 8. Global Antifreeze Sales Forecast by Region (2023-2028) & (MT)
Table 9. Global Antifreeze Revenue by Region (2017-2022) & (US$ Million)
Table 10. Global Antifreeze Revenue Forecast by Region (2023-2028) & (US$ Million)
Table 11. Global Antifreeze Sales by Manufacturer (2017-2022) & (MT)
Table 12. Global Antifreeze Sales Share by Manufacturer (2017-2022)
Table 13. Antifreeze Revenue by Manufacturer (2017-2022) & (US$ Million)
Table 14. Antifreeze Revenue Share by Manufacturer (2017-2022)
Table 15. Key Manufacturers Antifreeze Price (2017-2022) & (USD/MT)
Table 16. Ranking of Global Top Antifreeze Manufacturers by Revenue (US$ Million) in 2021
Table 17. Global Antifreeze Manufacturers Market Concentration Ratio (CR5 and HHI) & (2017-2022)
Table 18. Global Antifreeze by Company Type (Tier 1, Tier 2 and Tier 3) & (based on the Revenue in Antifreeze as of 2021)
Table 19. Antifreeze Manufacturers Manufacturing Base Distribution and Headquarters
Table 20. Manufacturers Antifreeze Product Type
Table 21. Date of International Manufacturers Enter into Antifreeze Market
Table 22. Manufacturers Mergers & Acquisitions, Expansion Plans
Table 23. Prestone Corporation Information
Table 24. Prestone Description and Business Overview
Table 25. Prestone Antifreeze Sales (MT), Revenue (US$ Million), Price (USD/MT) and Gross Margin (2017-2022)
Table 26. Prestone Antifreeze Product
Table 27. Prestone Antifreeze Sales Proportion of Antifreeze by Product in 2021
Table 28. Prestone Antifreeze Sales Proportion of Antifreeze by Application in 2021
Table 29. Prestone Antifreeze Sales Proportion of Antifreeze by Geographic Area in 2021
Table 30. Prestone Recent Development
Table 31. Shell Corporation Information
Table 32. Shell Description and Business Overview
Table 33. Shell Antifreeze Sales (MT), Revenue (US$ Million), Price (USD/MT) and Gross Margin (2017-2022)
Table 34. Shell Antifreeze Product
Table 35. Shell Antifreeze Sales Proportion of Antifreeze by Product in 2021
Table 36. Shell Antifreeze Sales Proportion of Antifreeze by Application in 2021
Table 37. Shell Antifreeze Sales Proportion of Antifreeze by Geographic Area in 2021
Table 38. Shell Recent Development
Table 39. Exxon Mobil Corporation Information
Table 40. Exxon Mobil Description and Business Overview
Table 41. Exxon Mobil Antifreeze Sales (MT), Revenue (US$ Million), Price (USD/MT) and Gross Margin (2017-2022)
Table 42. Exxon Mobil Antifreeze Product
Table 43. Exxon Mobil Antifreeze Sales Proportion of Antifreeze by Product in 2021
Table 44. Exxon Mobil Antifreeze Sales Proportion of Antifreeze by Application in 2021
Table 45. Exxon Mobil Antifreeze Sales Proportion of Antifreeze by Geographic Area in 2021
Table 46. Exxon Mobil Recent Development
Table 47. Castrol Corporation Information
Table 48. Castrol Description and Business Overview
Table 49. Castrol Antifreeze Sales (MT), Revenue (US$ Million), Price (USD/MT) and Gross Margin (2017-2022)
Table 50. Castrol Antifreeze Product
Table 51. Castrol Antifreeze Sales Proportion of Antifreeze by Product in 2021
Table 52. Castrol Antifreeze Sales Proportion of Antifreeze by Application in 2021
Table 53. Castrol Antifreeze Sales Proportion of Antifreeze by Geographic Area in 2021
Table 54. Castrol Recent Development
Table 55. Total Corporation Information
Table 56. Total Description and Business Overview
Table 57. Total Antifreeze Sales (MT), Revenue (US$ Million), Price (USD/MT) and Gross Margin (2017-2022)
Table 58. Total Antifreeze Product
Table 59. Total Antifreeze Sales Proportion of Antifreeze by Product in 2021
Table 60. Total Antifreeze Sales Proportion of Antifreeze by Application in 2021
Table 61. Total Antifreeze Sales Proportion of Antifreeze by Geographic Area in 2021
Table 62. Total Recent Development
Table 63. CCI Corporation Information
Table 64. CCI Description and Business Overview
Table 65. CCI Antifreeze Sales (MT), Revenue (US$ Million), Price (USD/MT) and Gross Margin (2017-2022)
Table 66. CCI Antifreeze Product
Table 67. CCI Antifreeze Sales Proportion of Antifreeze by Product in 2021
Table 68. CCI Antifreeze Sales Proportion of Antifreeze by Application in 2021
Table 69. CCI Antifreeze Sales Proportion of Antifreeze by Geographic Area in 2021
Table 70. BASF Corporation Information
Table 71. BASF Description and Business Overview
Table 72. BASF Antifreeze Sales (MT), Revenue (US$ Million), Price (USD/MT) and Gross Margin (2017-2022)
Table 73. BASF Antifreeze Product
Table 74. BASF Antifreeze Sales Proportion of Antifreeze by Product in 2021
Table 75. BASF Antifreeze Sales Proportion of Antifreeze by Application in 2021
Table 76. BASF Antifreeze Sales Proportion of Antifreeze by Geographic Area in 2021
Table 77. Valvoline Corporation Information
Table 78. Valvoline Description and Business Overview
Table 79. Valvoline Antifreeze Sales (MT), Revenue (US$ Million), Price (USD/MT) and Gross Margin (2017-2022)
Table 80. Valvoline Antifreeze Product
Table 81. Valvoline Antifreeze Sales Proportion of Antifreeze by Product in 2021
Table 82. Valvoline Antifreeze Sales Proportion of Antifreeze by Application in 2021
Table 83. Valvoline Antifreeze Sales Proportion of Antifreeze by Geographic Area in 2021
Table 84. Old World Industries Corporation Information
Table 85. Old World Industries Description and Business Overview
Table 86. Old World Industries Antifreeze Sales (MT), Revenue (US$ Million), Price (USD/MT) and Gross Margin (2017-2022)
Table 87. Old World Industries Antifreeze Product
Table 88. Old World Industries Antifreeze Sales Proportion of Antifreeze by Product in 2021
Table 89. Old World Industries Antifreeze Sales Proportion of Antifreeze by Application in 2021
Table 90. Old World Industries Antifreeze Sales Proportion of Antifreeze by Geographic Area in 2021
Table 91. KMCO Corporation Information
Table 92. KMCO Description and Business Overview
Table 93. KMCO Antifreeze Sales (MT), Revenue (US$ Million), Price (USD/MT) and Gross Margin (2017-2022)
Table 94. KMCO Antifreeze Product
Table 95. KMCO Antifreeze Sales Proportion of Antifreeze by Product in 2021
Table 96. KMCO Antifreeze Sales Proportion of Antifreeze by Application in 2021
Table 97. KMCO Antifreeze Sales Proportion of Antifreeze by Geographic Area in 2021
Table 98. Chevron Corporation Information
Table 99. Chevron Description and Business Overview
Table 100. Chevron Antifreeze Sales (MT), Revenue (US$ Million), Price (USD/MT) and Gross Margin (2017-2022)
Table 101. Chevron Antifreeze Product
Table 102. Chevron Antifreeze Sales Proportion of Antifreeze by Product in 2021
Table 103. Chevron Antifreeze Sales Proportion of Antifreeze by Application in 2021
Table 104. Chevron Antifreeze Sales Proportion of Antifreeze by Geographic Area in 2021
Table 105. SONAX Corporation Information
Table 106. SONAX Description and Business Overview
Table 107. SONAX Antifreeze Sales (MT), Revenue (US$ Million), Price (USD/MT) and Gross Margin (2017-2022)
Table 108. SONAX Antifreeze Product
Table 109. SONAX Antifreeze Sales Proportion of Antifreeze by Product in 2021
Table 110. SONAX Antifreeze Sales Proportion of Antifreeze by Application in 2021
Table 111. SONAX Antifreeze Sales Proportion of Antifreeze by Geographic Area in 2021
Table 112. Getz Nordic Corporation Information
Table 113. Getz Nordic Description and Business Overview
Table 114. Getz Nordic Antifreeze Sales (MT), Revenue (US$ Million), Price (USD/MT) and Gross Margin (2017-2022)
Table 115. Getz Nordic Antifreeze Product
Table 116. Getz Nordic Antifreeze Sales Proportion of Antifreeze by Product in 2021
Table 117. Getz Nordic Antifreeze Sales Proportion of Antifreeze by Application in 2021
Table 118. Getz Nordic Antifreeze Sales Proportion of Antifreeze by Geographic Area in 2021
Table 119. Kost USA Corporation Information
Table 120. Kost USA Description and Business Overview
Table 121. Kost USA Antifreeze Sales (MT), Revenue (US$ Million), Price (USD/MT) and Gross Margin (2017-2022)
Table 122. Kost USA Antifreeze Product
Table 123. Kost USA Antifreeze Sales Proportion of Antifreeze by Product in 2021
Table 124. Kost USA Antifreeze Sales Proportion of Antifreeze by Application in 2021
Table 125. Kost USA Antifreeze Sales Proportion of Antifreeze by Geographic Area in 2021
Table 126. Recochem Corporation Information
Table 127. Recochem Description and Business Overview
Table 128. Recochem Antifreeze Sales (MT), Revenue (US$ Million), Price (USD/MT) and Gross Margin (2017-2022)
Table 129. Recochem Antifreeze Product
Table 130. Recochem Antifreeze Sales Proportion of Antifreeze by Product in 2021
Table 131. Recochem Antifreeze Sales Proportion of Antifreeze by Application in 2021
Table 132. Recochem Antifreeze Sales Proportion of Antifreeze by Geographic Area in 2021
Table 133. Amsoil Corporation Information
Table 134. Amsoil Description and Business Overview
Table 135. Amsoil Antifreeze Sales (MT), Revenue (US$ Million), Price (USD/MT) and Gross Margin (2017-2022)
Table 136. Amsoil Antifreeze Product
Table 137. Amsoil Antifreeze Sales Proportion of Antifreeze by Product in 2021
Table 138. Amsoil Antifreeze Sales Proportion of Antifreeze by Application in 2021
Table 139. Amsoil Antifreeze Sales Proportion of Antifreeze by Geographic Area in 2021
Table 140. MITAN Corporation Information
Table 141. MITAN Description and Business Overview
Table 142. MITAN Antifreeze Sales (MT), Revenue (US$ Million), Price (USD/MT) and Gross Margin (2017-2022)
Table 143. MITAN Antifreeze Product
Table 144. MITAN Antifreeze Sales Proportion of Antifreeze by Product in 2021
Table 145. MITAN Antifreeze Sales Proportion of Antifreeze by Application in 2021
Table 146. MITAN Antifreeze Sales Proportion of Antifreeze by Geographic Area in 2021
Table 147. Gulf Oil International Corporation Information
Table 148. Gulf Oil International Description and Business Overview
Table 149. Gulf Oil International Antifreeze Sales (MT), Revenue (US$ Million), Price (USD/MT) and Gross Margin (2017-2022)
Table 150. Gulf Oil International Antifreeze Product
Table 151. Gulf Oil International Antifreeze Sales Proportion of Antifreeze by Product in 2021
Table 152. Gulf Oil International Antifreeze Sales Proportion of Antifreeze by Application in 2021
Table 153. Gulf Oil International Antifreeze Sales Proportion of Antifreeze by Geographic Area in 2021
Table 154. Paras Lubricants Corporation Information
Table 155. Paras Lubricants Description and Business Overview
Table 156. Paras Lubricants Antifreeze Sales (MT), Revenue (US$ Million), Price (USD/MT) and Gross Margin (2017-2022)
Table 157. Paras Lubricants Antifreeze Product
Table 158. Paras Lubricants Antifreeze Sales Proportion of Antifreeze by Product in 2021
Table 159. Paras Lubricants Antifreeze Sales Proportion of Antifreeze by Application in 2021
Table 160. Paras Lubricants Antifreeze Sales Proportion of Antifreeze by Geographic Area in 2021
Table 161. Solar Applied Materials Corporation Information
Table 162. Solar Applied Materials Description and Business Overview
Table 163. Solar Applied Materials Antifreeze Sales (MT), Revenue (US$ Million), Price (USD/MT) and Gross Margin (2017-2022)
Table 164. Solar Applied Materials Antifreeze Product
Table 165. Solar Applied Materials Antifreeze Sales Proportion of Antifreeze by Product in 2021
Table 166. Solar Applied Materials Antifreeze Sales Proportion of Antifreeze by Application in 2021
Table 167. Solar Applied Materials Antifreeze Sales Proportion of Antifreeze by Geographic Area in 2021
Table 168. Pentosin Corporation Information
Table 169. Pentosin Description and Business Overview
Table 170. Pentosin Antifreeze Sales (MT), Revenue (US$ Million), Price (USD/MT) and Gross Margin (2017-2022)
Table 171. Pentosin Antifreeze Product
Table 172. Pentosin Antifreeze Sales Proportion of Antifreeze by Product in 2021
Table 173. Pentosin Antifreeze Sales Proportion of Antifreeze by Application in 2021
Table 174. Pentosin Antifreeze Sales Proportion of Antifreeze by Geographic Area in 2021
Table 175. Millers Oils Corporation Information
Table 176. Millers Oils Description and Business Overview
Table 177. Millers Oils Antifreeze Sales (MT), Revenue (US$ Million), Price (USD/MT) and Gross Margin (2017-2022)
Table 178. Millers Oils Antifreeze Product
Table 179. Millers Oils Antifreeze Sales Proportion of Antifreeze by Product in 2021
Table 180. Millers Oils Antifreeze Sales Proportion of Antifreeze by Application in 2021
Table 181. Millers Oils Antifreeze Sales Proportion of Antifreeze by Geographic Area in 2021
Table 182. Silverhook Corporation Information
Table 183. Silverhook Description and Business Overview
Table 184. Silverhook Antifreeze Sales (MT), Revenue (US$ Million), Price (USD/MT) and Gross Margin (2017-2022)
Table 185. Silverhook Antifreeze Product
Table 186. Silverhook Antifreeze Sales Proportion of Antifreeze by Product in 2021
Table 187. Silverhook Antifreeze Sales Proportion of Antifreeze by Application in 2021
Table 188. Silverhook Antifreeze Sales Proportion of Antifreeze by Geographic Area in 2021
Table 189. Evans Corporation Information
Table 190. Evans Description and Business Overview
Table 191. Evans Antifreeze Sales (MT), Revenue (US$ Million), Price (USD/MT) and Gross Margin (2017-2022)
Table 192. Evans Antifreeze Product
Table 193. Evans Antifreeze Sales Proportion of Antifreeze by Product in 2021
Table 194. Evans Antifreeze Sales Proportion of Antifreeze by Application in 2021
Table 195. Evans Antifreeze Sales Proportion of Antifreeze by Geographic Area in 2021
Table 196. ABRO Corporation Information
Table 197. ABRO Description and Business Overview
Table 198. ABRO Antifreeze Sales (MT), Revenue (US$ Million), Price (USD/MT) and Gross Margin (2017-2022)
Table 199. ABRO Antifreeze Product
Table 200. ABRO Antifreeze Sales Proportion of Antifreeze by Product in 2021
Table 201. ABRO Antifreeze Sales Proportion of Antifreeze by Application in 2021
Table 202. ABRO Antifreeze Sales Proportion of Antifreeze by Geographic Area in 2021
Table 203. Sinopec Corporation Information
Table 204. Sinopec Description and Business Overview
Table 205. Sinopec Antifreeze Sales (MT), Revenue (US$ Million), Price (USD/MT) and Gross Margin (2017-2022)
Table 206. Sinopec Antifreeze Product
Table 207. Sinopec Antifreeze Sales Proportion of Antifreeze by Product in 2021
Table 208. Sinopec Antifreeze Sales Proportion of Antifreeze by Application in 2021
Table 209. Sinopec Antifreeze Sales Proportion of Antifreeze by Geographic Area in 2021
Table 210. CNPC Corporation Information
Table 211. CNPC Description and Business Overview
Table 212. CNPC Antifreeze Sales (MT), Revenue (US$ Million), Price (USD/MT) and Gross Margin (2017-2022)
Table 213. CNPC Antifreeze Product
Table 214. CNPC Antifreeze Sales Proportion of Antifreeze by Product in 2021
Table 215. CNPC Antifreeze Sales Proportion of Antifreeze by Application in 2021
Table 216. CNPC Antifreeze Sales Proportion of Antifreeze by Geographic Area in 2021
Table 217. Lanzhou BlueStar Corporation Information
Table 218. Lanzhou BlueStar Description and Business Overview
Table 219. Lanzhou BlueStar Antifreeze Sales (MT), Revenue (US$ Million), Price (USD/MT) and Gross Margin (2017-2022)
Table 220. Lanzhou BlueStar Antifreeze Product
Table 221. Lanzhou BlueStar Antifreeze Sales Proportion of Antifreeze by Product in 2021
Table 222. Lanzhou BlueStar Antifreeze Sales Proportion of Antifreeze by Application in 2021
Table 223. Lanzhou BlueStar Antifreeze Sales Proportion of Antifreeze by Geographic Area in 2021
Table 224. Zhongkun Petrochemical Corporation Information
Table 225. Zhongkun Petrochemical Description and Business Overview
Table 226. Zhongkun Petrochemical Antifreeze Sales (MT), Revenue (US$ Million), Price (USD/MT) and Gross Margin (2017-2022)
Table 227. Zhongkun Petrochemical Antifreeze Product
Table 228. Zhongkun Petrochemical Antifreeze Sales Proportion of Antifreeze by Product in 2021
Table 229. Zhongkun Petrochemical Antifreeze Sales Proportion of Antifreeze by Application in 2021
Table 230. Zhongkun Petrochemical Antifreeze Sales Proportion of Antifreeze by Geographic Area in 2021
Table 231. China-TEEC Corporation Information
Table 232. China-TEEC Description and Business Overview
Table 233. China-TEEC Antifreeze Sales (MT), Revenue (US$ Million), Price (USD/MT) and Gross Margin (2017-2022)
Table 234. China-TEEC Antifreeze Product
Table 235. China-TEEC Antifreeze Sales Proportion of Antifreeze by Product in 2021
Table 236. China-TEEC Antifreeze Sales Proportion of Antifreeze by Application in 2021
Table 237. China-TEEC Antifreeze Sales Proportion of Antifreeze by Geographic Area in 2021
Table 238. Global Antifreeze Sales by Type (2017-2022) & (MT)
Table 239. Global Antifreeze Sales Forecast by Type (2023-2028) & (MT)
Table 240. Global Antifreeze Revenue by Type (2017-2022) & (US$ Million)
Table 241. Global Antifreeze Revenue Forecast by Type (2023-2028) & (US$ Million)
Table 242. Global Antifreeze Sales by Application (2017-2022) & (MT)
Table 243. Global Antifreeze Sales Forecast by Application (2023-2028) & (MT)
Table 244. Global Antifreeze Revenue by Application (2017-2022) & (US$ Million)
Table 245. Global Antifreeze Revenue Forecast by Application (2023-2028) & (US$ Million)
Table 246. North America Antifreeze Sales by Country (2017-2022) & (MT)
Table 247. North America Antifreeze Sales by Country (2023-2028) & (MT)
Table 248. North America Antifreeze Revenue by Country (2017-2022) & (US$ Million)
Table 249. North America Antifreeze Revenue by Country (2023-2028) & (US$ Million)
Table 250. North America Antifreeze Sales by Type (2017-2022) & (MT)
Table 251. North America Antifreeze Sales by Application (2017-2022) & (MT)
Table 252. Asia-Pacific Antifreeze Sales by Region (2017-2022) & (MT)
Table 253. Asia-Pacific Antifreeze Sales by Region (2023-2028) & (MT)
Table 254. Asia-Pacific Antifreeze Revenue by Region (2017-2028) & (US$ Million)
Table 255. Asia-Pacific Antifreeze Revenue by Region (2023-2028) & (US$ Million)
Table 256. Asia-Pacific Antifreeze Sales by Type (2017-2022) & (MT)
Table 257. Asia-Pacific Antifreeze Sales by Application (2017-2022) & (MT)
Table 258. Europe Antifreeze Sales by Country (2017-2022) & (MT)
Table 259. Europe Antifreeze Sales by Country (2023-2028) & (MT)
Table 260. Europe Antifreeze Revenue by Country (2017-2022) & (US$ Million)
Table 261. Europe Antifreeze Revenue by Country (2023-2028) & (US$ Million)
Table 262. Europe Antifreeze Sales by Type (2017-2022) & (MT)
Table 263. Europe Antifreeze Sales by Application (2017-2022) & (MT)
Table 264. Latin America Antifreeze Sales by Country (2017-2022) & (MT)
Table 265. Latin America Antifreeze Sales by Country (2023-2028) & (MT)
Table 266. Latin America Antifreeze Revenue by Country (2017-2022) & (US$ Million)
Table 267. Latin America Antifreeze Revenue by Country (2023-2028) & (US$ Million)
Table 268. Latin America Antifreeze Sales by Type (2017-2022) & (MT)
Table 269. Latin America Antifreeze Sales by Application (2017-2022) & (MT)
Table 270. Middle East and Africa Antifreeze Sales by Country (2017-2022) & (MT)
Table 271. Middle East and Africa Antifreeze Sales by Country (2023-2028) & (MT)
Table 272. Middle East and Africa Antifreeze Revenue by Country (2017-2022) & (US$ Million)
Table 273. Middle East and Africa Antifreeze Revenue by Country (2023-2028) & (US$ Million)
Table 274. Middle East and Africa Antifreeze Sales by Type (2017-2022) & (MT)
Table 275. Middle East and Africa Antifreeze Sales by Application (2017-2022) & (MT)
Table 276. Antifreeze Key Raw Materials, Industry Status and Trend
Table 277. Antifreeze Key Raw Materials and Upstream Suppliers
Table 278. Antifreeze Clients Status and Trend
Table 279. Antifreeze Typical Clients
Table 280. Antifreeze Distributors
Table 281. Antifreeze Market Trends
Table 282. Antifreeze Market Drivers
Table 283. Antifreeze Market Challenges
Table 284. Antifreeze Market Restraints
Table 285. Research Programs/Design for This Report
Table 286. Key Data Information from Secondary Sources
Table 287. Key Data Information from Primary Sources
List of Figures
Figure 1. Antifreeze Product Picture
Figure 2. Global Antifreeze Sales Market Share by Type in 2021 & 2028
Figure 3. Ethylene Glycol Product Picture
Figure 4. Propylene Glycol Product Picture
Figure 5. Others Product Picture
Figure 6. Global Antifreeze Sales Market Share by Application in 2021 & 2028
Figure 7. Passenger Vehicles Examples
Figure 8. Commercial Vehicles Examples
Figure 9. Antifreeze Report Years Considered
Figure 10. Global Antifreeze Market Size, (US$ Million), 2017 VS 2021 VS 2028
Figure 11. Global Antifreeze Market Size 2017-2028 (US$ Million)
Figure 12. Global Antifreeze Sales 2017-2028 (MT)
Figure 13. Global Antifreeze Market Size Market Share by Region: 2022 Versus 2028
Figure 14. Global Antifreeze Sales Market Share Forecast by Region (2017-2028)
Figure 15. Global Antifreeze Revenue Market Share by Region (2017-2028)
Figure 16. Global Antifreeze Sales Share by Manufacturer in 2021
Figure 17. Antifreeze Market Share by Company Type (Tier 1, Tier 2 and Tier 3): 2017 VS 2021
Figure 18. Global Antifreeze Sales Market Share Forecast by Type (2017-2028)
Figure 19. Global Antifreeze Revenue Market Share Forecast by Type (2017-2028)
Figure 20. Antifreeze Average Selling Price (ASP) by Type (2017-2022) & (USD/MT)
Figure 21. Global Antifreeze Sales Market Share Forecast by Application (2017-2028)
Figure 22. Global Antifreeze Revenue Market Share Forecast by Application (2017-2028)
Figure 23. Antifreeze Average Selling Price (ASP) by Application (2017-2022) & (USD/MT)
Figure 24. North America Antifreeze Revenue 2017-2028 (US$ Million)
Figure 25. North America Antifreeze Sales Market Share by Type (2017-2022)
Figure 26. North America Antifreeze Sales Market Share by Application (2017-2022)
Figure 27. Asia-Pacific Antifreeze Revenue 2017-2028 (US$ Million)
Figure 28. Asia-Pacific Antifreeze Sales Market Share by Region (2017-2028)
Figure 29. Asia-Pacific Antifreeze Revenue Market Share by Region (2017-2028)
Figure 30. Asia-Pacific Antifreeze Sales Market Share by Type (2017-2022)
Figure 31. Asia-Pacific Antifreeze Sales Market Share by Application (2017-2022)
Figure 32. Europe Antifreeze Revenue Growth Rate 2017-2028 (US$ Million)
Figure 33. Europe Antifreeze Sales Market Share by Country (2017-2028)
Figure 34. Europe Antifreeze Revenue Market Share by Country (2017-2028)
Figure 35. Europe Antifreeze Sales Market Share by Type (2017-2022)
Figure 36. Europe Antifreeze Sales Market Share by Application (2017-2022)
Figure 37. Latin America Antifreeze Revenue Growth Rate 2017-2028 (US$ Million)
Figure 38. Latin America Antifreeze Sales Market Share by Country (2017-2028)
Figure 39. Latin America Antifreeze Revenue Market Share by Country (2017-2022)
Figure 40. Latin America Antifreeze Sales Market Share by Type (2017-2022)
Figure 41. Latin America Antifreeze Sales Market Share by Application (2017-2022)
Figure 42. Middle East and Africa Antifreeze Revenue Growth Rate 2017-2028 (US$ Million)
Figure 43. Middle East and Africa Antifreeze Sales Market Share by Country (2017-2028)
Figure 44. Middle East and Africa Antifreeze Revenue Market Share by Country (2017-2028)
Figure 45. Middle East and Africa Antifreeze Sales Market Share by Type (2017-2022)
Figure 46. Middle East and Africa Antifreeze Sales Market Share by Application (2017-2022)
Figure 47. Antifreeze Supply Chain (Upstream and Downstream Market)
Figure 48. Global Production Market Share of Antifreeze Raw Materials by Region in 2021
Figure 49. Antifreeze Distribution Channels
Figure 50. Global Antifreeze Percentage 2017-2028: Indirect Sales VS Direct Sales
Figure 51. Global Antifreeze Percentage 2017-2028: Online Sales VS Offline Sales
Figure 52. Bottom-up and Top-down Approaches for This Report
Figure 53. Data Triangulation
$5900
$11800
HAVE A QUERY?
OUR CUSTOMER
