List of Tables
Table 1. Global Live Fish Transportation Service Market Size Growth Rate by Transport Mode (US$ Million): 2020 VS 2024 VS 2031
Table 2. Key Players of Road Transport
Table 3. Key Players of Sea Transport
Table 4. Key Players of Air Transport
Table 5. Global Live Fish Transportation Service Market Size Growth Rate by Water System Type (US$ Million): 2020 VS 2024 VS 2031
Table 6. Key Players of Freshwater Transport
Table 7. Key Players of Marine Water Transport
Table 8. Key Players of Brackish Water Transport
Table 9. Global Live Fish Transportation Service Market Size Growth Rate by Fish Type (US$ Million): 2020 VS 2024 VS 2031
Table 10. Key Players of Aquaculture Fish Transport
Table 11. Key Players of Ornamental Fish Transport
Table 12. Key Players of Wild Fish Transport
Table 13. Global Live Fish Transportation Service Market Size Growth Rate by Service Scope (US$ Million): 2020 VS 2024 VS 2031
Table 14. Key Players of Domestic Transportation
Table 15. Key Players of International Transportation
Table 16. Global Live Fish Transportation Service Market Size Growth by Application (US$ Million): 2020 VS 2024 VS 2031
Table 17. Global Live Fish Transportation Service Market Size by Region (US$ Million): 2020 VS 2024 VS 2031
Table 18. Global Live Fish Transportation Service Market Size by Region (2020-2025) & (US$ Million)
Table 19. Global Live Fish Transportation Service Market Share by Region (2020-2025)
Table 20. Global Live Fish Transportation Service Forecasted Market Size by Region (2026-2031) & (US$ Million)
Table 21. Global Live Fish Transportation Service Market Share by Region (2026-2031)
Table 22. Live Fish Transportation Service Market Trends
Table 23. Live Fish Transportation Service Market Drivers
Table 24. Live Fish Transportation Service Market Challenges
Table 25. Live Fish Transportation Service Market Restraints
Table 26. Global Live Fish Transportation Service Revenue by Players (2020-2025) & (US$ Million)
Table 27. Global Live Fish Transportation Service Market Share by Players (2020-2025)
Table 28. Global Top Live Fish Transportation Service Players by Company Type (Tier 1, Tier 2, and Tier 3) & (based on the Revenue in Live Fish Transportation Service as of 2024)
Table 29. Ranking of Global Top Live Fish Transportation Service Companies by Revenue (US$ Million) in 2024
Table 30. Global 5 Largest Players Market Share by Live Fish Transportation Service Revenue (CR5 and HHI) & (2020-2025)
Table 31. Global Key Players of Live Fish Transportation Service, Headquarters and Area Served
Table 32. Global Key Players of Live Fish Transportation Service, Product and Application
Table 33. Global Key Players of Live Fish Transportation Service, Date of Enter into This Industry
Table 34. Mergers & Acquisitions, Expansion Plans
Table 35. Global Live Fish Transportation Service Market Size by Transport Mode (2020-2025) & (US$ Million)
Table 36. Global Live Fish Transportation Service Revenue Market Share by Transport Mode (2020-2025)
Table 37. Global Live Fish Transportation Service Forecasted Market Size by Transport Mode (2026-2031) & (US$ Million)
Table 38. Global Live Fish Transportation Service Revenue Market Share by Transport Mode (2026-2031)
Table 39. Global Live Fish Transportation Service Market Size by Application (2020-2025) & (US$ Million)
Table 40. Global Live Fish Transportation Service Revenue Market Share by Application (2020-2025)
Table 41. Global Live Fish Transportation Service Forecasted Market Size by Application (2026-2031) & (US$ Million)
Table 42. Global Live Fish Transportation Service Revenue Market Share by Application (2026-2031)
Table 43. North America Live Fish Transportation Service Market Size Growth Rate by Country (US$ Million): 2020 VS 2024 VS 2031
Table 44. North America Live Fish Transportation Service Market Size by Country (2020-2025) & (US$ Million)
Table 45. North America Live Fish Transportation Service Market Size by Country (2026-2031) & (US$ Million)
Table 46. Europe Live Fish Transportation Service Market Size Growth Rate by Country (US$ Million): 2020 VS 2024 VS 2031
Table 47. Europe Live Fish Transportation Service Market Size by Country (2020-2025) & (US$ Million)
Table 48. Europe Live Fish Transportation Service Market Size by Country (2026-2031) & (US$ Million)
Table 49. Asia-Pacific Live Fish Transportation Service Market Size Growth Rate by Region (US$ Million): 2020 VS 2024 VS 2031
Table 50. Asia-Pacific Live Fish Transportation Service Market Size by Region (2020-2025) & (US$ Million)
Table 51. Asia-Pacific Live Fish Transportation Service Market Size by Region (2026-2031) & (US$ Million)
Table 52. Latin America Live Fish Transportation Service Market Size Growth Rate by Country (US$ Million): 2020 VS 2024 VS 2031
Table 53. Latin America Live Fish Transportation Service Market Size by Country (2020-2025) & (US$ Million)
Table 54. Latin America Live Fish Transportation Service Market Size by Country (2026-2031) & (US$ Million)
Table 55. Middle East & Africa Live Fish Transportation Service Market Size Growth Rate by Country (US$ Million): 2020 VS 2024 VS 2031
Table 56. Middle East & Africa Live Fish Transportation Service Market Size by Country (2020-2025) & (US$ Million)
Table 57. Middle East & Africa Live Fish Transportation Service Market Size by Country (2026-2031) & (US$ Million)
Table 58. IYOSUI Company Details
Table 59. IYOSUI Business Overview
Table 60. IYOSUI Live Fish Transportation Service Product
Table 61. IYOSUI Revenue in Live Fish Transportation Service Business (2020-2025) & (US$ Million)
Table 62. IYOSUI Recent Development
Table 63. Solway Transport Company Details
Table 64. Solway Transport Business Overview
Table 65. Solway Transport Live Fish Transportation Service Product
Table 66. Solway Transport Revenue in Live Fish Transportation Service Business (2020-2025) & (US$ Million)
Table 67. Solway Transport Recent Development
Table 68. ESO Logistics Company Details
Table 69. ESO Logistics Business Overview
Table 70. ESO Logistics Live Fish Transportation Service Product
Table 71. ESO Logistics Revenue in Live Fish Transportation Service Business (2020-2025) & (US$ Million)
Table 72. ESO Logistics Recent Development
Table 73. Complete Aquatics Company Details
Table 74. Complete Aquatics Business Overview
Table 75. Complete Aquatics Live Fish Transportation Service Product
Table 76. Complete Aquatics Revenue in Live Fish Transportation Service Business (2020-2025) & (US$ Million)
Table 77. Complete Aquatics Recent Development
Table 78. Aquamaintenance & Services Company Details
Table 79. Aquamaintenance & Services Business Overview
Table 80. Aquamaintenance & Services Live Fish Transportation Service Product
Table 81. Aquamaintenance & Services Revenue in Live Fish Transportation Service Business (2020-2025) & (US$ Million)
Table 82. Aquamaintenance & Services Recent Development
Table 83. ABBCO Company Details
Table 84. ABBCO Business Overview
Table 85. ABBCO Live Fish Transportation Service Product
Table 86. ABBCO Revenue in Live Fish Transportation Service Business (2020-2025) & (US$ Million)
Table 87. ABBCO Recent Development
Table 88. APEM Company Details
Table 89. APEM Business Overview
Table 90. APEM Live Fish Transportation Service Product
Table 91. APEM Revenue in Live Fish Transportation Service Business (2020-2025) & (US$ Million)
Table 92. APEM Recent Development
Table 93. Move my fish Company Details
Table 94. Move my fish Business Overview
Table 95. Move my fish Live Fish Transportation Service Product
Table 96. Move my fish Revenue in Live Fish Transportation Service Business (2020-2025) & (US$ Million)
Table 97. Move my fish Recent Development
Table 98. Davies Turner Company Details
Table 99. Davies Turner Business Overview
Table 100. Davies Turner Live Fish Transportation Service Product
Table 101. Davies Turner Revenue in Live Fish Transportation Service Business (2020-2025) & (US$ Million)
Table 102. Davies Turner Recent Development
Table 103. O'Malley Transport Company Details
Table 104. O'Malley Transport Business Overview
Table 105. O'Malley Transport Live Fish Transportation Service Product
Table 106. O'Malley Transport Revenue in Live Fish Transportation Service Business (2020-2025) & (US$ Million)
Table 107. O'Malley Transport Recent Development
Table 108. Lufthansa Cargo Company Details
Table 109. Lufthansa Cargo Business Overview
Table 110. Lufthansa Cargo Live Fish Transportation Service Product
Table 111. Lufthansa Cargo Revenue in Live Fish Transportation Service Business (2020-2025) & (US$ Million)
Table 112. Lufthansa Cargo Recent Development
Table 113. Migdale Transport Company Details
Table 114. Migdale Transport Business Overview
Table 115. Migdale Transport Live Fish Transportation Service Product
Table 116. Migdale Transport Revenue in Live Fish Transportation Service Business (2020-2025) & (US$ Million)
Table 117. Migdale Transport Recent Development
Table 118. Aquatic Management Services Company Details
Table 119. Aquatic Management Services Business Overview
Table 120. Aquatic Management Services Live Fish Transportation Service Product
Table 121. Aquatic Management Services Revenue in Live Fish Transportation Service Business (2020-2025) & (US$ Million)
Table 122. Aquatic Management Services Recent Development
Table 123. AquaScape Company Details
Table 124. AquaScape Business Overview
Table 125. AquaScape Live Fish Transportation Service Product
Table 126. AquaScape Revenue in Live Fish Transportation Service Business (2020-2025) & (US$ Million)
Table 127. AquaScape Recent Development
Table 128. UShip Company Details
Table 129. UShip Business Overview
Table 130. UShip Live Fish Transportation Service Product
Table 131. UShip Revenue in Live Fish Transportation Service Business (2020-2025) & (US$ Million)
Table 132. UShip Recent Development
Table 133. Transportes Fishcare Company Details
Table 134. Transportes Fishcare Business Overview
Table 135. Transportes Fishcare Live Fish Transportation Service Product
Table 136. Transportes Fishcare Revenue in Live Fish Transportation Service Business (2020-2025) & (US$ Million)
Table 137. Transportes Fishcare Recent Development
Table 138. Sølvtrans Company Details
Table 139. Sølvtrans Business Overview
Table 140. Sølvtrans Live Fish Transportation Service Product
Table 141. Sølvtrans Revenue in Live Fish Transportation Service Business (2020-2025) & (US$ Million)
Table 142. Sølvtrans Recent Development
Table 143. HAV Group Company Details
Table 144. HAV Group Business Overview
Table 145. HAV Group Live Fish Transportation Service Product
Table 146. HAV Group Revenue in Live Fish Transportation Service Business (2020-2025) & (US$ Million)
Table 147. HAV Group Recent Development
Table 148. RJJ Freight Company Details
Table 149. RJJ Freight Business Overview
Table 150. RJJ Freight Live Fish Transportation Service Product
Table 151. RJJ Freight Revenue in Live Fish Transportation Service Business (2020-2025) & (US$ Million)
Table 152. RJJ Freight Recent Development
Table 153. IOT-Tech Company Details
Table 154. IOT-Tech Business Overview
Table 155. IOT-Tech Live Fish Transportation Service Product
Table 156. IOT-Tech Revenue in Live Fish Transportation Service Business (2020-2025) & (US$ Million)
Table 157. IOT-Tech Recent Development
Table 158. AQUI-S Company Details
Table 159. AQUI-S Business Overview
Table 160. AQUI-S Live Fish Transportation Service Product
Table 161. AQUI-S Revenue in Live Fish Transportation Service Business (2020-2025) & (US$ Million)
Table 162. AQUI-S Recent Development
Table 163. Run It Cool Company Details
Table 164. Run It Cool Business Overview
Table 165. Run It Cool Live Fish Transportation Service Product
Table 166. Run It Cool Revenue in Live Fish Transportation Service Business (2020-2025) & (US$ Million)
Table 167. Run It Cool Recent Development
Table 168. Research Programs/Design for This Report
Table 169. Key Data Information from Secondary Sources
Table 170. Key Data Information from Primary Sources
Table 171. Authors List of This Report
List of Figures
Figure 1. Live Fish Transportation Service Picture
Figure 2. Global Live Fish Transportation Service Market Size Comparison by Transport Mode (2020-2031) & (US$ Million)
Figure 3. Global Live Fish Transportation Service Market Share by Transport Mode: 2024 VS 2031
Figure 4. Road Transport Features
Figure 5. Sea Transport Features
Figure 6. Air Transport Features
Figure 7. Global Live Fish Transportation Service Market Size Comparison by Water System Type (2020-2031) & (US$ Million)
Figure 8. Freshwater Transport Features
Figure 9. Marine Water Transport Features
Figure 10. Brackish Water Transport Features
Figure 11. Global Live Fish Transportation Service Market Size Comparison by Fish Type (2020-2031) & (US$ Million)
Figure 12. Aquaculture Fish Transport Features
Figure 13. Ornamental Fish Transport Features
Figure 14. Wild Fish Transport Features
Figure 15. Global Live Fish Transportation Service Market Size Comparison by Service Scope (2020-2031) & (US$ Million)
Figure 16. Domestic Transportation Features
Figure 17. International Transportation Features
Figure 18. Global Live Fish Transportation Service Market Size by Application (2020-2031) & (US$ Million)
Figure 19. Global Live Fish Transportation Service Market Share by Application: 2024 VS 2031
Figure 20. Fish Farms Case Studies
Figure 21. Aquariums Case Studies
Figure 22. Live Fish Transportation Service Report Years Considered
Figure 23. Global Live Fish Transportation Service Market Size (US$ Million), Year-over-Year: 2020-2031
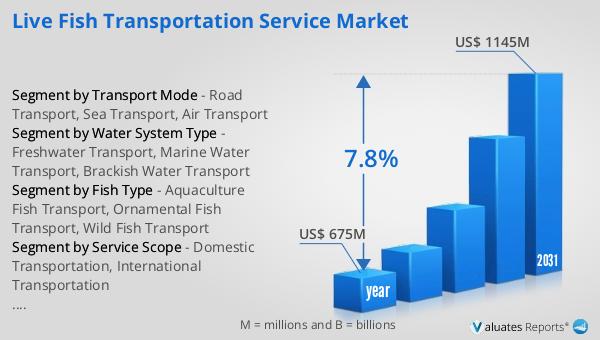
Figure 24. Global Live Fish Transportation Service Market Size, (US$ Million), 2020 VS 2024 VS 2031
Figure 25. Global Live Fish Transportation Service Market Share by Region: 2024 VS 2031
Figure 26. Global Live Fish Transportation Service Market Share by Players in 2024
Figure 27. Global Live Fish Transportation Service Market Share by Company Type (Tier 1, Tier 2, and Tier 3)
Figure 28. The Top 10 and 5 Players Market Share by Live Fish Transportation Service Revenue in 2024
Figure 29. North America Live Fish Transportation Service Market Size YoY Growth (2020-2031) & (US$ Million)
Figure 30. North America Live Fish Transportation Service Market Share by Country (2020-2031)
Figure 31. United States Live Fish Transportation Service Market Size YoY Growth (2020-2031) & (US$ Million)
Figure 32. Canada Live Fish Transportation Service Market Size YoY Growth (2020-2031) & (US$ Million)
Figure 33. Europe Live Fish Transportation Service Market Size YoY Growth (2020-2031) & (US$ Million)
Figure 34. Europe Live Fish Transportation Service Market Share by Country (2020-2031)
Figure 35. Germany Live Fish Transportation Service Market Size YoY Growth (2020-2031) & (US$ Million)
Figure 36. France Live Fish Transportation Service Market Size YoY Growth (2020-2031) & (US$ Million)
Figure 37. U.K. Live Fish Transportation Service Market Size YoY Growth (2020-2031) & (US$ Million)
Figure 38. Italy Live Fish Transportation Service Market Size YoY Growth (2020-2031) & (US$ Million)
Figure 39. Russia Live Fish Transportation Service Market Size YoY Growth (2020-2031) & (US$ Million)
Figure 40. Ireland Live Fish Transportation Service Market Size YoY Growth (2020-2031) & (US$ Million)
Figure 41. Asia-Pacific Live Fish Transportation Service Market Size YoY Growth (2020-2031) & (US$ Million)
Figure 42. Asia-Pacific Live Fish Transportation Service Market Share by Region (2020-2031)
Figure 43. China Live Fish Transportation Service Market Size YoY Growth (2020-2031) & (US$ Million)
Figure 44. Japan Live Fish Transportation Service Market Size YoY Growth (2020-2031) & (US$ Million)
Figure 45. South Korea Live Fish Transportation Service Market Size YoY Growth (2020-2031) & (US$ Million)
Figure 46. Southeast Asia Live Fish Transportation Service Market Size YoY Growth (2020-2031) & (US$ Million)
Figure 47. India Live Fish Transportation Service Market Size YoY Growth (2020-2031) & (US$ Million)
Figure 48. Australia & New Zealand Live Fish Transportation Service Market Size YoY Growth (2020-2031) & (US$ Million)
Figure 49. Latin America Live Fish Transportation Service Market Size YoY Growth (2020-2031) & (US$ Million)
Figure 50. Latin America Live Fish Transportation Service Market Share by Country (2020-2031)
Figure 51. Mexico Live Fish Transportation Service Market Size YoY Growth (2020-2031) & (US$ Million)
Figure 52. Brazil Live Fish Transportation Service Market Size YoY Growth (2020-2031) & (US$ Million)
Figure 53. Middle East & Africa Live Fish Transportation Service Market Size YoY Growth (2020-2031) & (US$ Million)
Figure 54. Middle East & Africa Live Fish Transportation Service Market Share by Country (2020-2031)
Figure 55. Israel Live Fish Transportation Service Market Size YoY Growth (2020-2031) & (US$ Million)
Figure 56. Saudi Arabia Live Fish Transportation Service Market Size YoY Growth (2020-2031) & (US$ Million)
Figure 57. UAE Live Fish Transportation Service Market Size YoY Growth (2020-2031) & (US$ Million)
Figure 58. IYOSUI Revenue Growth Rate in Live Fish Transportation Service Business (2020-2025)
Figure 59. Solway Transport Revenue Growth Rate in Live Fish Transportation Service Business (2020-2025)
Figure 60. ESO Logistics Revenue Growth Rate in Live Fish Transportation Service Business (2020-2025)
Figure 61. Complete Aquatics Revenue Growth Rate in Live Fish Transportation Service Business (2020-2025)
Figure 62. Aquamaintenance & Services Revenue Growth Rate in Live Fish Transportation Service Business (2020-2025)
Figure 63. ABBCO Revenue Growth Rate in Live Fish Transportation Service Business (2020-2025)
Figure 64. APEM Revenue Growth Rate in Live Fish Transportation Service Business (2020-2025)
Figure 65. Move my fish Revenue Growth Rate in Live Fish Transportation Service Business (2020-2025)
Figure 66. Davies Turner Revenue Growth Rate in Live Fish Transportation Service Business (2020-2025)
Figure 67. O'Malley Transport Revenue Growth Rate in Live Fish Transportation Service Business (2020-2025)
Figure 68. Lufthansa Cargo Revenue Growth Rate in Live Fish Transportation Service Business (2020-2025)
Figure 69. Migdale Transport Revenue Growth Rate in Live Fish Transportation Service Business (2020-2025)
Figure 70. Aquatic Management Services Revenue Growth Rate in Live Fish Transportation Service Business (2020-2025)
Figure 71. AquaScape Revenue Growth Rate in Live Fish Transportation Service Business (2020-2025)
Figure 72. UShip Revenue Growth Rate in Live Fish Transportation Service Business (2020-2025)
Figure 73. Transportes Fishcare Revenue Growth Rate in Live Fish Transportation Service Business (2020-2025)
Figure 74. Sølvtrans Revenue Growth Rate in Live Fish Transportation Service Business (2020-2025)
Figure 75. HAV Group Revenue Growth Rate in Live Fish Transportation Service Business (2020-2025)
Figure 76. RJJ Freight Revenue Growth Rate in Live Fish Transportation Service Business (2020-2025)
Figure 77. IOT-Tech Revenue Growth Rate in Live Fish Transportation Service Business (2020-2025)
Figure 78. AQUI-S Revenue Growth Rate in Live Fish Transportation Service Business (2020-2025)
Figure 79. Run It Cool Revenue Growth Rate in Live Fish Transportation Service Business (2020-2025)
Figure 80. Bottom-up and Top-down Approaches for This Report
Figure 81. Data Triangulation
Figure 82. Key Executives Interviewed