
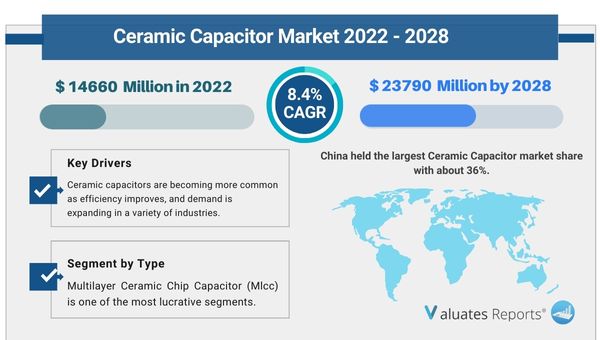
Due to the COVID-19 pandemic, the global Ceramic Capacitor market size is estimated to be worth US$ 14660 million in 2022 and is forecast to a readjusted size of US$ 23790 million by 2028 with a CAGR of 8.4% during the review period. Key drivers of the ceramic capacitor market include the rapid expansion of the automobile industry.
The surge in consumer electronic items in everyday use will boost the growth of the ceramic capacitor market during the forecast period. The rapid advancements in capacitor components and growing deployment in telecommunication, power, and energy sectors will drive the growth of the market in the coming years.
Automobile sector
The level of electrical and electronic circuits used in car components is rising rapidly as manufacturers and consumers transition to electric vehicles. It stabilizes the operation of semiconductor chips and maintains the data signal and power supply waveforms. MLCCs are inherently preferred due to their miniaturization, high capacitance, and safety features. EVs such as electric plug-in vehicles, hybrid cars, and self-driving autonomous vehicles use multiple capacitors to control high voltage power reaching. The new generation cars are moving models of connected data centers providing comfort, convenience, safety, and environmental performance. Capacitors provide a smoothing snubber for EV motor inverters and a resonant circuit for non-contact recharging equipment. The ceramic characteristics provide high-temperature resistance and highly enabled ripple characteristics. Engine rooms, powertrain, infotainment systems, gearboxes, and transmitters regularly operate in a high-temperature environment. The capacitors aid in the processing. These factors will boost the growth of the ceramic capacitor market during the forecast period.
Consumer electronic industry
MLCC grade types are the widely used capacitors in billions of electronic devices every year. Newer and upgraded gadgets like smartphones, laptops, tablets, smart TV, and stereo systems are hitting the market frequently as users become highly reliant on the digital world. Capacitors have got smaller in size that can easily fit into PCBs or integrated circuit packages. They are extremely robust with the capacity to withstand tens of thousands of volts of electrostatic discharge. This ensures high-level protection of the device. Capacitors prevent any damage to the onboard electronic circuits and phone screens. They allow these devices to handle complex and sophisticated functions. Moreover, electronic bank cards and patient monitoring systems use capacitors to prevent any loss of electrical load and for improving efficiency along with performance. All such factors will augment the growth of the ceramic capacitor market during the forthcoming years.
Evolving capacity and advent of 5G technology
Ceramic capacitors are getting better with each passing year. There have been solid innovations that have enabled improvements in the dielectric, electrode, and termination points. They can now function over a wider radiofrequency spectrum with capacitive resistance to temperatures over 250 degrees celsius. The capacitors can also withstand higher mechanical stress and a hostile operational environment. Furthermore, as public 5g networks start to roll out in several countries manufacturers are optimizing 5g ready handsets. The demand for passive components like MLCC will rise up significantly moving forward as a typic 5th generation mobile network connection requires at least 1000 capacitors to manage the power rail decoupling and antenna balancing. There is an urgent need to maintain device reliability as 5g requires enhanced air interference frequencies for supporting high rate data calls. High-frequency throughput and low resistance capacity will be the key here. Such exciting possibilities and gradual deployments in the telecom space along with newer technologies like IoT, autonomous vehicles, drones, etc will drive the growth prospects of the ceramic capacitor market during the forecast period.
Based on type, the multilayer ceramic capacitors are likely to maintain dominance in the ceramic capacitor market share due to several end-user applications such as consumer electronics, telecommunication, automotive, etc. They provide capacitance stability and are highly efficient.
Based on application, the automobile segment will grow the highest in the ceramic capacitor market share owing to mass automobile electrification, the advent of autonomous vehicles with smart connection features, and stringent requirements for efficient, durable, safe, and highly performance-based cars.
Based on region, Asia-Pacific will witness considerable growth in the ceramic capacitor market share due to the raid shift towards battery-operated vehicles and EVs. The fast deployment of 5G networks and huge research-intensive activities in emerging economies will contribute positively to the growth.
In this section of the report, the researchers have done a comprehensive analysis of the prominent players operating and the strategies they are focusing on to combat the intense competition. Company profiles and share analysis of the prominent players are also provided in this section. They have also provided reliable sales and revenue data of the manufacturers for the period 2017-2022. With the assistance of this report, key players, stakeholders, and other participants will be able to stay abreast of the recent and upcoming developments in the business, further enabling them to make efficient choices.
|
Report Metric |
Details |
|
Report Name |
Ceramic Capacitor Market |
|
The Market size value in 2022 |
14660 Million USD |
|
The Revenue forecast in 2028 |
23790 Million USD |
|
Growth Rate |
CAGR of 8.4% from 2022 to 2028 |
|
Base year considered |
2022 |
|
Forecast period |
2022-2028 |
|
Forecast units |
Value (USD) |
|
Segments covered |
Type, End-User, Offerings, and Region |
|
Report coverage |
Revenue & volume forecast, company share, competitive landscape, growth factors, and trends |
|
Geographic regions covered |
North America, Europe, Asia Pacific, Latin America, Middle East & Africa |
|
Companies covered |
|
Ans. The global Ceramic Capacitor market size is estimated to be worth US$ 14660 million in 2022 and is forecast to a readjusted size of US$ 23790 million by 2028.
Ans. The global Ceramic Capacitor market size is expected to grow at a compound annual growth rate of 8.4% from 2022 to 2028.
Ans. The key players are Murata, Samsung Electro, TDK Corporation, Kyocera, Vishay, Samwha, Kemet, JDI, NIC Components, Yageo, Walsin, Darfon, Holy Stone, Fenghua Advanced Technology, EYANG, Torch, Three-Circle etc. Top 3 companies occupied about 61% market share.
Table of content:
1 Study Coverage
1.1 Ceramic Capacitor Product Introduction
1.2 Market by Type
1.2.1 Global Ceramic Capacitor Market Size by Type, 2017 VS 2021 VS 2028
1.2.2 Multilayer Ceramic Chip Capacitor (Mlcc)
1.2.3 Ceramic Disc Capacitor
1.2.4 Feedthrough Ceramic Capacitor
1.2.5 Ceramic Power Capacitors
1.3 Market by Application
1.3.1 Global Ceramic Capacitor Market Size by Application, 2017 VS 2021 VS 2028
1.3.2 Automotive
1.3.3 Communications Equipment
1.3.4 Consumer Electronics Products
1.3.5 Others
1.4 Study Objectives
1.5 Years Considered
2 Global Ceramic Capacitor Production
2.1 Global Ceramic Capacitor Production Capacity (2017-2028)
2.2 Global Ceramic Capacitor Production by Region: 2017 VS 2021 VS 2028
2.3 Global Ceramic Capacitor Production by Region
2.3.1 Global Ceramic Capacitor Historic Production by Region (2017-2022)
2.3.2 Global Ceramic Capacitor Forecasted Production by Region (2023-2028)
2.4 North America
2.5 Europe
2.6 China
2.7 Japan
2.8 South Korea
3 Global Ceramic Capacitor Sales in Volume & Value Estimates and Forecasts
3.1 Global Ceramic Capacitor Sales Estimates and Forecasts 2017-2028
3.2 Global Ceramic Capacitor Revenue Estimates and Forecasts 2017-2028
3.3 Global Ceramic Capacitor Revenue by Region: 2017 VS 2021 VS 2028
3.4 Global Ceramic Capacitor Sales by Region
3.4.1 Global Ceramic Capacitor Sales by Region (2017-2022)
3.4.2 Global Sales Ceramic Capacitor by Region (2023-2028)
3.5 Global Ceramic Capacitor Revenue by Region
3.5.1 Global Ceramic Capacitor Revenue by Region (2017-2022)
3.5.2 Global Ceramic Capacitor Revenue by Region (2023-2028)
3.6 North America
3.7 Europe
3.8 Asia-Pacific
3.9 Latin America
3.10 Middle East & Africa
4 Competition by Manufactures
4.1 Global Ceramic Capacitor Production Capacity by Manufacturers
4.2 Global Ceramic Capacitor Sales by Manufacturers
4.2.1 Global Ceramic Capacitor Sales by Manufacturers (2017-2022)
4.2.2 Global Ceramic Capacitor Sales Market Share by Manufacturers (2017-2022)
4.2.3 Global Top 10 and Top 5 Largest Manufacturers of Ceramic Capacitor in 2021
4.3 Global Ceramic Capacitor Revenue by Manufacturers
4.3.1 Global Ceramic Capacitor Revenue by Manufacturers (2017-2022)
4.3.2 Global Ceramic Capacitor Revenue Market Share by Manufacturers (2017-2022)
4.3.3 Global Top 10 and Top 5 Companies by Ceramic Capacitor Revenue in 2021
4.4 Global Ceramic Capacitor Sales Price by Manufacturers
4.5 Analysis of Competitive Landscape
4.5.1 Manufacturers Market Concentration Ratio (CR5 and HHI)
4.5.2 Global Ceramic Capacitor Market Share by Company Type (Tier 1, Tier 2, and Tier 3)
4.5.3 Global Ceramic Capacitor Manufacturers Geographical Distribution
4.6 Mergers & Acquisitions, Expansion Plans
5 Market Size by Type
5.1 Global Ceramic Capacitor Sales by Type
5.1.1 Global Ceramic Capacitor Historical Sales by Type (2017-2022)
5.1.2 Global Ceramic Capacitor Forecasted Sales by Type (2023-2028)
5.1.3 Global Ceramic Capacitor Sales Market Share by Type (2017-2028)
5.2 Global Ceramic Capacitor Revenue by Type
5.2.1 Global Ceramic Capacitor Historical Revenue by Type (2017-2022)
5.2.2 Global Ceramic Capacitor Forecasted Revenue by Type (2023-2028)
5.2.3 Global Ceramic Capacitor Revenue Market Share by Type (2017-2028)
5.3 Global Ceramic Capacitor Price by Type
5.3.1 Global Ceramic Capacitor Price by Type (2017-2022)
5.3.2 Global Ceramic Capacitor Price Forecast by Type (2023-2028)
6 Market Size by Application
6.1 Global Ceramic Capacitor Sales by Application
6.1.1 Global Ceramic Capacitor Historical Sales by Application (2017-2022)
6.1.2 Global Ceramic Capacitor Forecasted Sales by Application (2023-2028)
6.1.3 Global Ceramic Capacitor Sales Market Share by Application (2017-2028)
6.2 Global Ceramic Capacitor Revenue by Application
6.2.1 Global Ceramic Capacitor Historical Revenue by Application (2017-2022)
6.2.2 Global Ceramic Capacitor Forecasted Revenue by Application (2023-2028)
6.2.3 Global Ceramic Capacitor Revenue Market Share by Application (2017-2028)
6.3 Global Ceramic Capacitor Price by Application
6.3.1 Global Ceramic Capacitor Price by Application (2017-2022)
6.3.2 Global Ceramic Capacitor Price Forecast by Application (2023-2028)
7 North America
7.1 North America Ceramic Capacitor Market Size by Type
7.1.1 North America Ceramic Capacitor Sales by Type (2017-2028)
7.1.2 North America Ceramic Capacitor Revenue by Type (2017-2028)
7.2 North America Ceramic Capacitor Market Size by Application
7.2.1 North America Ceramic Capacitor Sales by Application (2017-2028)
7.2.2 North America Ceramic Capacitor Revenue by Application (2017-2028)
7.3 North America Ceramic Capacitor Sales by Country
7.3.1 North America Ceramic Capacitor Sales by Country (2017-2028)
7.3.2 North America Ceramic Capacitor Revenue by Country (2017-2028)
7.3.3 U.S.
7.3.4 Canada
8 Europe
8.1 Europe Ceramic Capacitor Market Size by Type
8.1.1 Europe Ceramic Capacitor Sales by Type (2017-2028)
8.1.2 Europe Ceramic Capacitor Revenue by Type (2017-2028)
8.2 Europe Ceramic Capacitor Market Size by Application
8.2.1 Europe Ceramic Capacitor Sales by Application (2017-2028)
8.2.2 Europe Ceramic Capacitor Revenue by Application (2017-2028)
8.3 Europe Ceramic Capacitor Sales by Country
8.3.1 Europe Ceramic Capacitor Sales by Country (2017-2028)
8.3.2 Europe Ceramic Capacitor Revenue by Country (2017-2028)
8.3.3 Germany
8.3.4 France
8.3.5 U.K.
8.3.6 Italy
8.3.7 Russia
9 Asia Pacific
9.1 Asia Pacific Ceramic Capacitor Market Size by Type
9.1.1 Asia Pacific Ceramic Capacitor Sales by Type (2017-2028)
9.1.2 Asia Pacific Ceramic Capacitor Revenue by Type (2017-2028)
9.2 Asia Pacific Ceramic Capacitor Market Size by Application
9.2.1 Asia Pacific Ceramic Capacitor Sales by Application (2017-2028)
9.2.2 Asia Pacific Ceramic Capacitor Revenue by Application (2017-2028)
9.3 Asia Pacific Ceramic Capacitor Sales by Region
9.3.1 Asia Pacific Ceramic Capacitor Sales by Region (2017-2028)
9.3.2 Asia Pacific Ceramic Capacitor Revenue by Region (2017-2028)
9.3.3 China
9.3.4 Japan
9.3.5 South Korea
9.3.6 India
9.3.7 Australia
9.3.8 Taiwan
9.3.9 Indonesia
9.3.10 Thailand
9.3.11 Malaysia
9.3.12 Philippines
10 Latin America
10.1 Latin America Ceramic Capacitor Market Size by Type
10.1.1 Latin America Ceramic Capacitor Sales by Type (2017-2028)
10.1.2 Latin America Ceramic Capacitor Revenue by Type (2017-2028)
10.2 Latin America Ceramic Capacitor Market Size by Application
10.2.1 Latin America Ceramic Capacitor Sales by Application (2017-2028)
10.2.2 Latin America Ceramic Capacitor Revenue by Application (2017-2028)
10.3 Latin America Ceramic Capacitor Sales by Country
10.3.1 Latin America Ceramic Capacitor Sales by Country (2017-2028)
10.3.2 Latin America Ceramic Capacitor Revenue by Country (2017-2028)
10.3.3 Mexico
10.3.4 Brazil
10.3.5 Argentina
11 Middle East and Africa
11.1 Middle East and Africa Ceramic Capacitor Market Size by Type
11.1.1 Middle East and Africa Ceramic Capacitor Sales by Type (2017-2028)
11.1.2 Middle East and Africa Ceramic Capacitor Revenue by Type (2017-2028)
11.2 Middle East and Africa Ceramic Capacitor Market Size by Application
11.2.1 Middle East and Africa Ceramic Capacitor Sales by Application (2017-2028)
11.2.2 Middle East and Africa Ceramic Capacitor Revenue by Application (2017-2028)
11.3 Middle East and Africa Ceramic Capacitor Sales by Country
11.3.1 Middle East and Africa Ceramic Capacitor Sales by Country (2017-2028)
11.3.2 Middle East and Africa Ceramic Capacitor Revenue by Country (2017-2028)
11.3.3 Turkey
11.3.4 Saudi Arabia
11.3.5 U.A.E
12 Corporate Profiles
12.1 Murata
12.1.1 Murata Corporation Information
12.1.2 Murata Overview
12.1.3 Murata Ceramic Capacitor Sales, Price, Revenue and Gross Margin (2017-2022)
12.1.4 Murata Ceramic Capacitor Product Model Numbers, Pictures, Descriptions and Specifications
12.1.5 Murata Recent Developments
12.2 Samsung Electro
12.2.1 Samsung Electro Corporation Information
12.2.2 Samsung Electro Overview
12.2.3 Samsung Electro Ceramic Capacitor Sales, Price, Revenue and Gross Margin (2017-2022)
12.2.4 Samsung Electro Ceramic Capacitor Product Model Numbers, Pictures, Descriptions and Specifications
12.2.5 Samsung Electro Recent Developments
12.3 TDK Corporation
12.3.1 TDK Corporation Corporation Information
12.3.2 TDK Corporation Overview
12.3.3 TDK Corporation Ceramic Capacitor Sales, Price, Revenue and Gross Margin (2017-2022)
12.3.4 TDK Corporation Ceramic Capacitor Product Model Numbers, Pictures, Descriptions and Specifications
12.3.5 TDK Corporation Recent Developments
12.4 Kyocera
12.4.1 Kyocera Corporation Information
12.4.2 Kyocera Overview
12.4.3 Kyocera Ceramic Capacitor Sales, Price, Revenue and Gross Margin (2017-2022)
12.4.4 Kyocera Ceramic Capacitor Product Model Numbers, Pictures, Descriptions and Specifications
12.4.5 Kyocera Recent Developments
12.5 Vishay
12.5.1 Vishay Corporation Information
12.5.2 Vishay Overview
12.5.3 Vishay Ceramic Capacitor Sales, Price, Revenue and Gross Margin (2017-2022)
12.5.4 Vishay Ceramic Capacitor Product Model Numbers, Pictures, Descriptions and Specifications
12.5.5 Vishay Recent Developments
12.6 Samwha
12.6.1 Samwha Corporation Information
12.6.2 Samwha Overview
12.6.3 Samwha Ceramic Capacitor Sales, Price, Revenue and Gross Margin (2017-2022)
12.6.4 Samwha Ceramic Capacitor Product Model Numbers, Pictures, Descriptions and Specifications
12.6.5 Samwha Recent Developments
12.7 Kemet
12.7.1 Kemet Corporation Information
12.7.2 Kemet Overview
12.7.3 Kemet Ceramic Capacitor Sales, Price, Revenue and Gross Margin (2017-2022)
12.7.4 Kemet Ceramic Capacitor Product Model Numbers, Pictures, Descriptions and Specifications
12.7.5 Kemet Recent Developments
12.8 JDI
12.8.1 JDI Corporation Information
12.8.2 JDI Overview
12.8.3 JDI Ceramic Capacitor Sales, Price, Revenue and Gross Margin (2017-2022)
12.8.4 JDI Ceramic Capacitor Product Model Numbers, Pictures, Descriptions and Specifications
12.8.5 JDI Recent Developments
12.9 NIC Components
12.9.1 NIC Components Corporation Information
12.9.2 NIC Components Overview
12.9.3 NIC Components Ceramic Capacitor Sales, Price, Revenue and Gross Margin (2017-2022)
12.9.4 NIC Components Ceramic Capacitor Product Model Numbers, Pictures, Descriptions and Specifications
12.9.5 NIC Components Recent Developments
12.10 Yageo
12.10.1 Yageo Corporation Information
12.10.2 Yageo Overview
12.10.3 Yageo Ceramic Capacitor Sales, Price, Revenue and Gross Margin (2017-2022)
12.10.4 Yageo Ceramic Capacitor Product Model Numbers, Pictures, Descriptions and Specifications
12.10.5 Yageo Recent Developments
12.11 Walsin
12.11.1 Walsin Corporation Information
12.11.2 Walsin Overview
12.11.3 Walsin Ceramic Capacitor Sales, Price, Revenue and Gross Margin (2017-2022)
12.11.4 Walsin Ceramic Capacitor Product Model Numbers, Pictures, Descriptions and Specifications
12.11.5 Walsin Recent Developments
12.12 Darfon
12.12.1 Darfon Corporation Information
12.12.2 Darfon Overview
12.12.3 Darfon Ceramic Capacitor Sales, Price, Revenue and Gross Margin (2017-2022)
12.12.4 Darfon Ceramic Capacitor Product Model Numbers, Pictures, Descriptions and Specifications
12.12.5 Darfon Recent Developments
12.13 Holy Stone
12.13.1 Holy Stone Corporation Information
12.13.2 Holy Stone Overview
12.13.3 Holy Stone Ceramic Capacitor Sales, Price, Revenue and Gross Margin (2017-2022)
12.13.4 Holy Stone Ceramic Capacitor Product Model Numbers, Pictures, Descriptions and Specifications
12.13.5 Holy Stone Recent Developments
12.14 Fenghua Advanced Technology
12.14.1 Fenghua Advanced Technology Corporation Information
12.14.2 Fenghua Advanced Technology Overview
12.14.3 Fenghua Advanced Technology Ceramic Capacitor Sales, Price, Revenue and Gross Margin (2017-2022)
12.14.4 Fenghua Advanced Technology Ceramic Capacitor Product Model Numbers, Pictures, Descriptions and Specifications
12.14.5 Fenghua Advanced Technology Recent Developments
12.15 EYANG
12.15.1 EYANG Corporation Information
12.15.2 EYANG Overview
12.15.3 EYANG Ceramic Capacitor Sales, Price, Revenue and Gross Margin (2017-2022)
12.15.4 EYANG Ceramic Capacitor Product Model Numbers, Pictures, Descriptions and Specifications
12.15.5 EYANG Recent Developments
12.16 Torch
12.16.1 Torch Corporation Information
12.16.2 Torch Overview
12.16.3 Torch Ceramic Capacitor Sales, Price, Revenue and Gross Margin (2017-2022)
12.16.4 Torch Ceramic Capacitor Product Model Numbers, Pictures, Descriptions and Specifications
12.16.5 Torch Recent Developments
12.17 Three-Circle
12.17.1 Three-Circle Corporation Information
12.17.2 Three-Circle Overview
12.17.3 Three-Circle Ceramic Capacitor Sales, Price, Revenue and Gross Margin (2017-2022)
12.17.4 Three-Circle Ceramic Capacitor Product Model Numbers, Pictures, Descriptions and Specifications
12.17.5 Three-Circle Recent Developments
13 Industry Chain and Sales Channels Analysis
13.1 Ceramic Capacitor Industry Chain Analysis
13.2 Ceramic Capacitor Key Raw Materials
13.2.1 Key Raw Materials
13.2.2 Raw Materials Key Suppliers
13.3 Ceramic Capacitor Production Mode & Process
13.4 Ceramic Capacitor Sales and Marketing
13.4.1 Ceramic Capacitor Sales Channels
13.4.2 Ceramic Capacitor Distributors
13.5 Ceramic Capacitor Customers
14 Market Drivers, Opportunities, Challenges and Risks Factors Analysis
14.1 Ceramic Capacitor Industry Trends
14.2 Ceramic Capacitor Market Drivers
14.3 Ceramic Capacitor Market Challenges
14.4 Ceramic Capacitor Market Restraints
15 Key Finding in The Global Ceramic Capacitor Study
16 Appendix
16.1 Research Methodology
16.1.1 Methodology/Research Approach
16.1.2 Data Source
16.2 Author Details
16.3 Disclaimer
Table of Figures
List of Tables
Table 1. Global Ceramic Capacitor Market Size Growth Rate by Type, 2017 VS 2021 VS 2028 (US$ Million)
Table 2. Major Manufacturers of Multilayer Ceramic Chip Capacitor (Mlcc)
Table 3. Major Manufacturers of Ceramic Disc Capacitor
Table 4. Major Manufacturers of Feedthrough Ceramic Capacitor
Table 5. Major Manufacturers of Ceramic Power Capacitors
Table 6. Global Ceramic Capacitor Market Size Growth Rate by Application, 2017 VS 2021 2028 (US$ Million)
Table 7. Global Ceramic Capacitor Production by Region: 2017 VS 2021 VS 2028 (Billion Units)
Table 8. Global Ceramic Capacitor Production by Region (2017-2022) & (Billion Units)
Table 9. Global Ceramic Capacitor Production Market Share by Region (2017-2022)
Table 10. Global Ceramic Capacitor Production by Region (2023-2028) & (Billion Units)
Table 11. Global Ceramic Capacitor Production Market Share by Region (2023-2028)
Table 12. Global Ceramic Capacitor Revenue by Region: 2017 VS 2021 VS 2028 (US$ Million)
Table 13. Global Ceramic Capacitor Sales by Region (2017-2022) & (Billion Units)
Table 14. Global Ceramic Capacitor Sales Market Share by Region (2017-2022)
Table 15. Global Ceramic Capacitor Sales by Region (2023-2028) & (Billion Units)
Table 16. Global Ceramic Capacitor Sales Market Share by Region (2023-2028)
Table 17. Global Ceramic Capacitor Revenue by Region (2017-2022) & (US$ Million)
Table 18. Global Ceramic Capacitor Revenue Market Share by Region (2017-2022)
Table 19. Global Ceramic Capacitor Revenue by Region (2023-2028) & (US$ Million)
Table 20. Global Ceramic Capacitor Revenue Market Share by Region (2023-2028)
Table 21. Global Ceramic Capacitor Production Capacity by Manufacturers (2017-2022) & (Billion Units)
Table 22. Global Ceramic Capacitor Capacity Market Share by Manufacturers (2017-2022)
Table 23. Global Ceramic Capacitor Sales by Manufacturers (2017-2022) & (Billion Units)
Table 24. Global Ceramic Capacitor Sales Market Share by Manufacturers (2017-2022)
Table 25. Global Ceramic Capacitor Revenue by Manufacturers (2017-2022) & (US$ Million)
Table 26. Global Ceramic Capacitor Revenue Share by Manufacturers (2017-2022)
Table 27. Ceramic Capacitor Price by Manufacturers 2017-2022 (USD/K Unit)
Table 28. Global Ceramic Capacitor Manufacturers Market Concentration Ratio (CR5 and HHI)
Table 29. Global Ceramic Capacitor by Company Type (Tier 1, Tier 2, and Tier 3) & (based on the Revenue in Ceramic Capacitor as of 2021)
Table 30. Ceramic Capacitor Manufacturing Base Distribution and Headquarters
Table 31. Manufacturers Ceramic Capacitor Product Offered
Table 32. Date of Manufacturers Enter into Ceramic Capacitor Market
Table 33. Mergers & Acquisitions, Expansion Plans
Table 34. Global Ceramic Capacitor Sales by Type (2017-2022) & (Billion Units)
Table 35. Global Ceramic Capacitor Sales by Type (2023-2028) & (Billion Units)
Table 36. Global Ceramic Capacitor Sales Share by Type (2017-2022)
Table 37. Global Ceramic Capacitor Sales Share by Type (2023-2028)
Table 38. Global Ceramic Capacitor Revenue by Type (2017-2022) & (US$ Million)
Table 39. Global Ceramic Capacitor Revenue by Type (2023-2028) & (US$ Million)
Table 40. Global Ceramic Capacitor Revenue Share by Type (2017-2022)
Table 41. Global Ceramic Capacitor Revenue Share by Type (2023-2028)
Table 42. Ceramic Capacitor Price by Type (2017-2022) & (USD/K Unit)
Table 43. Global Ceramic Capacitor Price Forecast by Type (2023-2028) & (USD/K Unit)
Table 44. Global Ceramic Capacitor Sales by Application (2017-2022) & (Billion Units)
Table 45. Global Ceramic Capacitor Sales by Application (2023-2028) & (Billion Units)
Table 46. Global Ceramic Capacitor Sales Share by Application (2017-2022)
Table 47. Global Ceramic Capacitor Sales Share by Application (2023-2028)
Table 48. Global Ceramic Capacitor Revenue by Application (2017-2022) & (US$ Million)
Table 49. Global Ceramic Capacitor Revenue by Application (2023-2028) & (US$ Million)
Table 50. Global Ceramic Capacitor Revenue Share by Application (2017-2022)
Table 51. Global Ceramic Capacitor Revenue Share by Application (2023-2028)
Table 52. Ceramic Capacitor Price by Application (2017-2022) & (USD/K Unit)
Table 53. Global Ceramic Capacitor Price Forecast by Application (2023-2028) & (USD/K Unit)
Table 54. North America Ceramic Capacitor Sales by Type (2017-2022) & (Billion Units)
Table 55. North America Ceramic Capacitor Sales by Type (2023-2028) & (Billion Units)
Table 56. North America Ceramic Capacitor Revenue by Type (2017-2022) & (US$ Million)
Table 57. North America Ceramic Capacitor Revenue by Type (2023-2028) & (US$ Million)
Table 58. North America Ceramic Capacitor Sales by Application (2017-2022) & (Billion Units)
Table 59. North America Ceramic Capacitor Sales by Application (2023-2028) & (Billion Units)
Table 60. North America Ceramic Capacitor Revenue by Application (2017-2022) & (US$ Million)
Table 61. North America Ceramic Capacitor Revenue by Application (2023-2028) & (US$ Million)
Table 62. North America Ceramic Capacitor Sales by Country (2017-2022) & (Billion Units)
Table 63. North America Ceramic Capacitor Sales by Country (2023-2028) & (Billion Units)
Table 64. North America Ceramic Capacitor Revenue by Country (2017-2022) & (US$ Million)
Table 65. North America Ceramic Capacitor Revenue by Country (2023-2028) & (US$ Million)
Table 66. Europe Ceramic Capacitor Sales by Type (2017-2022) & (Billion Units)
Table 67. Europe Ceramic Capacitor Sales by Type (2023-2028) & (Billion Units)
Table 68. Europe Ceramic Capacitor Revenue by Type (2017-2022) & (US$ Million)
Table 69. Europe Ceramic Capacitor Revenue by Type (2023-2028) & (US$ Million)
Table 70. Europe Ceramic Capacitor Sales by Application (2017-2022) & (Billion Units)
Table 71. Europe Ceramic Capacitor Sales by Application (2023-2028) & (Billion Units)
Table 72. Europe Ceramic Capacitor Revenue by Application (2017-2022) & (US$ Million)
Table 73. Europe Ceramic Capacitor Revenue by Application (2023-2028) & (US$ Million)
Table 74. Europe Ceramic Capacitor Sales by Country (2017-2022) & (Billion Units)
Table 75. Europe Ceramic Capacitor Sales by Country (2023-2028) & (Billion Units)
Table 76. Europe Ceramic Capacitor Revenue by Country (2017-2022) & (US$ Million)
Table 77. Europe Ceramic Capacitor Revenue by Country (2023-2028) & (US$ Million)
Table 78. Asia Pacific Ceramic Capacitor Sales by Type (2017-2022) & (Billion Units)
Table 79. Asia Pacific Ceramic Capacitor Sales by Type (2023-2028) & (Billion Units)
Table 80. Asia Pacific Ceramic Capacitor Revenue by Type (2017-2022) & (US$ Million)
Table 81. Asia Pacific Ceramic Capacitor Revenue by Type (2023-2028) & (US$ Million)
Table 82. Asia Pacific Ceramic Capacitor Sales by Application (2017-2022) & (Billion Units)
Table 83. Asia Pacific Ceramic Capacitor Sales by Application (2023-2028) & (Billion Units)
Table 84. Asia Pacific Ceramic Capacitor Revenue by Application (2017-2022) & (US$ Million)
Table 85. Asia Pacific Ceramic Capacitor Revenue by Application (2023-2028) & (US$ Million)
Table 86. Asia Pacific Ceramic Capacitor Sales by Region (2017-2022) & (Billion Units)
Table 87. Asia Pacific Ceramic Capacitor Sales by Region (2023-2028) & (Billion Units)
Table 88. Asia Pacific Ceramic Capacitor Revenue by Region (2017-2022) & (US$ Million)
Table 89. Asia Pacific Ceramic Capacitor Revenue by Region (2023-2028) & (US$ Million)
Table 90. Latin America Ceramic Capacitor Sales by Type (2017-2022) & (Billion Units)
Table 91. Latin America Ceramic Capacitor Sales by Type (2023-2028) & (Billion Units)
Table 92. Latin America Ceramic Capacitor Revenue by Type (2017-2022) & (US$ Million)
Table 93. Latin America Ceramic Capacitor Revenue by Type (2023-2028) & (US$ Million)
Table 94. Latin America Ceramic Capacitor Sales by Application (2017-2022) & (Billion Units)
Table 95. Latin America Ceramic Capacitor Sales by Application (2023-2028) & (Billion Units)
Table 96. Latin America Ceramic Capacitor Revenue by Application (2017-2022) & (US$ Million)
Table 97. Latin America Ceramic Capacitor Revenue by Application (2023-2028) & (US$ Million)
Table 98. Latin America Ceramic Capacitor Sales by Country (2017-2022) & (Billion Units)
Table 99. Latin America Ceramic Capacitor Sales by Country (2023-2028) & (Billion Units)
Table 100. Latin America Ceramic Capacitor Revenue by Country (2017-2022) & (US$ Million)
Table 101. Latin America Ceramic Capacitor Revenue by Country (2023-2028) & (US$ Million)
Table 102. Middle East and Africa Ceramic Capacitor Sales by Type (2017-2022) & (Billion Units)
Table 103. Middle East and Africa Ceramic Capacitor Sales by Type (2023-2028) & (Billion Units)
Table 104. Middle East and Africa Ceramic Capacitor Revenue by Type (2017-2022) & (US$ Million)
Table 105. Middle East and Africa Ceramic Capacitor Revenue by Type (2023-2028) & (US$ Million)
Table 106. Middle East and Africa Ceramic Capacitor Sales by Application (2017-2022) & (Billion Units)
Table 107. Middle East and Africa Ceramic Capacitor Sales by Application (2023-2028) & (Billion Units)
Table 108. Middle East and Africa Ceramic Capacitor Revenue by Application (2017-2022) & (US$ Million)
Table 109. Middle East and Africa Ceramic Capacitor Revenue by Application (2023-2028) & (US$ Million)
Table 110. Middle East and Africa Ceramic Capacitor Sales by Country (2017-2022) & (Billion Units)
Table 111. Middle East and Africa Ceramic Capacitor Sales by Country (2023-2028) & (Billion Units)
Table 112. Middle East and Africa Ceramic Capacitor Revenue by Country (2017-2022) & (US$ Million)
Table 113. Middle East and Africa Ceramic Capacitor Revenue by Country (2023-2028) & (US$ Million)
Table 114. Murata Corporation Information
Table 115. Murata Description and Major Businesses
Table 116. Murata Ceramic Capacitor Sales (Billion Units), Revenue (US$ Million), Price (USD/K Unit) and Gross Margin (2017-2022)
Table 117. Murata Ceramic Capacitor Product Model Numbers, Pictures, Descriptions and Specifications
Table 118. Murata Recent Development
Table 119. Samsung Electro Corporation Information
Table 120. Samsung Electro Description and Major Businesses
Table 121. Samsung Electro Ceramic Capacitor Sales (Billion Units), Revenue (US$ Million), Price (USD/K Unit) and Gross Margin (2017-2022)
Table 122. Samsung Electro Ceramic Capacitor Product Model Numbers, Pictures, Descriptions and Specifications
Table 123. Samsung Electro Recent Development
Table 124. TDK Corporation Corporation Information
Table 125. TDK Corporation Description and Major Businesses
Table 126. TDK Corporation Ceramic Capacitor Sales (Billion Units), Revenue (US$ Million), Price (USD/K Unit) and Gross Margin (2017-2022)
Table 127. TDK Corporation Ceramic Capacitor Product Model Numbers, Pictures, Descriptions and Specifications
Table 128. TDK Corporation Recent Development
Table 129. Kyocera Corporation Information
Table 130. Kyocera Description and Major Businesses
Table 131. Kyocera Ceramic Capacitor Sales (Billion Units), Revenue (US$ Million), Price (USD/K Unit) and Gross Margin (2017-2022)
Table 132. Kyocera Ceramic Capacitor Product Model Numbers, Pictures, Descriptions and Specifications
Table 133. Kyocera Recent Development
Table 134. Vishay Corporation Information
Table 135. Vishay Description and Major Businesses
Table 136. Vishay Ceramic Capacitor Sales (Billion Units), Revenue (US$ Million), Price (USD/K Unit) and Gross Margin (2017-2022)
Table 137. Vishay Ceramic Capacitor Product Model Numbers, Pictures, Descriptions and Specifications
Table 138. Vishay Recent Development
Table 139. Samwha Corporation Information
Table 140. Samwha Description and Major Businesses
Table 141. Samwha Ceramic Capacitor Sales (Billion Units), Revenue (US$ Million), Price (USD/K Unit) and Gross Margin (2017-2022)
Table 142. Samwha Ceramic Capacitor Product Model Numbers, Pictures, Descriptions and Specifications
Table 143. Samwha Recent Development
Table 144. Kemet Corporation Information
Table 145. Kemet Description and Major Businesses
Table 146. Kemet Ceramic Capacitor Sales (Billion Units), Revenue (US$ Million), Price (USD/K Unit) and Gross Margin (2017-2022)
Table 147. Kemet Ceramic Capacitor Product Model Numbers, Pictures, Descriptions and Specifications
Table 148. Kemet Recent Development
Table 149. JDI Corporation Information
Table 150. JDI Description and Major Businesses
Table 151. JDI Ceramic Capacitor Sales (Billion Units), Revenue (US$ Million), Price (USD/K Unit) and Gross Margin (2017-2022)
Table 152. JDI Ceramic Capacitor Product Model Numbers, Pictures, Descriptions and Specifications
Table 153. JDI Recent Development
Table 154. NIC Components Corporation Information
Table 155. NIC Components Description and Major Businesses
Table 156. NIC Components Ceramic Capacitor Sales (Billion Units), Revenue (US$ Million), Price (USD/K Unit) and Gross Margin (2017-2022)
Table 157. NIC Components Ceramic Capacitor Product Model Numbers, Pictures, Descriptions and Specifications
Table 158. NIC Components Recent Development
Table 159. Yageo Corporation Information
Table 160. Yageo Description and Major Businesses
Table 161. Yageo Ceramic Capacitor Sales (Billion Units), Revenue (US$ Million), Price (USD/K Unit) and Gross Margin (2017-2022)
Table 162. Yageo Ceramic Capacitor Product Model Numbers, Pictures, Descriptions and Specifications
Table 163. Yageo Recent Development
Table 164. Walsin Corporation Information
Table 165. Walsin Description and Major Businesses
Table 166. Walsin Ceramic Capacitor Sales (Billion Units), Revenue (US$ Million), Price (USD/K Unit) and Gross Margin (2017-2022)
Table 167. Walsin Ceramic Capacitor Product Model Numbers, Pictures, Descriptions and Specifications
Table 168. Walsin Recent Development
Table 169. Darfon Corporation Information
Table 170. Darfon Description and Major Businesses
Table 171. Darfon Ceramic Capacitor Sales (Billion Units), Revenue (US$ Million), Price (USD/K Unit) and Gross Margin (2017-2022)
Table 172. Darfon Ceramic Capacitor Product Model Numbers, Pictures, Descriptions and Specifications
Table 173. Darfon Recent Development
Table 174. Holy Stone Corporation Information
Table 175. Holy Stone Description and Major Businesses
Table 176. Holy Stone Ceramic Capacitor Sales (Billion Units), Revenue (US$ Million), Price (USD/K Unit) and Gross Margin (2017-2022)
Table 177. Holy Stone Ceramic Capacitor Product Model Numbers, Pictures, Descriptions and Specifications
Table 178. Holy Stone Recent Development
Table 179. Fenghua Advanced Technology Corporation Information
Table 180. Fenghua Advanced Technology Description and Major Businesses
Table 181. Fenghua Advanced Technology Ceramic Capacitor Sales (Billion Units), Revenue (US$ Million), Price (USD/K Unit) and Gross Margin (2017-2022)
Table 182. Fenghua Advanced Technology Ceramic Capacitor Product Model Numbers, Pictures, Descriptions and Specifications
Table 183. Fenghua Advanced Technology Recent Development
Table 184. EYANG Corporation Information
Table 185. EYANG Description and Major Businesses
Table 186. EYANG Ceramic Capacitor Sales (Billion Units), Revenue (US$ Million), Price (USD/K Unit) and Gross Margin (2017-2022)
Table 187. EYANG Ceramic Capacitor Product Model Numbers, Pictures, Descriptions and Specifications
Table 188. EYANG Recent Development
Table 189. Torch Corporation Information
Table 190. Torch Description and Major Businesses
Table 191. Torch Ceramic Capacitor Sales (Billion Units), Revenue (US$ Million), Price (USD/K Unit) and Gross Margin (2017-2022)
Table 192. Torch Ceramic Capacitor Product Model Numbers, Pictures, Descriptions and Specifications
Table 193. Torch Recent Development
Table 194. Three-Circle Corporation Information
Table 195. Three-Circle Description and Major Businesses
Table 196. Three-Circle Ceramic Capacitor Sales (Billion Units), Revenue (US$ Million), Price (USD/K Unit) and Gross Margin (2017-2022)
Table 197. Three-Circle Ceramic Capacitor Product Model Numbers, Pictures, Descriptions and Specifications
Table 198. Three-Circle Recent Development
Table 199. Key Raw Materials Lists
Table 200. Raw Materials Key Suppliers Lists
Table 201. Ceramic Capacitor Distributors List
Table 202. Ceramic Capacitor Customers List
Table 203. Ceramic Capacitor Market Trends
Table 204. Ceramic Capacitor Market Drivers
Table 205. Ceramic Capacitor Market Challenges
Table 206. Ceramic Capacitor Market Restraints
Table 207. Research Programs/Design for This Report
Table 208. Key Data Information from Secondary Sources
Table 209. Key Data Information from Primary Sources
List of Figures
Figure 1. Ceramic Capacitor Product Picture
Figure 2. Global Ceramic Capacitor Market Share by Type in 2021 & 2028
Figure 3. Multilayer Ceramic Chip Capacitor (Mlcc) Product Picture
Figure 4. Ceramic Disc Capacitor Product Picture
Figure 5. Feedthrough Ceramic Capacitor Product Picture
Figure 6. Ceramic Power Capacitors Product Picture
Figure 7. Global Ceramic Capacitor Market Share by Application in 2021 & 2028
Figure 8. Automotive
Figure 9. Communications Equipment
Figure 10. Consumer Electronics Products
Figure 11. Others
Figure 12. Ceramic Capacitor Report Years Considered
Figure 13. Global Ceramic Capacitor Capacity, Production and Utilization (2017-2028) & (Billion Units)
Figure 14. Global Ceramic Capacitor Production Market Share by Region in Percentage: 2021 Versus 2028
Figure 15. Global Ceramic Capacitor Production Market Share by Region (2017-2022)
Figure 16. Global Ceramic Capacitor Production Market Share by Region (2023-2028)
Figure 17. Ceramic Capacitor Production Growth Rate in North America (2017-2028) & (Billion Units)
Figure 18. Ceramic Capacitor Production Growth Rate in Europe (2017-2028) & (Billion Units)
Figure 19. Ceramic Capacitor Production Growth Rate in China (2017-2028) & (Billion Units)
Figure 20. Ceramic Capacitor Production Growth Rate in Japan (2017-2028) & (Billion Units)
Figure 21. Ceramic Capacitor Production Growth Rate in South Korea (2017-2028) & (Billion Units)
Figure 22. Global Ceramic Capacitor Sales 2017-2028 (Billion Units)
Figure 23. Global Ceramic Capacitor Revenue, (US$ Million), 2017 VS 2021 VS 2028
Figure 24. Global Ceramic Capacitor Revenue 2017-2028 (US$ Million)
Figure 25. Global Ceramic Capacitor Revenue Market Share by Region in Percentage: 2021 Versus 2028
Figure 26. Global Ceramic Capacitor Sales Market Share by Region (2017-2022)
Figure 27. Global Ceramic Capacitor Sales Market Share by Region (2023-2028)
Figure 28. North America Ceramic Capacitor Sales YoY (2017-2028) & (Billion Units)
Figure 29. North America Ceramic Capacitor Revenue YoY (2017-2028) & (US$ Million)
Figure 30. Europe Ceramic Capacitor Sales YoY (2017-2028) & (Billion Units)
Figure 31. Europe Ceramic Capacitor Revenue YoY (2017-2028) & (US$ Million)
Figure 32. Asia-Pacific Ceramic Capacitor Sales YoY (2017-2028) & (Billion Units)
Figure 33. Asia-Pacific Ceramic Capacitor Revenue YoY (2017-2028) & (US$ Million)
Figure 34. Latin America Ceramic Capacitor Sales YoY (2017-2028) & (Billion Units)
Figure 35. Latin America Ceramic Capacitor Revenue YoY (2017-2028) & (US$ Million)
Figure 36. Middle East & Africa Ceramic Capacitor Sales YoY (2017-2028) & (Billion Units)
Figure 37. Middle East & Africa Ceramic Capacitor Revenue YoY (2017-2028) & (US$ Million)
Figure 38. The Ceramic Capacitor Market Share of Top 10 and Top 5 Largest Manufacturers Around the World in 2021
Figure 39. The Top 5 and 10 Largest Manufacturers of Ceramic Capacitor in the World: Market Share by Ceramic Capacitor Revenue in 2021
Figure 40. Ceramic Capacitor Market Share by Company Type (Tier 1, Tier 2, and Tier 3): 2017 VS 2021
Figure 41. Global Ceramic Capacitor Sales Market Share by Type (2017-2028)
Figure 42. Global Ceramic Capacitor Revenue Market Share by Type (2017-2028)
Figure 43. Global Ceramic Capacitor Sales Market Share by Application (2017-2028)
Figure 44. Global Ceramic Capacitor Revenue Market Share by Application (2017-2028)
Figure 45. North America Ceramic Capacitor Sales Market Share by Type (2017-2028)
Figure 46. North America Ceramic Capacitor Revenue Market Share by Type (2017-2028)
Figure 47. North America Ceramic Capacitor Sales Market Share by Application (2017-2028)
Figure 48. North America Ceramic Capacitor Revenue Market Share by Application (2017-2028)
Figure 49. North America Ceramic Capacitor Sales Share by Country (2017-2028)
Figure 50. North America Ceramic Capacitor Revenue Share by Country (2017-2028)
Figure 51. U.S. Ceramic Capacitor Revenue (2017-2028) & (US$ Million)
Figure 52. Canada Ceramic Capacitor Revenue (2017-2028) & (US$ Million)
Figure 53. Europe Ceramic Capacitor Sales Market Share by Type (2017-2028)
Figure 54. Europe Ceramic Capacitor Revenue Market Share by Type (2017-2028)
Figure 55. Europe Ceramic Capacitor Sales Market Share by Application (2017-2028)
Figure 56. Europe Ceramic Capacitor Revenue Market Share by Application (2017-2028)
Figure 57. Europe Ceramic Capacitor Sales Share by Country (2017-2028)
Figure 58. Europe Ceramic Capacitor Revenue Share by Country (2017-2028)
Figure 59. Germany Ceramic Capacitor Revenue (2017-2028) & (US$ Million)
Figure 60. France Ceramic Capacitor Revenue (2017-2028) & (US$ Million)
Figure 61. U.K. Ceramic Capacitor Revenue (2017-2028) & (US$ Million)
Figure 62. Italy Ceramic Capacitor Revenue (2017-2028) & (US$ Million)
Figure 63. Russia Ceramic Capacitor Revenue (2017-2028) & (US$ Million)
Figure 64. Asia Pacific Ceramic Capacitor Sales Market Share by Type (2017-2028)
Figure 65. Asia Pacific Ceramic Capacitor Revenue Market Share by Type (2017-2028)
Figure 66. Asia Pacific Ceramic Capacitor Sales Market Share by Application (2017-2028)
Figure 67. Asia Pacific Ceramic Capacitor Revenue Market Share by Application (2017-2028)
Figure 68. Asia Pacific Ceramic Capacitor Sales Share by Region (2017-2028)
Figure 69. Asia Pacific Ceramic Capacitor Revenue Share by Region (2017-2028)
Figure 70. China Ceramic Capacitor Revenue (2017-2028) & (US$ Million)
Figure 71. Japan Ceramic Capacitor Revenue (2017-2028) & (US$ Million)
Figure 72. South Korea Ceramic Capacitor Revenue (2017-2028) & (US$ Million)
Figure 73. India Ceramic Capacitor Revenue (2017-2028) & (US$ Million)
Figure 74. Australia Ceramic Capacitor Revenue (2017-2028) & (US$ Million)
Figure 75. Taiwan Ceramic Capacitor Revenue (2017-2028) & (US$ Million)
Figure 76. Indonesia Ceramic Capacitor Revenue (2017-2028) & (US$ Million)
Figure 77. Thailand Ceramic Capacitor Revenue (2017-2028) & (US$ Million)
Figure 78. Malaysia Ceramic Capacitor Revenue (2017-2028) & (US$ Million)
Figure 79. Philippines Ceramic Capacitor Revenue (2017-2028) & (US$ Million)
Figure 80. Latin America Ceramic Capacitor Sales Market Share by Type (2017-2028)
Figure 81. Latin America Ceramic Capacitor Revenue Market Share by Type (2017-2028)
Figure 82. Latin America Ceramic Capacitor Sales Market Share by Application (2017-2028)
Figure 83. Latin America Ceramic Capacitor Revenue Market Share by Application (2017-2028)
Figure 84. Latin America Ceramic Capacitor Sales Share by Country (2017-2028)
Figure 85. Latin America Ceramic Capacitor Revenue Share by Country (2017-2028)
Figure 86. Mexico Ceramic Capacitor Revenue (2017-2028) & (US$ Million)
Figure 87. Brazil Ceramic Capacitor Revenue (2017-2028) & (US$ Million)
Figure 88. Argentina Ceramic Capacitor Revenue (2017-2028) & (US$ Million)
Figure 89. Middle East and Africa Ceramic Capacitor Sales Market Share by Type (2017-2028)
Figure 90. Middle East and Africa Ceramic Capacitor Revenue Market Share by Type (2017-2028)
Figure 91. Middle East and Africa Ceramic Capacitor Sales Market Share by Application (2017-2028)
Figure 92. Middle East and Africa Ceramic Capacitor Revenue Market Share by Application (2017-2028)
Figure 93. Middle East and Africa Ceramic Capacitor Sales Share by Country (2017-2028)
Figure 94. Middle East and Africa Ceramic Capacitor Revenue Share by Country (2017-2028)
Figure 95. Turkey Ceramic Capacitor Revenue (2017-2028) & (US$ Million)
Figure 96. Saudi Arabia Ceramic Capacitor Revenue (2017-2028) & (US$ Million)
Figure 97. U.A.E Ceramic Capacitor Revenue (2017-2028) & (US$ Million)
Figure 98. Ceramic Capacitor Value Chain
Figure 99. Ceramic Capacitor Production Process
Figure 100. Channels of Distribution
Figure 101. Distributors Profiles
Figure 102. Bottom-up and Top-down Approaches for This Report
Figure 103. Data Triangulation
Figure 104. Key Executives Interviewed
$4900
$7350
$9800
HAVE A QUERY?
OUR CUSTOMER

SIMILAR REPORTS