1 Market Overview
1.1 Wine Label Printers Product Introduction
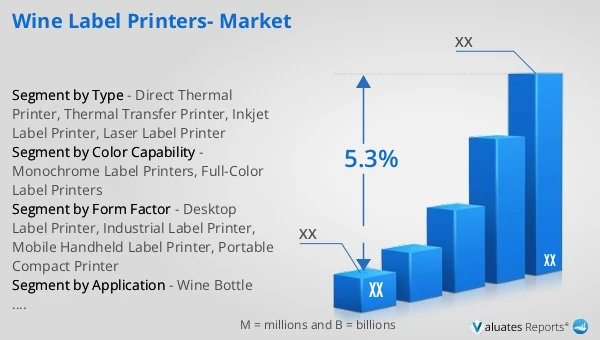
1.2 Global Wine Label Printers Market Size Forecast
1.2.1 Global Wine Label Printers Sales Value (2021–2032)
1.2.2 Global Wine Label Printers Sales Volume (2021–2032)
1.2.3 Global Wine Label Printers Sales Price (2021–2032)
1.3 Wine Label Printers Market Trends & Drivers
1.3.1 Wine Label Printers Industry Trends
1.3.2 Wine Label Printers Market Drivers & Opportunities
1.3.3 Wine Label Printers Market Challenges
1.3.4 Wine Label Printers Market Restraints
1.3.5 Impact of U.S. Tariffs
1.4 Assumptions and Limitations
1.5 Study Objectives
1.6 Years Considered
2 Competitive Analysis by Company
2.1 Global Wine Label Printers Players Revenue Ranking (2025)
2.2 Global Wine Label Printers Revenue by Company (2021–2026)
2.3 Global Wine Label Printers Sales Volume Ranking of Players (2025)
2.4 Global Wine Label Printers Sales Volume by Company (2021–2026)
2.5 Global Wine Label Printers Average Price by Company (2021–2026)
2.6 Key Manufacturers Wine Label Printers Manufacturing Base and Headquarters
2.7 Key Manufacturers Wine Label Printers Product Offerings
2.8 Key Manufacturers Start of Mass Production of Wine Label Printers
2.9 Wine Label Printers Market Competitive Analysis
2.9.1 Wine Label Printers Market Concentration Rate (2021–2026)
2.9.2 Global 5 and 10 Largest Manufacturers by Wine Label Printers Revenue in 2025
2.9.3 Global Companies by Tier (Tier 1, Tier 2, Tier 3), based on Wine Label Printers revenue, 2025
2.10 Mergers & Acquisitions and Expansion
3 Segmentation Wine Label Printers Market Classification
3.1 Introduction by Type
3.1.1 Direct Thermal Printer
3.1.2 Thermal Transfer Printer
3.1.3 Inkjet Label Printer
3.1.4 Laser Label Printer
3.1.5 Global Wine Label Printers Sales Value by Type
3.1.5.1 Global Wine Label Printers Sales Value by Type (2021 vs 2025 vs 2032)
3.1.5.2 Global Wine Label Printers Sales Value, by Type (2021–2032)
3.1.5.3 Global Wine Label Printers Sales Value, by Type (%), 2021–2032
3.1.6 Global Wine Label Printers Sales Volume by Type
3.1.6.1 Global Wine Label Printers Sales Volume by Type (2021 vs 2025 vs 2032)
3.1.6.2 Global Wine Label Printers Sales Volume, by Type (2021–2032)
3.1.6.3 Global Wine Label Printers Sales Volume, by Type (%), 2021–2032
3.1.7 Global Wine Label Printers Average Price by Type (2021–2032)
3.2 Introduction by Form Factor
3.2.1 Desktop Label Printer
3.2.2 Industrial Label Printer
3.2.3 Mobile Handheld Label Printer
3.2.4 Portable Compact Printer
3.2.5 Global Wine Label Printers Sales Value by Form Factor
3.2.5.1 Global Wine Label Printers Sales Value by Form Factor (2021 vs 2025 vs 2032)
3.2.5.2 Global Wine Label Printers Sales Value, by Form Factor (2021–2032)
3.2.5.3 Global Wine Label Printers Sales Value, by Form Factor (%), 2021–2032
3.2.6 Global Wine Label Printers Sales Volume by Form Factor
3.2.6.1 Global Wine Label Printers Sales Volume by Form Factor (2021 vs 2025 vs 2032)
3.2.6.2 Global Wine Label Printers Sales Volume, by Form Factor (2021–2032)
3.2.6.3 Global Wine Label Printers Sales Volume, by Form Factor (%), 2021–2032
3.2.7 Global Wine Label Printers Average Price by Form Factor (2021–2032)
3.3 Introduction by Color Capability
3.3.1 Monochrome Label Printers
3.3.2 Full-Color Label Printers
3.3.3 Global Wine Label Printers Sales Value by Color Capability
3.3.3.1 Global Wine Label Printers Sales Value by Color Capability (2021 vs 2025 vs 2032)
3.3.3.2 Global Wine Label Printers Sales Value, by Color Capability (2021–2032)
3.3.3.3 Global Wine Label Printers Sales Value, by Color Capability (%), 2021–2032
3.3.4 Global Wine Label Printers Sales Volume by Color Capability
3.3.4.1 Global Wine Label Printers Sales Volume by Color Capability (2021 vs 2025 vs 2032)
3.3.4.2 Global Wine Label Printers Sales Volume, by Color Capability (2021–2032)
3.3.4.3 Global Wine Label Printers Sales Volume, by Color Capability (%), 2021–2032
3.3.5 Global Wine Label Printers Average Price by Color Capability (2021–2032)
4 Segmentation by Application
4.1 Introduction by Application
4.1.1 Wine Bottle Branding Labels
4.1.2 Wine Regulatory Information Labels
4.1.3 Promotional & Limited-Edition Labels
4.1.4 Others
4.2 Global Wine Label Printers Sales Value by Application
4.2.1 Global Wine Label Printers Sales Value by Application (2021 vs 2025 vs 2032)
4.2.2 Global Wine Label Printers Sales Value, by Application (2021–2032)
4.2.3 Global Wine Label Printers Sales Value, by Application (%), 2021–2032
4.3 Global Wine Label Printers Sales Volume by Application
4.3.1 Global Wine Label Printers Sales Volume by Application (2021 vs 2025 vs 2032)
4.3.2 Global Wine Label Printers Sales Volume, by Application (2021–2032)
4.3.3 Global Wine Label Printers Sales Volume, by Application (%), 2021–2032
4.4 Global Wine Label Printers Average Price by Application (2021–2032)
5 Segmentation by Region
5.1 Global Wine Label Printers Sales Value by Region
5.1.1 Global Wine Label Printers Sales Value by Region: 2021 vs 2025 vs 2032
5.1.2 Global Wine Label Printers Sales Value by Region (2021–2026)
5.1.3 Global Wine Label Printers Sales Value by Region (2027–2032)
5.1.4 Global Wine Label Printers Sales Value by Region (%), 2021–2032
5.2 Global Wine Label Printers Sales Volume by Region
5.2.1 Global Wine Label Printers Sales Volume by Region: 2021 vs 2025 vs 2032
5.2.2 Global Wine Label Printers Sales Volume by Region (2021–2026)
5.2.3 Global Wine Label Printers Sales Volume by Region (2027–2032)
5.2.4 Global Wine Label Printers Sales Volume by Region (%), 2021–2032
5.3 Global Wine Label Printers Average Price by Region (2021–2032)
5.4 North America
5.4.1 North America Wine Label Printers Sales Value, 2021–2032
5.4.2 North America Wine Label Printers Sales Value by Country (%), 2025 vs 2032
5.5 Europe
5.5.1 Europe Wine Label Printers Sales Value, 2021–2032
5.5.2 Europe Wine Label Printers Sales Value by Country (%), 2025 vs 2032
5.6 Asia Pacific
5.6.1 Asia Pacific Wine Label Printers Sales Value, 2021–2032
5.6.2 Asia Pacific Wine Label Printers Sales Value by Region (%), 2025 vs 2032
5.7 South America
5.7.1 South America Wine Label Printers Sales Value, 2021–2032
5.7.2 South America Wine Label Printers Sales Value by Country (%), 2025 vs 2032
5.8 Middle East & Africa
5.8.1 Middle East & Africa Wine Label Printers Sales Value, 2021–2032
5.8.2 Middle East & Africa Wine Label Printers Sales Value by Country (%), 2025 vs 2032
6 Segmentation by Key Countries/Regions
6.1 Key Countries/Regions Wine Label Printers Sales Value Growth Trends, 2021 vs 2025 vs 2032
6.2 Key Countries/Regions Wine Label Printers Sales Value and Sales Volume
6.2.1 Key Countries/Regions Wine Label Printers Sales Value, 2021–2032
6.2.2 Key Countries/Regions Wine Label Printers Sales Volume, 2021–2032
6.3 United States
6.3.1 United States Wine Label Printers Sales Value, 2021–2032
6.3.2 United States Wine Label Printers Sales Value by Type (%), 2025 vs 2032
6.3.3 United States Wine Label Printers Sales Value by Application, 2025 vs 2032
6.4 Europe
6.4.1 Europe Wine Label Printers Sales Value, 2021–2032
6.4.2 Europe Wine Label Printers Sales Value by Type (%), 2025 vs 2032
6.4.3 Europe Wine Label Printers Sales Value by Application, 2025 vs 2032
6.5 China
6.5.1 China Wine Label Printers Sales Value, 2021–2032
6.5.2 China Wine Label Printers Sales Value by Type (%), 2025 vs 2032
6.5.3 China Wine Label Printers Sales Value by Application, 2025 vs 2032
6.6 Japan
6.6.1 Japan Wine Label Printers Sales Value, 2021–2032
6.6.2 Japan Wine Label Printers Sales Value by Type (%), 2025 vs 2032
6.6.3 Japan Wine Label Printers Sales Value by Application, 2025 vs 2032
6.7 South Korea
6.7.1 South Korea Wine Label Printers Sales Value, 2021–2032
6.7.2 South Korea Wine Label Printers Sales Value by Type (%), 2025 vs 2032
6.7.3 South Korea Wine Label Printers Sales Value by Application, 2025 vs 2032
6.8 Southeast Asia
6.8.1 Southeast Asia Wine Label Printers Sales Value, 2021–2032
6.8.2 Southeast Asia Wine Label Printers Sales Value by Type (%), 2025 vs 2032
6.8.3 Southeast Asia Wine Label Printers Sales Value by Application, 2025 vs 2032
6.9 India
6.9.1 India Wine Label Printers Sales Value, 2021–2032
6.9.2 India Wine Label Printers Sales Value by Type (%), 2025 vs 2032
6.9.3 India Wine Label Printers Sales Value by Application, 2025 vs 2032
7 Company Profiles
7.1 HP Indigo
7.1.1 HP Indigo Company Information
7.1.2 HP Indigo Introduction and Business Overview
7.1.3 HP Indigo Wine Label Printers Sales, Revenue, Price and Gross Margin (2021–2026)
7.1.4 HP Indigo Wine Label Printers Product Offerings
7.1.5 HP Indigo Recent Developments
7.2 Xeikon
7.2.1 Xeikon Company Information
7.2.2 Xeikon Introduction and Business Overview
7.2.3 Xeikon Wine Label Printers Sales, Revenue, Price and Gross Margin (2021–2026)
7.2.4 Xeikon Wine Label Printers Product Offerings
7.2.5 Xeikon Recent Developments
7.3 Heidelberg Gallus
7.3.1 Heidelberg Gallus Company Information
7.3.2 Heidelberg Gallus Introduction and Business Overview
7.3.3 Heidelberg Gallus Wine Label Printers Sales, Revenue, Price and Gross Margin (2021–2026)
7.3.4 Heidelberg Gallus Wine Label Printers Product Offerings
7.3.5 Heidelberg Gallus Recent Developments
7.4 Mark Andy
7.4.1 Mark Andy Company Information
7.4.2 Mark Andy Introduction and Business Overview
7.4.3 Mark Andy Wine Label Printers Sales, Revenue, Price and Gross Margin (2021–2026)
7.4.4 Mark Andy Wine Label Printers Product Offerings
7.4.5 Mark Andy Recent Developments
7.5 Bobst
7.5.1 Bobst Company Information
7.5.2 Bobst Introduction and Business Overview
7.5.3 Bobst Wine Label Printers Sales, Revenue, Price and Gross Margin (2021–2026)
7.5.4 Bobst Wine Label Printers Product Offerings
7.5.5 Bobst Recent Developments
7.6 Konica Minolta
7.6.1 Konica Minolta Company Information
7.6.2 Konica Minolta Introduction and Business Overview
7.6.3 Konica Minolta Wine Label Printers Sales, Revenue, Price and Gross Margin (2021–2026)
7.6.4 Konica Minolta Wine Label Printers Product Offerings
7.6.5 Konica Minolta Recent Developments
7.7 Epson
7.7.1 Epson Company Information
7.7.2 Epson Introduction and Business Overview
7.7.3 Epson Wine Label Printers Sales, Revenue, Price and Gross Margin (2021–2026)
7.7.4 Epson Wine Label Printers Product Offerings
7.7.5 Epson Recent Developments
7.8 Durst Group
7.8.1 Durst Group Company Information
7.8.2 Durst Group Introduction and Business Overview
7.8.3 Durst Group Wine Label Printers Sales, Revenue, Price and Gross Margin (2021–2026)
7.8.4 Durst Group Wine Label Printers Product Offerings
7.8.5 Durst Group Recent Developments
7.9 Screen Graphic Solutions
7.9.1 Screen Graphic Solutions Company Information
7.9.2 Screen Graphic Solutions Introduction and Business Overview
7.9.3 Screen Graphic Solutions Wine Label Printers Sales, Revenue, Price and Gross Margin (2021–2026)
7.9.4 Screen Graphic Solutions Wine Label Printers Product Offerings
7.9.5 Screen Graphic Solutions Recent Developments
7.10 Domino Printing
7.10.1 Domino Printing Company Information
7.10.2 Domino Printing Introduction and Business Overview
7.10.3 Domino Printing Wine Label Printers Sales, Revenue, Price and Gross Margin (2021–2026)
7.10.4 Domino Printing Wine Label Printers Product Offerings
7.10.5 Domino Printing Recent Developments
7.11 Nilpeter
7.11.1 Nilpeter Company Information
7.11.2 Nilpeter Introduction and Business Overview
7.11.3 Nilpeter Wine Label Printers Sales, Revenue, Price and Gross Margin (2021–2026)
7.11.4 Nilpeter Wine Label Printers Product Offerings
7.11.5 Nilpeter Recent Developments
7.12 Omet
7.12.1 Omet Company Information
7.12.2 Omet Introduction and Business Overview
7.12.3 Omet Wine Label Printers Sales, Revenue, Price and Gross Margin (2021–2026)
7.12.4 Omet Wine Label Printers Product Offerings
7.12.5 Omet Recent Developments
7.13 Lombardi Converting Machinery
7.13.1 Lombardi Converting Machinery Company Information
7.13.2 Lombardi Converting Machinery Introduction and Business Overview
7.13.3 Lombardi Converting Machinery Wine Label Printers Sales, Revenue, Price and Gross Margin (2021–2026)
7.13.4 Lombardi Converting Machinery Wine Label Printers Product Offerings
7.13.5 Lombardi Converting Machinery Recent Developments
7.14 Sublistar
7.14.1 Sublistar Company Information
7.14.2 Sublistar Introduction and Business Overview
7.14.3 Sublistar Wine Label Printers Sales, Revenue, Price and Gross Margin (2021–2026)
7.14.4 Sublistar Wine Label Printers Product Offerings
7.14.5 Sublistar Recent Developments
7.15 AstroNova QuickLabel
7.15.1 AstroNova QuickLabel Company Information
7.15.2 AstroNova QuickLabel Introduction and Business Overview
7.15.3 AstroNova QuickLabel Wine Label Printers Sales, Revenue, Price and Gross Margin (2021–2026)
7.15.4 AstroNova QuickLabel Wine Label Printers Product Offerings
7.15.5 AstroNova QuickLabel Recent Developments
8 Industry Chain Analysis
8.1 Wine Label Printers Industrial Chain
8.2 Wine Label Printers Upstream Analysis
8.2.1 Key Raw Materials
8.2.2 Key Suppliers of Raw Materials
8.2.3 Manufacturing Cost Structure
8.3 Midstream Analysis
8.4 Downstream Analysis (Customer Analysis)
8.5 Sales Model and Sales Channelss
8.5.1 Wine Label Printers Sales Model
8.5.2 Sales Channels
8.5.3 Wine Label Printers Distributors
9 Research Findings and Conclusion
10 Appendix
10.1 Research Methodology
10.1.1 Methodology/Research Approach
10.1.1.1 Research Programs/Design
10.1.1.2 Market Size Estimation
10.1.1.3 Market Breakdown and Data Triangulation
10.1.2 Data Source
10.1.2.1 Secondary Sources
10.1.2.2 Primary Sources
10.2 Author Details
10.3 Disclaimer