
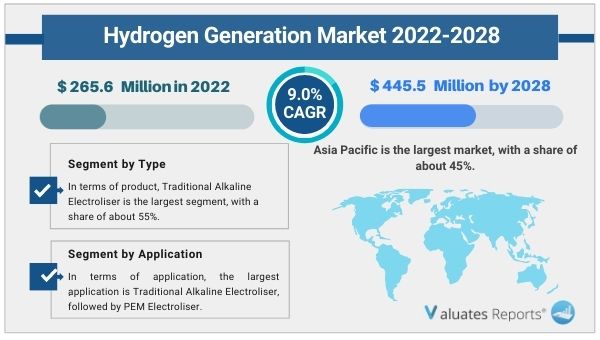
Due to the COVID-19 pandemic, the global Hydrogen Generation market size is estimated to be worth US$ 265.6 million in 2022 and is forecast to a readjusted size of US$ 445.5 million by 2028 with a CAGR of 9.0% during the review period.
The hydrogen generation market will expand as a result of growing government desulphurization activities and the increased focus on hydrogen generation for fuel cell electricity. Due to its great energy efficiency, hydrogen is finding more and more uses, which will fuel market expansion throughout the projection period.
Energy-wise, 6.2 pounds (2.8 kilogrammes) of regular gasoline has the same amount of energy as 2.2 pounds (or 1 kilogramme) of hydrogen gas. Two to three times as efficient as conventional combustion methods are hydrogen fuel cells. They mix hydrogen and oxygen to produce clean exhaust that is merely water. Electric drive motors and temporary batteries are powered by the converted electrical energy from the chemical energy that has been stored. The fuel is easily transportable, readily available, and quickly refuelable, so lengthy charging times are avoided. The market for hydrogen generation will rise as a result. It is a byproduct of electrolysis that is produced utilising the energy of renewable resources and is very effective.
In order to decarbonize an increasing number of industries, including transportation, chemicals, and iron and steel manufacturing, numerous nations and government agencies throughout the world are ramping up their investments in hydrogen technologies. This will accelerate the market for hydrogen generation in the ensuing years. To stop air pollution, regulatory authorities have severe desulphurization requirements. When it comes to cleaning up industrial fuels of impurities like sulphur, hydrogen is a highly effective clean energy source.
For the creation of methane, ammonia, and hydrogen, hydrogen is produced. Grid stabilisation, hydrocracking for petroleum products, and cooling power plant generators are among more industrial uses. This will accelerate the market for hydrogen generation during the next years. It is possible to store the electrical energy generated by electrolysis for use in transportation.
An large network of pipelines must be constructed up with industrial-sized subterranean pipes and filling stations. It takes a long time to transport, store, and supply hydrogen because of its peculiar volumetric density, which complicates the design of compressors and pipeline materials. It requires a specific pressure and temperature range in order to liquefy. The gas is also exceedingly explosive and combustible. It poses problems for safety and identification because it is essentially invisible to the unaided eye.
Based on type, Compared to alternative manufacturing techniques, the classic alkaline electrolyzer has the biggest market share (55%), operating with inexpensive catalysts, separators, and transport layers. The gas purity is great, and the durability is higher.
Based on region, With a market share of over 45%, Asia-Pacific is anticipated to experience significant expansion. This is brought about by the quick growth of investments in hydrogen fuel cells and the trend toward green technology for cutting carbon emissions. With a combined share of 45%, Europe and the Americas are the second-largest region.
The authors of this research report have explored the key segments: Type and Application. The report offers an in-depth breakdown of type and application segments and their sub-segments. The lucrativeness and growth potential have been looked into by the industry experts in this report. This section of the report also provides sales and revenue forecast data by type and application segments based on sales, price, and revenue for the period 2017-2028. The specialists, to broaden the understanding of the users, have done value chain and raw material analysis in this section.
The authors of this study have enlightened the readers on the rise and effect of the Covid-19 outbreak on the development. They have investigated the changes brought about in the demand/supply side, consumption, supply chain, and production/manufacturing. The readers will get familiar with the measures that have helped the key players to bring the Hydrogen Generation market back to the pre-covid levels.
In this section of the report, the researchers have done a comprehensive analysis of the prominent players operating and the strategies they are focusing on to combat the intense competition. Company profiles and share analysis of the prominent players are also provided in this section. They have also provided reliable sales and revenue data of the manufacturers for the period 2017-2022. With the assistance of this report, key players, stakeholders, and other participants will be able to stay abreast of the recent and upcoming developments in the business, further enabling them to make efficient choices.
|
Report Metric |
Details |
|
Report Name |
Hydrogen Generation Market |
|
The market size in 2022 |
USD 265.6 Million |
|
The revenue forecast in 2028 |
USD 445.5 Million |
|
Growth Rate |
Compound Annual Growth Rate (CAGR) of 9.0% from 2022 to 2028 |
|
Market size available for years |
2022-2028 |
|
Forecast units |
Value (USD) |
|
Segments covered |
By Type, Application, and Region |
|
Report coverage |
Revenue & volume forecast, company share, competitive landscape, growth factors, and trends |
|
Geographic regions covered |
North America, Europe, Asia Pacific, Latin America, Middle East & Africa |
Ans. The global Hydrogen Generation market size is estimated to be worth US$ 265.6 million in 2022 and is forecast to a readjusted size of US$ 445.5 million by 2028.
Ans. The global Hydrogen Generation market is expected to grow at a compound annual growth rate of 9.0% from 2022 to 2028.
Ans. Some of the major companies are Proton On-Site, 718th Research Institute of CSIC, Teledyne Energy Systems, Hydrogenics, Nel Hydrogen, Suzhou Jingli, Beijing Zhongdian, McPhy, Siemens, TianJin Mainland, Areva H2gen, Shandong Saksay Hydrogen Energy, Yangzhou Chungdean Hydrogen Equipment, Asahi Kasei, Idroenergy Spa,Erredue SpA, ShaanXi HuaQin, Kobelco Eco-Solutions, ELB Elektrolysetechnik GmbH,ITM Power, Toshiba.
Table of Contents
1 Study Coverage
1.1 Hydrogen Generation Product Introduction
1.2 Market by Type
1.2.1 Global Hydrogen Generation Market Size by Type, 2017 VS 2021 VS 2028
1.2.2 Traditional Alkaline Electroliser
1.2.3 PEM Electroliser
1.3 Market by Application
1.3.1 Global Hydrogen Generation Market Size by Application, 2017 VS 2021 VS 2028
1.3.2 Power Plants
1.3.3 Steel Plant
1.3.4 Electronics and Photovoltaics
1.3.5 Industrial Gases
1.3.6 Energy Storage or Fueling for FCEV's
1.3.7 Power to Gas
1.3.8 Others
1.4 Study Objectives
1.5 Years Considered
2 Global Hydrogen Generation Production
2.1 Global Hydrogen Generation Production Capacity (2017-2028)
2.2 Global Hydrogen Generation Production by Region: 2017 VS 2021 VS 2028
2.3 Global Hydrogen Generation Production by Region
2.3.1 Global Hydrogen Generation Historic Production by Region (2017-2022)
2.3.2 Global Hydrogen Generation Forecasted Production by Region (2023-2028)
2.4 North America
2.5 Europe
2.6 China
2.7 Japan
3 Global Hydrogen Generation Sales in Volume & Value Estimates and Forecasts
3.1 Global Hydrogen Generation Sales Estimates and Forecasts 2017-2028
3.2 Global Hydrogen Generation Revenue Estimates and Forecasts 2017-2028
3.3 Global Hydrogen Generation Revenue by Region: 2017 VS 2021 VS 2028
3.4 Global Hydrogen Generation Sales by Region
3.4.1 Global Hydrogen Generation Sales by Region (2017-2022)
3.4.2 Global Sales Hydrogen Generation by Region (2023-2028)
3.5 Global Hydrogen Generation Revenue by Region
3.5.1 Global Hydrogen Generation Revenue by Region (2017-2022)
3.5.2 Global Hydrogen Generation Revenue by Region (2023-2028)
3.6 North America
3.7 Europe
3.8 Asia-Pacific
3.9 Latin America
3.10 Middle East & Africa
4 Competition by Manufactures
4.1 Global Hydrogen Generation Production Capacity by Manufacturers
4.2 Global Hydrogen Generation Sales by Manufacturers
4.2.1 Global Hydrogen Generation Sales by Manufacturers (2017-2022)
4.2.2 Global Hydrogen Generation Sales Market Share by Manufacturers (2017-2022)
4.2.3 Global Top 10 and Top 5 Largest Manufacturers of Hydrogen Generation in 2021
4.3 Global Hydrogen Generation Revenue by Manufacturers
4.3.1 Global Hydrogen Generation Revenue by Manufacturers (2017-2022)
4.3.2 Global Hydrogen Generation Revenue Market Share by Manufacturers (2017-2022)
4.3.3 Global Top 10 and Top 5 Companies by Hydrogen Generation Revenue in 2021
4.4 Global Hydrogen Generation Sales Price by Manufacturers
4.5 Analysis of Competitive Landscape
4.5.1 Manufacturers Market Concentration Ratio (CR5 and HHI)
4.5.2 Global Hydrogen Generation Market Share by Company Type (Tier 1, Tier 2, and Tier 3)
4.5.3 Global Hydrogen Generation Manufacturers Geographical Distribution
4.6 Mergers & Acquisitions, Expansion Plans
5 Market Size by Type
5.1 Global Hydrogen Generation Sales by Type
5.1.1 Global Hydrogen Generation Historical Sales by Type (2017-2022)
5.1.2 Global Hydrogen Generation Forecasted Sales by Type (2023-2028)
5.1.3 Global Hydrogen Generation Sales Market Share by Type (2017-2028)
5.2 Global Hydrogen Generation Revenue by Type
5.2.1 Global Hydrogen Generation Historical Revenue by Type (2017-2022)
5.2.2 Global Hydrogen Generation Forecasted Revenue by Type (2023-2028)
5.2.3 Global Hydrogen Generation Revenue Market Share by Type (2017-2028)
5.3 Global Hydrogen Generation Price by Type
5.3.1 Global Hydrogen Generation Price by Type (2017-2022)
5.3.2 Global Hydrogen Generation Price Forecast by Type (2023-2028)
6 Market Size by Application
6.1 Global Hydrogen Generation Sales by Application
6.1.1 Global Hydrogen Generation Historical Sales by Application (2017-2022)
6.1.2 Global Hydrogen Generation Forecasted Sales by Application (2023-2028)
6.1.3 Global Hydrogen Generation Sales Market Share by Application (2017-2028)
6.2 Global Hydrogen Generation Revenue by Application
6.2.1 Global Hydrogen Generation Historical Revenue by Application (2017-2022)
6.2.2 Global Hydrogen Generation Forecasted Revenue by Application (2023-2028)
6.2.3 Global Hydrogen Generation Revenue Market Share by Application (2017-2028)
6.3 Global Hydrogen Generation Price by Application
6.3.1 Global Hydrogen Generation Price by Application (2017-2022)
6.3.2 Global Hydrogen Generation Price Forecast by Application (2023-2028)
7 North America
7.1 North America Hydrogen Generation Market Size by Type
7.1.1 North America Hydrogen Generation Sales by Type (2017-2028)
7.1.2 North America Hydrogen Generation Revenue by Type (2017-2028)
7.2 North America Hydrogen Generation Market Size by Application
7.2.1 North America Hydrogen Generation Sales by Application (2017-2028)
7.2.2 North America Hydrogen Generation Revenue by Application (2017-2028)
7.3 North America Hydrogen Generation Sales by Country
7.3.1 North America Hydrogen Generation Sales by Country (2017-2028)
7.3.2 North America Hydrogen Generation Revenue by Country (2017-2028)
7.3.3 U.S.
7.3.4 Canada
8 Europe
8.1 Europe Hydrogen Generation Market Size by Type
8.1.1 Europe Hydrogen Generation Sales by Type (2017-2028)
8.1.2 Europe Hydrogen Generation Revenue by Type (2017-2028)
8.2 Europe Hydrogen Generation Market Size by Application
8.2.1 Europe Hydrogen Generation Sales by Application (2017-2028)
8.2.2 Europe Hydrogen Generation Revenue by Application (2017-2028)
8.3 Europe Hydrogen Generation Sales by Country
8.3.1 Europe Hydrogen Generation Sales by Country (2017-2028)
8.3.2 Europe Hydrogen Generation Revenue by Country (2017-2028)
8.3.3 Germany
8.3.4 France
8.3.5 U.K.
8.3.6 Italy
8.3.7 Russia
9 Asia Pacific
9.1 Asia Pacific Hydrogen Generation Market Size by Type
9.1.1 Asia Pacific Hydrogen Generation Sales by Type (2017-2028)
9.1.2 Asia Pacific Hydrogen Generation Revenue by Type (2017-2028)
9.2 Asia Pacific Hydrogen Generation Market Size by Application
9.2.1 Asia Pacific Hydrogen Generation Sales by Application (2017-2028)
9.2.2 Asia Pacific Hydrogen Generation Revenue by Application (2017-2028)
9.3 Asia Pacific Hydrogen Generation Sales by Region
9.3.1 Asia Pacific Hydrogen Generation Sales by Region (2017-2028)
9.3.2 Asia Pacific Hydrogen Generation Revenue by Region (2017-2028)
9.3.3 China
9.3.4 Japan
9.3.5 South Korea
9.3.6 India
9.3.7 Australia
9.3.8 Taiwan
9.3.9 Indonesia
9.3.10 Thailand
9.3.11 Malaysia
9.3.12 Philippines
10 Latin America
10.1 Latin America Hydrogen Generation Market Size by Type
10.1.1 Latin America Hydrogen Generation Sales by Type (2017-2028)
10.1.2 Latin America Hydrogen Generation Revenue by Type (2017-2028)
10.2 Latin America Hydrogen Generation Market Size by Application
10.2.1 Latin America Hydrogen Generation Sales by Application (2017-2028)
10.2.2 Latin America Hydrogen Generation Revenue by Application (2017-2028)
10.3 Latin America Hydrogen Generation Sales by Country
10.3.1 Latin America Hydrogen Generation Sales by Country (2017-2028)
10.3.2 Latin America Hydrogen Generation Revenue by Country (2017-2028)
10.3.3 Mexico
10.3.4 Brazil
10.3.5 Argentina
11 Middle East and Africa
11.1 Middle East and Africa Hydrogen Generation Market Size by Type
11.1.1 Middle East and Africa Hydrogen Generation Sales by Type (2017-2028)
11.1.2 Middle East and Africa Hydrogen Generation Revenue by Type (2017-2028)
11.2 Middle East and Africa Hydrogen Generation Market Size by Application
11.2.1 Middle East and Africa Hydrogen Generation Sales by Application (2017-2028)
11.2.2 Middle East and Africa Hydrogen Generation Revenue by Application (2017-2028)
11.3 Middle East and Africa Hydrogen Generation Sales by Country
11.3.1 Middle East and Africa Hydrogen Generation Sales by Country (2017-2028)
11.3.2 Middle East and Africa Hydrogen Generation Revenue by Country (2017-2028)
11.3.3 Turkey
11.3.4 Saudi Arabia
11.3.5 U.A.E
12 Corporate Profiles
12.1 Proton On-Site
12.1.1 Proton On-Site Corporation Information
12.1.2 Proton On-Site Overview
12.1.3 Proton On-Site Hydrogen Generation Sales, Price, Revenue and Gross Margin (2017-2022)
12.1.4 Proton On-Site Hydrogen Generation Product Model Numbers, Pictures, Descriptions and Specifications
12.1.5 Proton On-Site Recent Developments
12.2 718th Research Institute of CSIC
12.2.1 718th Research Institute of CSIC Corporation Information
12.2.2 718th Research Institute of CSIC Overview
12.2.3 718th Research Institute of CSIC Hydrogen Generation Sales, Price, Revenue and Gross Margin (2017-2022)
12.2.4 718th Research Institute of CSIC Hydrogen Generation Product Model Numbers, Pictures, Descriptions and Specifications
12.2.5 718th Research Institute of CSIC Recent Developments
12.3 Teledyne Energy Systems
12.3.1 Teledyne Energy Systems Corporation Information
12.3.2 Teledyne Energy Systems Overview
12.3.3 Teledyne Energy Systems Hydrogen Generation Sales, Price, Revenue and Gross Margin (2017-2022)
12.3.4 Teledyne Energy Systems Hydrogen Generation Product Model Numbers, Pictures, Descriptions and Specifications
12.3.5 Teledyne Energy Systems Recent Developments
12.4 Hydrogenics
12.4.1 Hydrogenics Corporation Information
12.4.2 Hydrogenics Overview
12.4.3 Hydrogenics Hydrogen Generation Sales, Price, Revenue and Gross Margin (2017-2022)
12.4.4 Hydrogenics Hydrogen Generation Product Model Numbers, Pictures, Descriptions and Specifications
12.4.5 Hydrogenics Recent Developments
12.5 Nel Hydrogen
12.5.1 Nel Hydrogen Corporation Information
12.5.2 Nel Hydrogen Overview
12.5.3 Nel Hydrogen Hydrogen Generation Sales, Price, Revenue and Gross Margin (2017-2022)
12.5.4 Nel Hydrogen Hydrogen Generation Product Model Numbers, Pictures, Descriptions and Specifications
12.5.5 Nel Hydrogen Recent Developments
12.6 Suzhou Jingli
12.6.1 Suzhou Jingli Corporation Information
12.6.2 Suzhou Jingli Overview
12.6.3 Suzhou Jingli Hydrogen Generation Sales, Price, Revenue and Gross Margin (2017-2022)
12.6.4 Suzhou Jingli Hydrogen Generation Product Model Numbers, Pictures, Descriptions and Specifications
12.6.5 Suzhou Jingli Recent Developments
12.7 Beijing Zhongdian
12.7.1 Beijing Zhongdian Corporation Information
12.7.2 Beijing Zhongdian Overview
12.7.3 Beijing Zhongdian Hydrogen Generation Sales, Price, Revenue and Gross Margin (2017-2022)
12.7.4 Beijing Zhongdian Hydrogen Generation Product Model Numbers, Pictures, Descriptions and Specifications
12.7.5 Beijing Zhongdian Recent Developments
12.8 McPhy
12.8.1 McPhy Corporation Information
12.8.2 McPhy Overview
12.8.3 McPhy Hydrogen Generation Sales, Price, Revenue and Gross Margin (2017-2022)
12.8.4 McPhy Hydrogen Generation Product Model Numbers, Pictures, Descriptions and Specifications
12.8.5 McPhy Recent Developments
12.9 Siemens
12.9.1 Siemens Corporation Information
12.9.2 Siemens Overview
12.9.3 Siemens Hydrogen Generation Sales, Price, Revenue and Gross Margin (2017-2022)
12.9.4 Siemens Hydrogen Generation Product Model Numbers, Pictures, Descriptions and Specifications
12.9.5 Siemens Recent Developments
12.10 TianJin Mainland
12.10.1 TianJin Mainland Corporation Information
12.10.2 TianJin Mainland Overview
12.10.3 TianJin Mainland Hydrogen Generation Sales, Price, Revenue and Gross Margin (2017-2022)
12.10.4 TianJin Mainland Hydrogen Generation Product Model Numbers, Pictures, Descriptions and Specifications
12.10.5 TianJin Mainland Recent Developments
12.11 Areva H2gen
12.11.1 Areva H2gen Corporation Information
12.11.2 Areva H2gen Overview
12.11.3 Areva H2gen Hydrogen Generation Sales, Price, Revenue and Gross Margin (2017-2022)
12.11.4 Areva H2gen Hydrogen Generation Product Model Numbers, Pictures, Descriptions and Specifications
12.11.5 Areva H2gen Recent Developments
12.12 Shandong Saksay Hydrogen Energy
12.12.1 Shandong Saksay Hydrogen Energy Corporation Information
12.12.2 Shandong Saksay Hydrogen Energy Overview
12.12.3 Shandong Saksay Hydrogen Energy Hydrogen Generation Sales, Price, Revenue and Gross Margin (2017-2022)
12.12.4 Shandong Saksay Hydrogen Energy Hydrogen Generation Product Model Numbers, Pictures, Descriptions and Specifications
12.12.5 Shandong Saksay Hydrogen Energy Recent Developments
12.13 Yangzhou Chungdean Hydrogen Equipment
12.13.1 Yangzhou Chungdean Hydrogen Equipment Corporation Information
12.13.2 Yangzhou Chungdean Hydrogen Equipment Overview
12.13.3 Yangzhou Chungdean Hydrogen Equipment Hydrogen Generation Sales, Price, Revenue and Gross Margin (2017-2022)
12.13.4 Yangzhou Chungdean Hydrogen Equipment Hydrogen Generation Product Model Numbers, Pictures, Descriptions and Specifications
12.13.5 Yangzhou Chungdean Hydrogen Equipment Recent Developments
12.14 Asahi Kasei
12.14.1 Asahi Kasei Corporation Information
12.14.2 Asahi Kasei Overview
12.14.3 Asahi Kasei Hydrogen Generation Sales, Price, Revenue and Gross Margin (2017-2022)
12.14.4 Asahi Kasei Hydrogen Generation Product Model Numbers, Pictures, Descriptions and Specifications
12.14.5 Asahi Kasei Recent Developments
12.15 Idroenergy Spa
12.15.1 Idroenergy Spa Corporation Information
12.15.2 Idroenergy Spa Overview
12.15.3 Idroenergy Spa Hydrogen Generation Sales, Price, Revenue and Gross Margin (2017-2022)
12.15.4 Idroenergy Spa Hydrogen Generation Product Model Numbers, Pictures, Descriptions and Specifications
12.15.5 Idroenergy Spa Recent Developments
12.16 Erredue SpA
12.16.1 Erredue SpA Corporation Information
12.16.2 Erredue SpA Overview
12.16.3 Erredue SpA Hydrogen Generation Sales, Price, Revenue and Gross Margin (2017-2022)
12.16.4 Erredue SpA Hydrogen Generation Product Model Numbers, Pictures, Descriptions and Specifications
12.16.5 Erredue SpA Recent Developments
12.17 ShaanXi HuaQin
12.17.1 ShaanXi HuaQin Corporation Information
12.17.2 ShaanXi HuaQin Overview
12.17.3 ShaanXi HuaQin Hydrogen Generation Sales, Price, Revenue and Gross Margin (2017-2022)
12.17.4 ShaanXi HuaQin Hydrogen Generation Product Model Numbers, Pictures, Descriptions and Specifications
12.17.5 ShaanXi HuaQin Recent Developments
12.18 Kobelco Eco-Solutions
12.18.1 Kobelco Eco-Solutions Corporation Information
12.18.2 Kobelco Eco-Solutions Overview
12.18.3 Kobelco Eco-Solutions Hydrogen Generation Sales, Price, Revenue and Gross Margin (2017-2022)
12.18.4 Kobelco Eco-Solutions Hydrogen Generation Product Model Numbers, Pictures, Descriptions and Specifications
12.18.5 Kobelco Eco-Solutions Recent Developments
12.19 ELB Elektrolysetechnik GmbH
12.19.1 ELB Elektrolysetechnik GmbH Corporation Information
12.19.2 ELB Elektrolysetechnik GmbH Overview
12.19.3 ELB Elektrolysetechnik GmbH Hydrogen Generation Sales, Price, Revenue and Gross Margin (2017-2022)
12.19.4 ELB Elektrolysetechnik GmbH Hydrogen Generation Product Model Numbers, Pictures, Descriptions and Specifications
12.19.5 ELB Elektrolysetechnik GmbH Recent Developments
12.20 ITM Power
12.20.1 ITM Power Corporation Information
12.20.2 ITM Power Overview
12.20.3 ITM Power Hydrogen Generation Sales, Price, Revenue and Gross Margin (2017-2022)
12.20.4 ITM Power Hydrogen Generation Product Model Numbers, Pictures, Descriptions and Specifications
12.20.5 ITM Power Recent Developments
12.21 Toshiba
12.21.1 Toshiba Corporation Information
12.21.2 Toshiba Overview
12.21.3 Toshiba Hydrogen Generation Sales, Price, Revenue and Gross Margin (2017-2022)
12.21.4 Toshiba Hydrogen Generation Product Model Numbers, Pictures, Descriptions and Specifications
12.21.5 Toshiba Recent Developments
13 Industry Chain and Sales Channels Analysis
13.1 Hydrogen Generation Industry Chain Analysis
13.2 Hydrogen Generation Key Raw Materials
13.2.1 Key Raw Materials
13.2.2 Raw Materials Key Suppliers
13.3 Hydrogen Generation Production Mode & Process
13.4 Hydrogen Generation Sales and Marketing
13.4.1 Hydrogen Generation Sales Channels
13.4.2 Hydrogen Generation Distributors
13.5 Hydrogen Generation Customers
14 Market Drivers, Opportunities, Challenges, and Risks Factors Analysis
14.1 Hydrogen Generation Industry Trends
14.2 Hydrogen Generation Market Drivers
14.3 Hydrogen Generation Market Challenges
14.4 Hydrogen Generation Market Restraints
15 Key Finding in The Global Hydrogen Generation Study
16 Appendix
16.1 Research Methodology
16.1.1 Methodology/Research Approach
16.1.2 Data Source
16.2 Author Details
16.3 Disclaimer
List of Tables
Table 1. Global Hydrogen Generation Market Size Growth Rate by Type, 2017 VS 2021 VS 2028 (US$ Million)
Table 2. Major Manufacturers of Traditional Alkaline Electroliser
Table 3. Major Manufacturers of PEM Electroliser
Table 4. Global Hydrogen Generation Market Size Growth Rate by Application, 2017 VS 2021 2028 (US$ Million)
Table 5. Global Hydrogen Generation Production by Region: 2017 VS 2021 VS 2028 (Units)
Table 6. Global Hydrogen Generation Production by Region (2017-2022) & (Units)
Table 7. Global Hydrogen Generation Production Market Share by Region (2017-2022)
Table 8. Global Hydrogen Generation Production by Region (2023-2028) & (Units)
Table 9. Global Hydrogen Generation Production Market Share by Region (2023-2028)
Table 10. Global Hydrogen Generation Revenue by Region: 2017 VS 2021 VS 2028 (US$ Million)
Table 11. Global Hydrogen Generation Sales by Region (2017-2022) & (Units)
Table 12. Global Hydrogen Generation Sales Market Share by Region (2017-2022)
Table 13. Global Hydrogen Generation Sales by Region (2023-2028) & (Units)
Table 14. Global Hydrogen Generation Sales Market Share by Region (2023-2028)
Table 15. Global Hydrogen Generation Revenue by Region (2017-2022) & (US$ Million)
Table 16. Global Hydrogen Generation Revenue Market Share by Region (2017-2022)
Table 17. Global Hydrogen Generation Revenue by Region (2023-2028) & (US$ Million)
Table 18. Global Hydrogen Generation Revenue Market Share by Region (2023-2028)
Table 19. Global Hydrogen Generation Production Capacity by Manufacturers (2017-2022) & (Units)
Table 20. Global Hydrogen Generation Capacity Market Share by Manufacturers (2017-2022)
Table 21. Global Hydrogen Generation Sales by Manufacturers (2017-2022) & (Units)
Table 22. Global Hydrogen Generation Sales Market Share by Manufacturers (2017-2022)
Table 23. Global Hydrogen Generation Revenue by Manufacturers (2017-2022) & (US$ Million)
Table 24. Global Hydrogen Generation Revenue Share by Manufacturers (2017-2022)
Table 25. Hydrogen Generation Price by Manufacturers 2017-2022 (K USD/Unit)
Table 26. Global Hydrogen Generation Manufacturers Market Concentration Ratio (CR5 and HHI)
Table 27. Global Hydrogen Generation by Company Type (Tier 1, Tier 2, and Tier 3) & (based on the Revenue in Hydrogen Generation as of 2021)
Table 28. Hydrogen Generation Manufacturing Base Distribution and Headquarters
Table 29. Manufacturers Hydrogen Generation Product Offered
Table 30. Date of Manufacturers Enter into Hydrogen Generation Market
Table 31. Mergers & Acquisitions, Expansion Plans
Table 32. Global Hydrogen Generation Sales by Type (2017-2022) & (Units)
Table 33. Global Hydrogen Generation Sales by Type (2023-2028) & (Units)
Table 34. Global Hydrogen Generation Sales Share by Type (2017-2022)
Table 35. Global Hydrogen Generation Sales Share by Type (2023-2028)
Table 36. Global Hydrogen Generation Revenue by Type (2017-2022) & (US$ Million)
Table 37. Global Hydrogen Generation Revenue by Type (2023-2028) & (US$ Million)
Table 38. Global Hydrogen Generation Revenue Share by Type (2017-2022)
Table 39. Global Hydrogen Generation Revenue Share by Type (2023-2028)
Table 40. Hydrogen Generation Price by Type (2017-2022) & (K USD/Unit)
Table 41. Global Hydrogen Generation Price Forecast by Type (2023-2028) & (K USD/Unit)
Table 42. Global Hydrogen Generation Sales by Application (2017-2022) & (Units)
Table 43. Global Hydrogen Generation Sales by Application (2023-2028) & (Units)
Table 44. Global Hydrogen Generation Sales Share by Application (2017-2022)
Table 45. Global Hydrogen Generation Sales Share by Application (2023-2028)
Table 46. Global Hydrogen Generation Revenue by Application (2017-2022) & (US$ Million)
Table 47. Global Hydrogen Generation Revenue by Application (2023-2028) & (US$ Million)
Table 48. Global Hydrogen Generation Revenue Share by Application (2017-2022)
Table 49. Global Hydrogen Generation Revenue Share by Application (2023-2028)
Table 50. Hydrogen Generation Price by Application (2017-2022) & (K USD/Unit)
Table 51. Global Hydrogen Generation Price Forecast by Application (2023-2028) & (K USD/Unit)
Table 52. North America Hydrogen Generation Sales by Type (2017-2022) & (Units)
Table 53. North America Hydrogen Generation Sales by Type (2023-2028) & (Units)
Table 54. North America Hydrogen Generation Revenue by Type (2017-2022) & (US$ Million)
Table 55. North America Hydrogen Generation Revenue by Type (2023-2028) & (US$ Million)
Table 56. North America Hydrogen Generation Sales by Application (2017-2022) & (Units)
Table 57. North America Hydrogen Generation Sales by Application (2023-2028) & (Units)
Table 58. North America Hydrogen Generation Revenue by Application (2017-2022) & (US$ Million)
Table 59. North America Hydrogen Generation Revenue by Application (2023-2028) & (US$ Million)
Table 60. North America Hydrogen Generation Sales by Country (2017-2022) & (Units)
Table 61. North America Hydrogen Generation Sales by Country (2023-2028) & (Units)
Table 62. North America Hydrogen Generation Revenue by Country (2017-2022) & (US$ Million)
Table 63. North America Hydrogen Generation Revenue by Country (2023-2028) & (US$ Million)
Table 64. Europe Hydrogen Generation Sales by Type (2017-2022) & (Units)
Table 65. Europe Hydrogen Generation Sales by Type (2023-2028) & (Units)
Table 66. Europe Hydrogen Generation Revenue by Type (2017-2022) & (US$ Million)
Table 67. Europe Hydrogen Generation Revenue by Type (2023-2028) & (US$ Million)
Table 68. Europe Hydrogen Generation Sales by Application (2017-2022) & (Units)
Table 69. Europe Hydrogen Generation Sales by Application (2023-2028) & (Units)
Table 70. Europe Hydrogen Generation Revenue by Application (2017-2022) & (US$ Million)
Table 71. Europe Hydrogen Generation Revenue by Application (2023-2028) & (US$ Million)
Table 72. Europe Hydrogen Generation Sales by Country (2017-2022) & (Units)
Table 73. Europe Hydrogen Generation Sales by Country (2023-2028) & (Units)
Table 74. Europe Hydrogen Generation Revenue by Country (2017-2022) & (US$ Million)
Table 75. Europe Hydrogen Generation Revenue by Country (2023-2028) & (US$ Million)
Table 76. Asia Pacific Hydrogen Generation Sales by Type (2017-2022) & (Units)
Table 77. Asia Pacific Hydrogen Generation Sales by Type (2023-2028) & (Units)
Table 78. Asia Pacific Hydrogen Generation Revenue by Type (2017-2022) & (US$ Million)
Table 79. Asia Pacific Hydrogen Generation Revenue by Type (2023-2028) & (US$ Million)
Table 80. Asia Pacific Hydrogen Generation Sales by Application (2017-2022) & (Units)
Table 81. Asia Pacific Hydrogen Generation Sales by Application (2023-2028) & (Units)
Table 82. Asia Pacific Hydrogen Generation Revenue by Application (2017-2022) & (US$ Million)
Table 83. Asia Pacific Hydrogen Generation Revenue by Application (2023-2028) & (US$ Million)
Table 84. Asia Pacific Hydrogen Generation Sales by Region (2017-2022) & (Units)
Table 85. Asia Pacific Hydrogen Generation Sales by Region (2023-2028) & (Units)
Table 86. Asia Pacific Hydrogen Generation Revenue by Region (2017-2022) & (US$ Million)
Table 87. Asia Pacific Hydrogen Generation Revenue by Region (2023-2028) & (US$ Million)
Table 88. Latin America Hydrogen Generation Sales by Type (2017-2022) & (Units)
Table 89. Latin America Hydrogen Generation Sales by Type (2023-2028) & (Units)
Table 90. Latin America Hydrogen Generation Revenue by Type (2017-2022) & (US$ Million)
Table 91. Latin America Hydrogen Generation Revenue by Type (2023-2028) & (US$ Million)
Table 92. Latin America Hydrogen Generation Sales by Application (2017-2022) & (Units)
Table 93. Latin America Hydrogen Generation Sales by Application (2023-2028) & (Units)
Table 94. Latin America Hydrogen Generation Revenue by Application (2017-2022) & (US$ Million)
Table 95. Latin America Hydrogen Generation Revenue by Application (2023-2028) & (US$ Million)
Table 96. Latin America Hydrogen Generation Sales by Country (2017-2022) & (Units)
Table 97. Latin America Hydrogen Generation Sales by Country (2023-2028) & (Units)
Table 98. Latin America Hydrogen Generation Revenue by Country (2017-2022) & (US$ Million)
Table 99. Latin America Hydrogen Generation Revenue by Country (2023-2028) & (US$ Million)
Table 100. Middle East and Africa Hydrogen Generation Sales by Type (2017-2022) & (Units)
Table 101. Middle East and Africa Hydrogen Generation Sales by Type (2023-2028) & (Units)
Table 102. Middle East and Africa Hydrogen Generation Revenue by Type (2017-2022) & (US$ Million)
Table 103. Middle East and Africa Hydrogen Generation Revenue by Type (2023-2028) & (US$ Million)
Table 104. Middle East and Africa Hydrogen Generation Sales by Application (2017-2022) & (Units)
Table 105. Middle East and Africa Hydrogen Generation Sales by Application (2023-2028) & (Units)
Table 106. Middle East and Africa Hydrogen Generation Revenue by Application (2017-2022) & (US$ Million)
Table 107. Middle East and Africa Hydrogen Generation Revenue by Application (2023-2028) & (US$ Million)
Table 108. Middle East and Africa Hydrogen Generation Sales by Country (2017-2022) & (Units)
Table 109. Middle East and Africa Hydrogen Generation Sales by Country (2023-2028) & (Units)
Table 110. Middle East and Africa Hydrogen Generation Revenue by Country (2017-2022) & (US$ Million)
Table 111. Middle East and Africa Hydrogen Generation Revenue by Country (2023-2028) & (US$ Million)
Table 112. Proton On-Site Corporation Information
Table 113. Proton On-Site Description and Major Businesses
Table 114. Proton On-Site Hydrogen Generation Sales (Units), Revenue (US$ Million), Price (K USD/Unit) and Gross Margin (2017-2022)
Table 115. Proton On-Site Hydrogen Generation Product Model Numbers, Pictures, Descriptions and Specifications
Table 116. Proton On-Site Recent Development
Table 117. 718th Research Institute of CSIC Corporation Information
Table 118. 718th Research Institute of CSIC Description and Major Businesses
Table 119. 718th Research Institute of CSIC Hydrogen Generation Sales (Units), Revenue (US$ Million), Price (K USD/Unit) and Gross Margin (2017-2022)
Table 120. 718th Research Institute of CSIC Hydrogen Generation Product Model Numbers, Pictures, Descriptions and Specifications
Table 121. 718th Research Institute of CSIC Recent Development
Table 122. Teledyne Energy Systems Corporation Information
Table 123. Teledyne Energy Systems Description and Major Businesses
Table 124. Teledyne Energy Systems Hydrogen Generation Sales (Units), Revenue (US$ Million), Price (K USD/Unit) and Gross Margin (2017-2022)
Table 125. Teledyne Energy Systems Hydrogen Generation Product Model Numbers, Pictures, Descriptions and Specifications
Table 126. Teledyne Energy Systems Recent Development
Table 127. Hydrogenics Corporation Information
Table 128. Hydrogenics Description and Major Businesses
Table 129. Hydrogenics Hydrogen Generation Sales (Units), Revenue (US$ Million), Price (K USD/Unit) and Gross Margin (2017-2022)
Table 130. Hydrogenics Hydrogen Generation Product Model Numbers, Pictures, Descriptions and Specifications
Table 131. Hydrogenics Recent Development
Table 132. Nel Hydrogen Corporation Information
Table 133. Nel Hydrogen Description and Major Businesses
Table 134. Nel Hydrogen Hydrogen Generation Sales (Units), Revenue (US$ Million), Price (K USD/Unit) and Gross Margin (2017-2022)
Table 135. Nel Hydrogen Hydrogen Generation Product Model Numbers, Pictures, Descriptions and Specifications
Table 136. Nel Hydrogen Recent Development
Table 137. Suzhou Jingli Corporation Information
Table 138. Suzhou Jingli Description and Major Businesses
Table 139. Suzhou Jingli Hydrogen Generation Sales (Units), Revenue (US$ Million), Price (K USD/Unit) and Gross Margin (2017-2022)
Table 140. Suzhou Jingli Hydrogen Generation Product Model Numbers, Pictures, Descriptions and Specifications
Table 141. Suzhou Jingli Recent Development
Table 142. Beijing Zhongdian Corporation Information
Table 143. Beijing Zhongdian Description and Major Businesses
Table 144. Beijing Zhongdian Hydrogen Generation Sales (Units), Revenue (US$ Million), Price (K USD/Unit) and Gross Margin (2017-2022)
Table 145. Beijing Zhongdian Hydrogen Generation Product Model Numbers, Pictures, Descriptions and Specifications
Table 146. Beijing Zhongdian Recent Development
Table 147. McPhy Corporation Information
Table 148. McPhy Description and Major Businesses
Table 149. McPhy Hydrogen Generation Sales (Units), Revenue (US$ Million), Price (K USD/Unit) and Gross Margin (2017-2022)
Table 150. McPhy Hydrogen Generation Product Model Numbers, Pictures, Descriptions and Specifications
Table 151. McPhy Recent Development
Table 152. Siemens Corporation Information
Table 153. Siemens Description and Major Businesses
Table 154. Siemens Hydrogen Generation Sales (Units), Revenue (US$ Million), Price (K USD/Unit) and Gross Margin (2017-2022)
Table 155. Siemens Hydrogen Generation Product Model Numbers, Pictures, Descriptions and Specifications
Table 156. Siemens Recent Development
Table 157. TianJin Mainland Corporation Information
Table 158. TianJin Mainland Description and Major Businesses
Table 159. TianJin Mainland Hydrogen Generation Sales (Units), Revenue (US$ Million), Price (K USD/Unit) and Gross Margin (2017-2022)
Table 160. TianJin Mainland Hydrogen Generation Product Model Numbers, Pictures, Descriptions and Specifications
Table 161. TianJin Mainland Recent Development
Table 162. Areva H2gen Corporation Information
Table 163. Areva H2gen Description and Major Businesses
Table 164. Areva H2gen Hydrogen Generation Sales (Units), Revenue (US$ Million), Price (K USD/Unit) and Gross Margin (2017-2022)
Table 165. Areva H2gen Hydrogen Generation Product Model Numbers, Pictures, Descriptions and Specifications
Table 166. Areva H2gen Recent Development
Table 167. Shandong Saksay Hydrogen Energy Corporation Information
Table 168. Shandong Saksay Hydrogen Energy Description and Major Businesses
Table 169. Shandong Saksay Hydrogen Energy Hydrogen Generation Sales (Units), Revenue (US$ Million), Price (K USD/Unit) and Gross Margin (2017-2022)
Table 170. Shandong Saksay Hydrogen Energy Hydrogen Generation Product Model Numbers, Pictures, Descriptions and Specifications
Table 171. Shandong Saksay Hydrogen Energy Recent Development
Table 172. Yangzhou Chungdean Hydrogen Equipment Corporation Information
Table 173. Yangzhou Chungdean Hydrogen Equipment Description and Major Businesses
Table 174. Yangzhou Chungdean Hydrogen Equipment Hydrogen Generation Sales (Units), Revenue (US$ Million), Price (K USD/Unit) and Gross Margin (2017-2022)
Table 175. Yangzhou Chungdean Hydrogen Equipment Hydrogen Generation Product Model Numbers, Pictures, Descriptions and Specifications
Table 176. Yangzhou Chungdean Hydrogen Equipment Recent Development
Table 177. Asahi Kasei Corporation Information
Table 178. Asahi Kasei Description and Major Businesses
Table 179. Asahi Kasei Hydrogen Generation Sales (Units), Revenue (US$ Million), Price (K USD/Unit) and Gross Margin (2017-2022)
Table 180. Asahi Kasei Hydrogen Generation Product Model Numbers, Pictures, Descriptions and Specifications
Table 181. Asahi Kasei Recent Development
Table 182. Idroenergy Spa Corporation Information
Table 183. Idroenergy Spa Description and Major Businesses
Table 184. Idroenergy Spa Hydrogen Generation Sales (Units), Revenue (US$ Million), Price (K USD/Unit) and Gross Margin (2017-2022)
Table 185. Idroenergy Spa Hydrogen Generation Product Model Numbers, Pictures, Descriptions and Specifications
Table 186. Idroenergy Spa Recent Development
Table 187. Erredue SpA Corporation Information
Table 188. Erredue SpA Description and Major Businesses
Table 189. Erredue SpA Hydrogen Generation Sales (Units), Revenue (US$ Million), Price (K USD/Unit) and Gross Margin (2017-2022)
Table 190. Erredue SpA Hydrogen Generation Product Model Numbers, Pictures, Descriptions and Specifications
Table 191. Erredue SpA Recent Development
Table 192. ShaanXi HuaQin Corporation Information
Table 193. ShaanXi HuaQin Description and Major Businesses
Table 194. ShaanXi HuaQin Hydrogen Generation Sales (Units), Revenue (US$ Million), Price (K USD/Unit) and Gross Margin (2017-2022)
Table 195. ShaanXi HuaQin Hydrogen Generation Product Model Numbers, Pictures, Descriptions and Specifications
Table 196. ShaanXi HuaQin Recent Development
Table 197. Kobelco Eco-Solutions Corporation Information
Table 198. Kobelco Eco-Solutions Description and Major Businesses
Table 199. Kobelco Eco-Solutions Hydrogen Generation Sales (Units), Revenue (US$ Million), Price (K USD/Unit) and Gross Margin (2017-2022)
Table 200. Kobelco Eco-Solutions Hydrogen Generation Product Model Numbers, Pictures, Descriptions and Specifications
Table 201. Kobelco Eco-Solutions Recent Development
Table 202. ELB Elektrolysetechnik GmbH Corporation Information
Table 203. ELB Elektrolysetechnik GmbH Description and Major Businesses
Table 204. ELB Elektrolysetechnik GmbH Hydrogen Generation Sales (Units), Revenue (US$ Million), Price (K USD/Unit) and Gross Margin (2017-2022)
Table 205. ELB Elektrolysetechnik GmbH Hydrogen Generation Product Model Numbers, Pictures, Descriptions and Specifications
Table 206. ELB Elektrolysetechnik GmbH Recent Development
Table 207. ITM Power Corporation Information
Table 208. ITM Power Description and Major Businesses
Table 209. ITM Power Hydrogen Generation Sales (Units), Revenue (US$ Million), Price (K USD/Unit) and Gross Margin (2017-2022)
Table 210. ITM Power Hydrogen Generation Product Model Numbers, Pictures, Descriptions and Specifications
Table 211. ITM Power Recent Development
Table 212. Toshiba Corporation Information
Table 213. Toshiba Description and Major Businesses
Table 214. Toshiba Hydrogen Generation Sales (Units), Revenue (US$ Million), Price (K USD/Unit) and Gross Margin (2017-2022)
Table 215. Toshiba Hydrogen Generation Product Model Numbers, Pictures, Descriptions and Specifications
Table 216. Toshiba Recent Development
Table 217. Key Raw Materials Lists
Table 218. Raw Materials Key Suppliers Lists
Table 219. Hydrogen Generation Distributors List
Table 220. Hydrogen Generation Customers List
Table 221. Hydrogen Generation Market Trends
Table 222. Hydrogen Generation Market Drivers
Table 223. Hydrogen Generation Market Challenges
Table 224. Hydrogen Generation Market Restraints
Table 225. Research Programs/Design for This Report
Table 226. Key Data Information from Secondary Sources
Table 227. Key Data Information from Primary Sources
List of Figures
Figure 1. Hydrogen Generation Product Picture
Figure 2. Global Hydrogen Generation Market Share by Type in 2021 & 2028
Figure 3. Traditional Alkaline Electroliser Product Picture
Figure 4. PEM Electroliser Product Picture
Figure 5. Global Hydrogen Generation Market Share by Application in 2021 & 2028
Figure 6. Power Plants
Figure 7. Steel Plant
Figure 8. Electronics and Photovoltaics
Figure 9. Industrial Gases
Figure 10. Energy Storage or Fueling for FCEV's
Figure 11. Power to Gas
Figure 12. Others
Figure 13. Hydrogen Generation Report Years Considered
Figure 14. Global Hydrogen Generation Capacity, Production and Utilization (2017-2028) & (Units)
Figure 15. Global Hydrogen Generation Production Market Share by Region in Percentage: 2021 Versus 2028
Figure 16. Global Hydrogen Generation Production Market Share by Region (2017-2022)
Figure 17. Global Hydrogen Generation Production Market Share by Region (2023-2028)
Figure 18. Hydrogen Generation Production Growth Rate in North America (2017-2028) & (Units)
Figure 19. Hydrogen Generation Production Growth Rate in Europe (2017-2028) & (Units)
Figure 20. Hydrogen Generation Production Growth Rate in China (2017-2028) & (Units)
Figure 21. Hydrogen Generation Production Growth Rate in Japan (2017-2028) & (Units)
Figure 22. Global Hydrogen Generation Sales 2017-2028 (Units)
Figure 23. Global Hydrogen Generation Revenue, (US$ Million), 2017 VS 2021 VS 2028
Figure 24. Global Hydrogen Generation Revenue 2017-2028 (US$ Million)
Figure 25. Global Hydrogen Generation Revenue Market Share by Region in Percentage: 2021 Versus 2028
Figure 26. Global Hydrogen Generation Sales Market Share by Region (2017-2022)
Figure 27. Global Hydrogen Generation Sales Market Share by Region (2023-2028)
Figure 28. North America Hydrogen Generation Sales YoY (2017-2028) & (Units)
Figure 29. North America Hydrogen Generation Revenue YoY (2017-2028) & (US$ Million)
Figure 30. Europe Hydrogen Generation Sales YoY (2017-2028) & (Units)
Figure 31. Europe Hydrogen Generation Revenue YoY (2017-2028) & (US$ Million)
Figure 32. Asia-Pacific Hydrogen Generation Sales YoY (2017-2028) & (Units)
Figure 33. Asia-Pacific Hydrogen Generation Revenue YoY (2017-2028) & (US$ Million)
Figure 34. Latin America Hydrogen Generation Sales YoY (2017-2028) & (Units)
Figure 35. Latin America Hydrogen Generation Revenue YoY (2017-2028) & (US$ Million)
Figure 36. Middle East & Africa Hydrogen Generation Sales YoY (2017-2028) & (Units)
Figure 37. Middle East & Africa Hydrogen Generation Revenue YoY (2017-2028) & (US$ Million)
Figure 38. The Hydrogen Generation Market Share of Top 10 and Top 5 Largest Manufacturers Around the World in 2021
Figure 39. The Top 5 and 10 Largest Manufacturers of Hydrogen Generation in the World: Market Share by Hydrogen Generation Revenue in 2021
Figure 40. Hydrogen Generation Market Share by Company Type (Tier 1, Tier 2, and Tier 3): 2017 VS 2021
Figure 41. Global Hydrogen Generation Sales Market Share by Type (2017-2028)
Figure 42. Global Hydrogen Generation Revenue Market Share by Type (2017-2028)
Figure 43. Global Hydrogen Generation Sales Market Share by Application (2017-2028)
Figure 44. Global Hydrogen Generation Revenue Market Share by Application (2017-2028)
Figure 45. North America Hydrogen Generation Sales Market Share by Type (2017-2028)
Figure 46. North America Hydrogen Generation Revenue Market Share by Type (2017-2028)
Figure 47. North America Hydrogen Generation Sales Market Share by Application (2017-2028)
Figure 48. North America Hydrogen Generation Revenue Market Share by Application (2017-2028)
Figure 49. North America Hydrogen Generation Sales Share by Country (2017-2028)
Figure 50. North America Hydrogen Generation Revenue Share by Country (2017-2028)
Figure 51. U.S. Hydrogen Generation Revenue (2017-2028) & (US$ Million)
Figure 52. Canada Hydrogen Generation Revenue (2017-2028) & (US$ Million)
Figure 53. Europe Hydrogen Generation Sales Market Share by Type (2017-2028)
Figure 54. Europe Hydrogen Generation Revenue Market Share by Type (2017-2028)
Figure 55. Europe Hydrogen Generation Sales Market Share by Application (2017-2028)
Figure 56. Europe Hydrogen Generation Revenue Market Share by Application (2017-2028)
Figure 57. Europe Hydrogen Generation Sales Share by Country (2017-2028)
Figure 58. Europe Hydrogen Generation Revenue Share by Country (2017-2028)
Figure 59. Germany Hydrogen Generation Revenue (2017-2028) & (US$ Million)
Figure 60. France Hydrogen Generation Revenue (2017-2028) & (US$ Million)
Figure 61. U.K. Hydrogen Generation Revenue (2017-2028) & (US$ Million)
Figure 62. Italy Hydrogen Generation Revenue (2017-2028) & (US$ Million)
Figure 63. Russia Hydrogen Generation Revenue (2017-2028) & (US$ Million)
Figure 64. Asia Pacific Hydrogen Generation Sales Market Share by Type (2017-2028)
Figure 65. Asia Pacific Hydrogen Generation Revenue Market Share by Type (2017-2028)
Figure 66. Asia Pacific Hydrogen Generation Sales Market Share by Application (2017-2028)
Figure 67. Asia Pacific Hydrogen Generation Revenue Market Share by Application (2017-2028)
Figure 68. Asia Pacific Hydrogen Generation Sales Share by Region (2017-2028)
Figure 69. Asia Pacific Hydrogen Generation Revenue Share by Region (2017-2028)
Figure 70. China Hydrogen Generation Revenue (2017-2028) & (US$ Million)
Figure 71. Japan Hydrogen Generation Revenue (2017-2028) & (US$ Million)
Figure 72. South Korea Hydrogen Generation Revenue (2017-2028) & (US$ Million)
Figure 73. India Hydrogen Generation Revenue (2017-2028) & (US$ Million)
Figure 74. Australia Hydrogen Generation Revenue (2017-2028) & (US$ Million)
Figure 75. Taiwan Hydrogen Generation Revenue (2017-2028) & (US$ Million)
Figure 76. Indonesia Hydrogen Generation Revenue (2017-2028) & (US$ Million)
Figure 77. Thailand Hydrogen Generation Revenue (2017-2028) & (US$ Million)
Figure 78. Malaysia Hydrogen Generation Revenue (2017-2028) & (US$ Million)
Figure 79. Philippines Hydrogen Generation Revenue (2017-2028) & (US$ Million)
Figure 80. Latin America Hydrogen Generation Sales Market Share by Type (2017-2028)
Figure 81. Latin America Hydrogen Generation Revenue Market Share by Type (2017-2028)
Figure 82. Latin America Hydrogen Generation Sales Market Share by Application (2017-2028)
Figure 83. Latin America Hydrogen Generation Revenue Market Share by Application (2017-2028)
Figure 84. Latin America Hydrogen Generation Sales Share by Country (2017-2028)
Figure 85. Latin America Hydrogen Generation Revenue Share by Country (2017-2028)
Figure 86. Mexico Hydrogen Generation Revenue (2017-2028) & (US$ Million)
Figure 87. Brazil Hydrogen Generation Revenue (2017-2028) & (US$ Million)
Figure 88. Argentina Hydrogen Generation Revenue (2017-2028) & (US$ Million)
Figure 89. Middle East and Africa Hydrogen Generation Sales Market Share by Type (2017-2028)
Figure 90. Middle East and Africa Hydrogen Generation Revenue Market Share by Type (2017-2028)
Figure 91. Middle East and Africa Hydrogen Generation Sales Market Share by Application (2017-2028)
Figure 92. Middle East and Africa Hydrogen Generation Revenue Market Share by Application (2017-2028)
Figure 93. Middle East and Africa Hydrogen Generation Sales Share by Country (2017-2028)
Figure 94. Middle East and Africa Hydrogen Generation Revenue Share by Country (2017-2028)
Figure 95. Turkey Hydrogen Generation Revenue (2017-2028) & (US$ Million)
Figure 96. Saudi Arabia Hydrogen Generation Revenue (2017-2028) & (US$ Million)
Figure 97. U.A.E Hydrogen Generation Revenue (2017-2028) & (US$ Million)
Figure 98. Hydrogen Generation Value Chain
Figure 99. Hydrogen Generation Production Process
Figure 100. Channels of Distribution
Figure 101. Distributors Profiles
Figure 102. Bottom-up and Top-down Approaches for This Report
Figure 103. Data Triangulation
Figure 104. Key Executives Interviewed
$4900
$9800
HAVE A QUERY?
OUR CUSTOMER
