List of Tables
Table 1. Global Semiconductor Automated Test Equipment (ATE) Market Value by Type (US$ Million), 2025 vs 2032
Table 2. Global Semiconductor Automated Test Equipment (ATE) Market Value by Application (US$ Million), 2025 vs 2032
Table 3. Global Semiconductor Automated Test Equipment (ATE) Production Capacity (Units) by Manufacturers in 2025
Table 4. Global Semiconductor Automated Test Equipment (ATE) Production by Manufacturers (Units), 2021–2026
Table 5. Global Semiconductor Automated Test Equipment (ATE) Production Market Share by Manufacturers (2021–2026)
Table 6. Global Semiconductor Automated Test Equipment (ATE) Production Value by Manufacturers (US$ Million), 2021–2026
Table 7. Global Semiconductor Automated Test Equipment (ATE) Production Value Share by Manufacturers (2021–2026)
Table 8. Global Key Players of Semiconductor Automated Test Equipment (ATE), Industry Ranking, 2024 vs 2025
Table 9. Classification of Companies by Tier (Tier 1, Tier 2, Tier 3), based on Semiconductor Automated Test Equipment (ATE) Production Value, 2025
Table 10. Global Market Semiconductor Automated Test Equipment (ATE) Average Price by Manufacturers (K US$/Unit), 2021–2026
Table 11. Global Key Manufacturers of Semiconductor Automated Test Equipment (ATE), Manufacturing Footprints and Headquarters
Table 12. Global Key Manufacturers of Semiconductor Automated Test Equipment (ATE), Product Offerings and Applications
Table 13. Global Key Manufacturers of Semiconductor Automated Test Equipment (ATE), Date of Entry into the Industry
Table 14. Global Semiconductor Automated Test Equipment (ATE) Manufacturers Market Concentration Ratio (CR5 and HHI)
Table 15. Mergers & Acquisitions and Expansion Plans
Table 16. Global Semiconductor Automated Test Equipment (ATE) Production Value by Region: 2021 vs 2025 vs 2032 (US$ Million)
Table 17. Global Semiconductor Automated Test Equipment (ATE) Production Value (US$ Million) by Region (2021–2026)
Table 18. Global Semiconductor Automated Test Equipment (ATE) Production Value Market Share by Region (2021–2026)
Table 19. Global Semiconductor Automated Test Equipment (ATE) Production Value (US$ Million) Forecast by Region (2027–2032)
Table 20. Global Semiconductor Automated Test Equipment (ATE) Production Value Market Share Forecast by Region (2027–2032)
Table 21. Global Semiconductor Automated Test Equipment (ATE) Production Comparison by Region: 2021 vs 2025 vs 2032 (Units)
Table 22. Global Semiconductor Automated Test Equipment (ATE) Production (Units) by Region (2021–2026)
Table 23. Global Semiconductor Automated Test Equipment (ATE) Production Market Share by Region (2021–2026)
Table 24. Global Semiconductor Automated Test Equipment (ATE) Production (Units) Forecast by Region (2027–2032)
Table 25. Global Semiconductor Automated Test Equipment (ATE) Production Market Share Forecast by Region (2027–2032)
Table 26. Global Semiconductor Automated Test Equipment (ATE) Market Average Price (K US$/Unit) by Region (2021–2026)
Table 27. Global Semiconductor Automated Test Equipment (ATE) Market Average Price (K US$/Unit) by Region (2027–2032)
Table 28. Global Semiconductor Automated Test Equipment (ATE) Consumption Growth Rate by Region: 2021 vs 2025 vs 2032 (Units)
Table 29. Global Semiconductor Automated Test Equipment (ATE) Consumption by Region (Units), 2021–2026
Table 30. Global Semiconductor Automated Test Equipment (ATE) Consumption Market Share by Region (2021–2026)
Table 31. Global Semiconductor Automated Test Equipment (ATE) Forecasted Consumption by Region (Units), 2027–2032
Table 32. Global Semiconductor Automated Test Equipment (ATE) Forecasted Consumption Market Share by Region (2027–2032)
Table 33. North America Semiconductor Automated Test Equipment (ATE) Consumption Growth Rate by Country: 2021 vs 2025 vs 2032 (Units)
Table 34. North America Semiconductor Automated Test Equipment (ATE) Consumption by Country (Units), 2021–2026
Table 35. North America Semiconductor Automated Test Equipment (ATE) Consumption by Country (Units), 2027–2032
Table 36. Europe Semiconductor Automated Test Equipment (ATE) Consumption Growth Rate by Country: 2021 vs 2025 vs 2032 (Units)
Table 37. Europe Semiconductor Automated Test Equipment (ATE) Consumption by Country (Units), 2021–2026
Table 38. Europe Semiconductor Automated Test Equipment (ATE) Consumption by Country (Units), 2027–2032
Table 39. Asia Pacific Semiconductor Automated Test Equipment (ATE) Consumption Growth Rate by Region: 2021 vs 2025 vs 2032 (Units)
Table 40. Asia Pacific Semiconductor Automated Test Equipment (ATE) Consumption by Region (Units), 2021–2026
Table 41. Asia Pacific Semiconductor Automated Test Equipment (ATE) Consumption by Region (Units), 2027–2032
Table 42. Latin America, Middle East & Africa Semiconductor Automated Test Equipment (ATE) Consumption Growth Rate by Country: 2021 vs 2025 vs 2032 (Units)
Table 43. Latin America, Middle East & Africa Semiconductor Automated Test Equipment (ATE) Consumption by Country (Units), 2021–2026
Table 44. Latin America, Middle East & Africa Semiconductor Automated Test Equipment (ATE) Consumption by Country (Units), 2027–2032
Table 45. Global Semiconductor Automated Test Equipment (ATE) Production (Units) by Type (2021–2026)
Table 46. Global Semiconductor Automated Test Equipment (ATE) Production (Units) by Type (2027–2032)
Table 47. Global Semiconductor Automated Test Equipment (ATE) Production Market Share by Type (2021–2026)
Table 48. Global Semiconductor Automated Test Equipment (ATE) Production Market Share by Type (2027–2032)
Table 49. Global Semiconductor Automated Test Equipment (ATE) Production Value (US$ Million) by Type (2021–2026)
Table 50. Global Semiconductor Automated Test Equipment (ATE) Production Value (US$ Million) by Type (2027–2032)
Table 51. Global Semiconductor Automated Test Equipment (ATE) Production Value Market Share by Type (2021–2026)
Table 52. Global Semiconductor Automated Test Equipment (ATE) Production Value Market Share by Type (2027–2032)
Table 53. Global Semiconductor Automated Test Equipment (ATE) Price (K US$/Unit) by Type (2021–2026)
Table 54. Global Semiconductor Automated Test Equipment (ATE) Price (K US$/Unit) by Type (2027–2032)
Table 55. Global Semiconductor Automated Test Equipment (ATE) Production (Units) by Application (2021–2026)
Table 56. Global Semiconductor Automated Test Equipment (ATE) Production (Units) by Application (2027–2032)
Table 57. Global Semiconductor Automated Test Equipment (ATE) Production Market Share by Application (2021–2026)
Table 58. Global Semiconductor Automated Test Equipment (ATE) Production Market Share by Application (2027–2032)
Table 59. Global Semiconductor Automated Test Equipment (ATE) Production Value (US$ Million) by Application (2021–2026)
Table 60. Global Semiconductor Automated Test Equipment (ATE) Production Value (US$ Million) by Application (2027–2032)
Table 61. Global Semiconductor Automated Test Equipment (ATE) Production Value Market Share by Application (2021–2026)
Table 62. Global Semiconductor Automated Test Equipment (ATE) Production Value Market Share by Application (2027–2032)
Table 63. Global Semiconductor Automated Test Equipment (ATE) Price (K US$/Unit) by Application (2021–2026)
Table 64. Global Semiconductor Automated Test Equipment (ATE) Price (K US$/Unit) by Application (2027–2032)
Table 65. Advantest Semiconductor Automated Test Equipment (ATE) Company Information
Table 66. Advantest Semiconductor Automated Test Equipment (ATE) Specification and Application
Table 67. Advantest Semiconductor Automated Test Equipment (ATE) Production (Units), Value (US$ Million), Price (K US$/Unit) and Gross Margin (2021–2026)
Table 68. Advantest Main Business and Markets Served
Table 69. Advantest Recent Developments/Updates
Table 70. Teradyne Semiconductor Automated Test Equipment (ATE) Company Information
Table 71. Teradyne Semiconductor Automated Test Equipment (ATE) Specification and Application
Table 72. Teradyne Semiconductor Automated Test Equipment (ATE) Production (Units), Value (US$ Million), Price (K US$/Unit) and Gross Margin (2021–2026)
Table 73. Teradyne Main Business and Markets Served
Table 74. Teradyne Recent Developments/Updates
Table 75. Cohu Semiconductor Automated Test Equipment (ATE) Company Information
Table 76. Cohu Semiconductor Automated Test Equipment (ATE) Specification and Application
Table 77. Cohu Semiconductor Automated Test Equipment (ATE) Production (Units), Value (US$ Million), Price (K US$/Unit) and Gross Margin (2021–2026)
Table 78. Cohu Main Business and Markets Served
Table 79. Cohu Recent Developments/Updates
Table 80. Hangzhou Changchuan Technology Semiconductor Automated Test Equipment (ATE) Company Information
Table 81. Hangzhou Changchuan Technology Semiconductor Automated Test Equipment (ATE) Specification and Application
Table 82. Hangzhou Changchuan Technology Semiconductor Automated Test Equipment (ATE) Production (Units), Value (US$ Million), Price (K US$/Unit) and Gross Margin (2021–2026)
Table 83. Hangzhou Changchuan Technology Main Business and Markets Served
Table 84. Hangzhou Changchuan Technology Recent Developments/Updates
Table 85. YC Semiconductor Automated Test Equipment (ATE) Company Information
Table 86. YC Semiconductor Automated Test Equipment (ATE) Specification and Application
Table 87. YC Semiconductor Automated Test Equipment (ATE) Production (Units), Value (US$ Million), Price (K US$/Unit) and Gross Margin (2021–2026)
Table 88. YC Main Business and Markets Served
Table 89. YC Recent Developments/Updates
Table 90. Beijing Huafeng Test & Control Technology Semiconductor Automated Test Equipment (ATE) Company Information
Table 91. Beijing Huafeng Test & Control Technology Semiconductor Automated Test Equipment (ATE) Specification and Application
Table 92. Beijing Huafeng Test & Control Technology Semiconductor Automated Test Equipment (ATE) Production (Units), Value (US$ Million), Price (K US$/Unit) and Gross Margin (2021–2026)
Table 93. Beijing Huafeng Test & Control Technology Main Business and Markets Served
Table 94. Beijing Huafeng Test & Control Technology Recent Developments/Updates
Table 95. Chroma Semiconductor Automated Test Equipment (ATE) Company Information
Table 96. Chroma Semiconductor Automated Test Equipment (ATE) Specification and Application
Table 97. Chroma Semiconductor Automated Test Equipment (ATE) Production (Units), Value (US$ Million), Price (K US$/Unit) and Gross Margin (2021–2026)
Table 98. Chroma Main Business and Markets Served
Table 99. Chroma Recent Developments/Updates
Table 100. SPEA Semiconductor Automated Test Equipment (ATE) Company Information
Table 101. SPEA Semiconductor Automated Test Equipment (ATE) Specification and Application
Table 102. SPEA Semiconductor Automated Test Equipment (ATE) Production (Units), Value (US$ Million), Price (K US$/Unit) and Gross Margin (2021–2026)
Table 103. SPEA Main Business and Markets Served
Table 104. SPEA Recent Developments/Updates
Table 105. Shibasoku Semiconductor Automated Test Equipment (ATE) Company Information
Table 106. Shibasoku Semiconductor Automated Test Equipment (ATE) Specification and Application
Table 107. Shibasoku Semiconductor Automated Test Equipment (ATE) Production (Units), Value (US$ Million), Price (K US$/Unit) and Gross Margin (2021–2026)
Table 108. Shibasoku Main Business and Markets Served
Table 109. Shibasoku Recent Developments/Updates
Table 110. Macrotest Semiconductor Automated Test Equipment (ATE) Company Information
Table 111. Macrotest Semiconductor Automated Test Equipment (ATE) Specification and Application
Table 112. Macrotest Semiconductor Automated Test Equipment (ATE) Production (Units), Value (US$ Million), Price (K US$/Unit) and Gross Margin (2021–2026)
Table 113. Macrotest Main Business and Markets Served
Table 114. Macrotest Recent Developments/Updates
Table 115. PowerTECH Semiconductor Automated Test Equipment (ATE) Company Information
Table 116. PowerTECH Semiconductor Automated Test Equipment (ATE) Specification and Application
Table 117. PowerTECH Semiconductor Automated Test Equipment (ATE) Production (Units), Value (US$ Million), Price (K US$/Unit) and Gross Margin (2021–2026)
Table 118. PowerTECH Main Business and Markets Served
Table 119. PowerTECH Recent Developments/Updates
Table 120. Exicon Semiconductor Automated Test Equipment (ATE) Company Information
Table 121. Exicon Semiconductor Automated Test Equipment (ATE) Specification and Application
Table 122. Exicon Semiconductor Automated Test Equipment (ATE) Production (Units), Value (US$ Million), Price (K US$/Unit) and Gross Margin (2021–2026)
Table 123. Exicon Main Business and Markets Served
Table 124. Exicon Recent Developments/Updates
Table 125. TESEC Corporation Semiconductor Automated Test Equipment (ATE) Company Information
Table 126. TESEC Corporation Semiconductor Automated Test Equipment (ATE) Specification and Application
Table 127. TESEC Corporation Semiconductor Automated Test Equipment (ATE) Production (Units), Value (US$ Million), Price (K US$/Unit) and Gross Margin (2021–2026)
Table 128. TESEC Corporation Main Business and Markets Served
Table 129. TESEC Corporation Recent Developments/Updates
Table 130. UniSiC Semiconductor Automated Test Equipment (ATE) Company Information
Table 131. UniSiC Semiconductor Automated Test Equipment (ATE) Specification and Application
Table 132. UniSiC Semiconductor Automated Test Equipment (ATE) Production (Units), Value (US$ Million), Price (K US$/Unit) and Gross Margin (2021–2026)
Table 133. UniSiC Main Business and Markets Served
Table 134. UniSiC Recent Developments/Updates
Table 135. NI (SET GmbH) Semiconductor Automated Test Equipment (ATE) Company Information
Table 136. NI (SET GmbH) Semiconductor Automated Test Equipment (ATE) Specification and Application
Table 137. NI (SET GmbH) Semiconductor Automated Test Equipment (ATE) Production (Units), Value (US$ Million), Price (K US$/Unit) and Gross Margin (2021–2026)
Table 138. NI (SET GmbH) Main Business and Markets Served
Table 139. NI (SET GmbH) Recent Developments/Updates
Table 140. UNITEST Semiconductor Automated Test Equipment (ATE) Company Information
Table 141. UNITEST Semiconductor Automated Test Equipment (ATE) Specification and Application
Table 142. UNITEST Semiconductor Automated Test Equipment (ATE) Production (Units), Value (US$ Million), Price (K US$/Unit) and Gross Margin (2021–2026)
Table 143. UNITEST Main Business and Markets Served
Table 144. UNITEST Recent Developments/Updates
Table 145. YTEC Semiconductor Automated Test Equipment (ATE) Company Information
Table 146. YTEC Semiconductor Automated Test Equipment (ATE) Specification and Application
Table 147. YTEC Semiconductor Automated Test Equipment (ATE) Production (Units), Value (US$ Million), Price (K US$/Unit) and Gross Margin (2021–2026)
Table 148. YTEC Main Business and Markets Served
Table 149. YTEC Recent Developments/Updates
Table 150. AMIDA Semiconductor Automated Test Equipment (ATE) Company Information
Table 151. AMIDA Semiconductor Automated Test Equipment (ATE) Specification and Application
Table 152. AMIDA Semiconductor Automated Test Equipment (ATE) Production (Units), Value (US$ Million), Price (K US$/Unit) and Gross Margin (2021–2026)
Table 153. AMIDA Main Business and Markets Served
Table 154. AMIDA Recent Developments/Updates
Table 155. Test Research, Inc. Semiconductor Automated Test Equipment (ATE) Company Information
Table 156. Test Research, Inc. Semiconductor Automated Test Equipment (ATE) Specification and Application
Table 157. Test Research, Inc. Semiconductor Automated Test Equipment (ATE) Production (Units), Value (US$ Million), Price (K US$/Unit) and Gross Margin (2021–2026)
Table 158. Test Research, Inc. Main Business and Markets Served
Table 159. Test Research, Inc. Recent Developments/Updates
Table 160. STATEC Semiconductor Automated Test Equipment (ATE) Company Information
Table 161. STATEC Semiconductor Automated Test Equipment (ATE) Specification and Application
Table 162. STATEC Semiconductor Automated Test Equipment (ATE) Production (Units), Value (US$ Million), Price (K US$/Unit) and Gross Margin (2021–2026)
Table 163. STATEC Main Business and Markets Served
Table 164. STATEC Recent Developments/Updates
Table 165. Tektronix Semiconductor Automated Test Equipment (ATE) Company Information
Table 166. Tektronix Semiconductor Automated Test Equipment (ATE) Specification and Application
Table 167. Tektronix Semiconductor Automated Test Equipment (ATE) Production (Units), Value (US$ Million), Price (K US$/Unit) and Gross Margin (2021–2026)
Table 168. Tektronix Main Business and Markets Served
Table 169. Tektronix Recent Developments/Updates
Table 170. Hitachi Energy Semiconductor Automated Test Equipment (ATE) Company Information
Table 171. Hitachi Energy Semiconductor Automated Test Equipment (ATE) Specification and Application
Table 172. Hitachi Energy Semiconductor Automated Test Equipment (ATE) Production (Units), Value (US$ Million), Price (K US$/Unit) and Gross Margin (2021–2026)
Table 173. Hitachi Energy Main Business and Markets Served
Table 174. Hitachi Energy Recent Developments/Updates
Table 175. Lorlin Test Systems Semiconductor Automated Test Equipment (ATE) Company Information
Table 176. Lorlin Test Systems Semiconductor Automated Test Equipment (ATE) Specification and Application
Table 177. Lorlin Test Systems Semiconductor Automated Test Equipment (ATE) Production (Units), Value (US$ Million), Price (K US$/Unit) and Gross Margin (2021–2026)
Table 178. Lorlin Test Systems Main Business and Markets Served
Table 179. Lorlin Test Systems Recent Developments/Updates
Table 180. JUNO International Semiconductor Automated Test Equipment (ATE) Company Information
Table 181. JUNO International Semiconductor Automated Test Equipment (ATE) Specification and Application
Table 182. JUNO International Semiconductor Automated Test Equipment (ATE) Production (Units), Value (US$ Million), Price (K US$/Unit) and Gross Margin (2021–2026)
Table 183. JUNO International Main Business and Markets Served
Table 184. JUNO International Recent Developments/Updates
Table 185. ITEC BV Semiconductor Automated Test Equipment (ATE) Company Information
Table 186. ITEC BV Semiconductor Automated Test Equipment (ATE) Specification and Application
Table 187. ITEC BV Semiconductor Automated Test Equipment (ATE) Production (Units), Value (US$ Million), Price (K US$/Unit) and Gross Margin (2021–2026)
Table 188. ITEC BV Main Business and Markets Served
Table 189. ITEC BV Recent Developments/Updates
Table 190. ipTEST Ltd Semiconductor Automated Test Equipment (ATE) Company Information
Table 191. ipTEST Ltd Semiconductor Automated Test Equipment (ATE) Specification and Application
Table 192. ipTEST Ltd Semiconductor Automated Test Equipment (ATE) Production (Units), Value (US$ Million), Price (K US$/Unit) and Gross Margin (2021–2026)
Table 193. ipTEST Ltd Main Business and Markets Served
Table 194. ipTEST Ltd Recent Developments/Updates
Table 195. VX Instruments GmbH Semiconductor Automated Test Equipment (ATE) Company Information
Table 196. VX Instruments GmbH Semiconductor Automated Test Equipment (ATE) Specification and Application
Table 197. VX Instruments GmbH Semiconductor Automated Test Equipment (ATE) Production (Units), Value (US$ Million), Price (K US$/Unit) and Gross Margin (2021–2026)
Table 198. VX Instruments GmbH Main Business and Markets Served
Table 199. VX Instruments GmbH Recent Developments/Updates
Table 200. Shandong Prime-rel Electronic Technology Semiconductor Automated Test Equipment (ATE) Company Information
Table 201. Shandong Prime-rel Electronic Technology Semiconductor Automated Test Equipment (ATE) Specification and Application
Table 202. Shandong Prime-rel Electronic Technology Semiconductor Automated Test Equipment (ATE) Production (Units), Value (US$ Million), Price (K US$/Unit) and Gross Margin (2021–2026)
Table 203. Shandong Prime-rel Electronic Technology Main Business and Markets Served
Table 204. Shandong Prime-rel Electronic Technology Recent Developments/Updates
Table 205. Hefei Kewell Power System Semiconductor Automated Test Equipment (ATE) Company Information
Table 206. Hefei Kewell Power System Semiconductor Automated Test Equipment (ATE) Specification and Application
Table 207. Hefei Kewell Power System Semiconductor Automated Test Equipment (ATE) Production (Units), Value (US$ Million), Price (K US$/Unit) and Gross Margin (2021–2026)
Table 208. Hefei Kewell Power System Main Business and Markets Served
Table 209. Hefei Kewell Power System Recent Developments/Updates
Table 210. POWORLD Electronic Semiconductor Automated Test Equipment (ATE) Company Information
Table 211. POWORLD Electronic Semiconductor Automated Test Equipment (ATE) Specification and Application
Table 212. POWORLD Electronic Semiconductor Automated Test Equipment (ATE) Production (Units), Value (US$ Million), Price (K US$/Unit) and Gross Margin (2021–2026)
Table 213. POWORLD Electronic Main Business and Markets Served
Table 214. POWORLD Electronic Recent Developments/Updates
Table 215. Shaoxing Hongbang Electronics Technology Semiconductor Automated Test Equipment (ATE) Company Information
Table 216. Shaoxing Hongbang Electronics Technology Semiconductor Automated Test Equipment (ATE) Specification and Application
Table 217. Shaoxing Hongbang Electronics Technology Semiconductor Automated Test Equipment (ATE) Production (Units), Value (US$ Million), Price (K US$/Unit) and Gross Margin (2021–2026)
Table 218. Shaoxing Hongbang Electronics Technology Main Business and Markets Served
Table 219. Shaoxing Hongbang Electronics Technology Recent Developments/Updates
Table 220. Shenzhen Xinkailai Technology Semiconductor Automated Test Equipment (ATE) Company Information
Table 221. Shenzhen Xinkailai Technology Semiconductor Automated Test Equipment (ATE) Specification and Application
Table 222. Shenzhen Xinkailai Technology Semiconductor Automated Test Equipment (ATE) Production (Units), Value (US$ Million), Price (K US$/Unit) and Gross Margin (2021–2026)
Table 223. Shenzhen Xinkailai Technology Main Business and Markets Served
Table 224. Shenzhen Xinkailai Technology Recent Developments/Updates
Table 225. Shenzhen Bronze Technologies Semiconductor Automated Test Equipment (ATE) Company Information
Table 226. Shenzhen Bronze Technologies Semiconductor Automated Test Equipment (ATE) Specification and Application
Table 227. Shenzhen Bronze Technologies Semiconductor Automated Test Equipment (ATE) Production (Units), Value (US$ Million), Price (K US$/Unit) and Gross Margin (2021–2026)
Table 228. Shenzhen Bronze Technologies Main Business and Markets Served
Table 229. Shenzhen Bronze Technologies Recent Developments/Updates
Table 230. Wei Min Industrial Semiconductor Automated Test Equipment (ATE) Company Information
Table 231. Wei Min Industrial Semiconductor Automated Test Equipment (ATE) Specification and Application
Table 232. Wei Min Industrial Semiconductor Automated Test Equipment (ATE) Production (Units), Value (US$ Million), Price (K US$/Unit) and Gross Margin (2021–2026)
Table 233. Wei Min Industrial Main Business and Markets Served
Table 234. Wei Min Industrial Recent Developments/Updates
Table 235. Key Raw Materials Lists
Table 236. Raw Materials Key Suppliers Lists
Table 237. Semiconductor Automated Test Equipment (ATE) Distributors List
Table 238. Semiconductor Automated Test Equipment (ATE) Customers List
Table 239. Semiconductor Automated Test Equipment (ATE) Market Trends
Table 240. Semiconductor Automated Test Equipment (ATE) Market Drivers
Table 241. Semiconductor Automated Test Equipment (ATE) Market Challenges
Table 242. Semiconductor Automated Test Equipment (ATE) Market Restraints
Table 243. Research Programs/Design for This Report
Table 244. Key Data Information from Secondary Sources
Table 245. Key Data Information from Primary Sources
Table 246. Authors List of This Report
List of Figures
Figure 1. Product Picture of Semiconductor Automated Test Equipment (ATE)
Figure 2. Global Semiconductor Automated Test Equipment (ATE) Market Value by Type (US$ Million), 2021–2032
Figure 3. Global Semiconductor Automated Test Equipment (ATE) Market Share by Type: 2025 vs 2032
Figure 4. SoC Testers Product Picture
Figure 5. Memory Testers Product Picture
Figure 6. Discrete Device Testers Product Picture
Figure 7. Global Semiconductor Automated Test Equipment (ATE) Market Value by Application (US$ Million), 2021–2032
Figure 8. Global Semiconductor Automated Test Equipment (ATE) Market Share by Application: 2025 vs 2032
Figure 9. Automotive
Figure 10. Consumer
Figure 11. Defense
Figure 12. IT& Telecommunications
Figure 13. Others
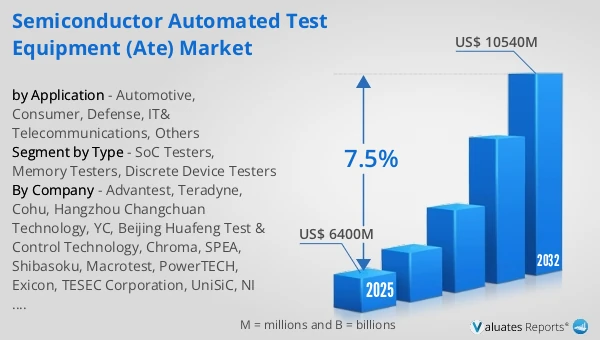
Figure 14. Global Semiconductor Automated Test Equipment (ATE) Production Value (US$ Million), 2021 vs 2025 vs 2032
Figure 15. Global Semiconductor Automated Test Equipment (ATE) Production Value (US$ Million), 2021–2032
Figure 16. Global Semiconductor Automated Test Equipment (ATE) Production Capacity (Units), 2021–2032
Figure 17. Global Semiconductor Automated Test Equipment (ATE) Production (Units), 2021–2032
Figure 18. Global Semiconductor Automated Test Equipment (ATE) Average Price (K US$/Unit), 2021–2032
Figure 19. Semiconductor Automated Test Equipment (ATE) Report Years Considered
Figure 20. Semiconductor Automated Test Equipment (ATE) Production Share by Manufacturers in 2025
Figure 21. Global Semiconductor Automated Test Equipment (ATE) Production Value Share by Manufacturers (2025)
Figure 22. Semiconductor Automated Test Equipment (ATE) Market Share by Company Type (Tier 1, Tier 2, and Tier 3): 2021 vs 2025
Figure 23. Top 5 and Top 10 Global Players: Market Share by Semiconductor Automated Test Equipment (ATE) Revenue in 2025
Figure 24. Global Semiconductor Automated Test Equipment (ATE) Production Value by Region: 2021 vs 2025 vs 2032 (US$ Million)
Figure 25. Global Semiconductor Automated Test Equipment (ATE) Production Value Market Share by Region: 2021 vs 2025 vs 2032
Figure 26. Global Semiconductor Automated Test Equipment (ATE) Production Comparison by Region: 2021 vs 2025 vs 2032 (Units)
Figure 27. Global Semiconductor Automated Test Equipment (ATE) Production Market Share by Region: 2021 vs 2025 vs 2032
Figure 28. North America Semiconductor Automated Test Equipment (ATE) Production Value (US$ Million) Growth Rate (2021–2032)
Figure 29. Europe Semiconductor Automated Test Equipment (ATE) Production Value (US$ Million) Growth Rate (2021–2032)
Figure 30. China Semiconductor Automated Test Equipment (ATE) Production Value (US$ Million) Growth Rate (2021–2032)
Figure 31. Japan Semiconductor Automated Test Equipment (ATE) Production Value (US$ Million) Growth Rate (2021–2032)
Figure 32. China Taiwan Semiconductor Automated Test Equipment (ATE) Production Value (US$ Million) Growth Rate (2021–2032)
Figure 33. Global Semiconductor Automated Test Equipment (ATE) Consumption by Region: 2021 vs 2025 vs 2032 (Units)
Figure 34. Global Semiconductor Automated Test Equipment (ATE) Consumption Market Share by Region: 2021 vs 2025 vs 2032
Figure 35. North America Semiconductor Automated Test Equipment (ATE) Consumption and Growth Rate (Units), 2021–2032
Figure 36. North America Semiconductor Automated Test Equipment (ATE) Consumption Market Share by Country (2021–2032)
Figure 37. U.S. Semiconductor Automated Test Equipment (ATE) Consumption and Growth Rate (Units), 2021–2032
Figure 38. Canada Semiconductor Automated Test Equipment (ATE) Consumption and Growth Rate (Units), 2021–2032
Figure 39. Europe Semiconductor Automated Test Equipment (ATE) Consumption and Growth Rate (Units), 2021–2032
Figure 40. Europe Semiconductor Automated Test Equipment (ATE) Consumption Market Share by Country (2021–2032)
Figure 41. Germany Semiconductor Automated Test Equipment (ATE) Consumption and Growth Rate (Units), 2021–2032
Figure 42. France Semiconductor Automated Test Equipment (ATE) Consumption and Growth Rate (Units), 2021–2032
Figure 43. U.K. Semiconductor Automated Test Equipment (ATE) Consumption and Growth Rate (Units), 2021–2032
Figure 44. Italy Semiconductor Automated Test Equipment (ATE) Consumption and Growth Rate (Units), 2021–2032
Figure 45. Russia Semiconductor Automated Test Equipment (ATE) Consumption and Growth Rate (Units), 2021–2032
Figure 46. Asia Pacific Semiconductor Automated Test Equipment (ATE) Consumption and Growth Rate (Units), 2021–2032
Figure 47. Asia Pacific Semiconductor Automated Test Equipment (ATE) Consumption Market Share by Region (2021–2032)
Figure 48. China Semiconductor Automated Test Equipment (ATE) Consumption and Growth Rate (Units), 2021–2032
Figure 49. Japan Semiconductor Automated Test Equipment (ATE) Consumption and Growth Rate (Units), 2021–2032
Figure 50. South Korea Semiconductor Automated Test Equipment (ATE) Consumption and Growth Rate (Units), 2021–2032
Figure 51. China Taiwan Semiconductor Automated Test Equipment (ATE) Consumption and Growth Rate (Units), 2021–2032
Figure 52. Southeast Asia Semiconductor Automated Test Equipment (ATE) Consumption and Growth Rate (Units), 2021–2032
Figure 53. India Semiconductor Automated Test Equipment (ATE) Consumption and Growth Rate (Units), 2021–2032
Figure 54. Latin America, Middle East & Africa Semiconductor Automated Test Equipment (ATE) Consumption and Growth Rate (Units), 2021–2032
Figure 55. Latin America, Middle East & Africa Semiconductor Automated Test Equipment (ATE) Consumption Market Share by Country (2021–2032)
Figure 56. Mexico Semiconductor Automated Test Equipment (ATE) Consumption and Growth Rate (Units), 2021–2032
Figure 57. Brazil Semiconductor Automated Test Equipment (ATE) Consumption and Growth Rate (Units), 2021–2032
Figure 58. Israel Semiconductor Automated Test Equipment (ATE) Consumption and Growth Rate (Units), 2021–2032
Figure 59. GCC Countries Semiconductor Automated Test Equipment (ATE) Consumption and Growth Rate (Units), 2021–2032
Figure 60. Global Production Market Share of Semiconductor Automated Test Equipment (ATE) by Type (2021–2032)
Figure 61. Global Production Value Market Share of Semiconductor Automated Test Equipment (ATE) by Type (2021–2032)
Figure 62. Global Semiconductor Automated Test Equipment (ATE) Price (K US$/Unit) by Type (2021–2032)
Figure 63. Global Production Market Share of Semiconductor Automated Test Equipment (ATE) by Application (2021–2032)
Figure 64. Global Production Value Market Share of Semiconductor Automated Test Equipment (ATE) by Application (2021–2032)
Figure 65. Global Semiconductor Automated Test Equipment (ATE) Price (K US$/Unit) by Application (2021–2032)
Figure 66. Semiconductor Automated Test Equipment (ATE) Value Chain
Figure 67. Channels of Distribution (Direct Vs Distribution)
Figure 68. Bottom-up and Top-down Approaches for This Report
Figure 69. Data Triangulation