0
U.S. (TOLL FREE)
+1 (315) 215-3225
Automative

0
U.S. (TOLL FREE)
+1 (315) 215-3225
Public Service Robot - Global Market Share and Ranking, Overall Sales and Demand Forecast 2024-2030
Published Date: November 2024
|
Report Code: QYRE-Auto-29U7759
Home | Market Reports | Business & Industrial| Industrial Materials & Equipment| Heavy Machinery
Global Public Service Robot Market Insights and Forecast to 2028
BUY CHAPTERS

Public Service Robot - Global Market Share and Ranking, Overall Sales and Demand Forecast 2024-2030

Code: QYRE-Auto-29U7759
Report
November 2024
Pages:162
QYResearch
Buy Now with 15% Discount
DESCRIPTION
TABLE OF CONTENT
TABLES & FIGURES

Public Service Robot - Market Size

The global market for Public Service Robot was estimated to be worth US$ 13 million in 2023 and is forecast to a readjusted size of US$ 17 million by 2030 with a CAGR of 4.1% during the forecast period 2024-2030

Public Service Robot - Market

Public Service Robot - Market

North American market for Public Service Robot was valued at $ million in 2023 and will reach $ million by 2030, at a CAGR of % during the forecast period of 2024 through 2030.
Asia-Pacific market for Public Service Robot was valued at $ million in 2023 and will reach $ million by 2030, at a CAGR of % during the forecast period of 2024 through 2030.
Europe market for Public Service Robot was valued at $ million in 2023 and will reach $ million by 2030, at a CAGR of % during the forecast period of 2024 through 2030.
The global key companies of Public Service Robot include KUKA (Swisslog), Daifuku, Knapp, Dematic, Grenzebach, Bastian, CIM Corp, Amazon Robotics and Vanderlande, etc. In 2023, the global five largest players hold a share approximately % in terms of revenue.

Report Scope

This report aims to provide a comprehensive presentation of the global market for Public Service Robot, focusing on the total sales volume, sales revenue, price, key companies market share and ranking, together with an analysis of Public Service Robot by region & country, by Type, and by Application.
The Public Service Robot market size, estimations, and forecasts are provided in terms of sales volume (Units) and sales revenue ($ millions), considering 2023 as the base year, with history and forecast data for the period from 2019 to 2030. With both quantitative and qualitative analysis, to help readers develop business/growth strategies, assess the market competitive situation, analyze their position in the current marketplace, and make informed business decisions regarding Public Service Robot.
Market Segmentation

Scope of Public Service Robot - Market Report

Report Metric Details
Report Name Public Service Robot - Market
Forecasted market size in 2030 US$ 17 million
CAGR 4.1%
Forecasted years 2024 - 2030
Segment by Type:
Segment by Application
  • Security Patrol
  • Community Service
  • Intelligent Traffic Police
  • Hotel Service
  • Exhibition Service
  • Intelligent Pension
  • Other
By Region
  • North America (United States, Canada)
  • Europe (Germany, France, UK, Italy, Russia) Rest of Europe
  • Nordic Countries
  • Asia-Pacific (China, Japan, South Korea)
  • Southeast Asia (India, Australia)
  • Rest of Asia
  • Latin America (Mexico, Brazil)
  • Rest of Latin America
  • Middle East & Africa (Turkey, Saudi Arabia, UAE, Rest of MEA)
By Company KUKA (Swisslog), Daifuku, Knapp, Dematic, Grenzebach, Bastian, CIM Corp, Amazon Robotics, Vanderlande, Vecna, Hitachi, Hi-tech Robotic Systemz, Adept Technology, Grey Orange, IAM Robotics, Fetch Robotics, Starship Technologies, Robby Technologies, Boston Dynamics, Robomart, Eliport, Piaggio Fast Forward, Box Bot, Savioke, Dispatch, TeleRetail, Marble, Nuro, Jingdong
Forecast units USD million in value
Report coverage Revenue and volume forecast, company share, competitive landscape, growth factors and trends

Chapter Outline

  • Chapter 1: Introduces the report scope of the report, global total market size (valve, volume and price). This chapter also provides the market dynamics, latest developments of the market, the driving factors and restrictive factors of the market, the challenges and risks faced by manufacturers in the industry, and the analysis of relevant policies in the industry.
  • Chapter 2: Detailed analysis of Public Service Robot manufacturers competitive landscape, price, sales and revenue market share, latest development plan, merger, and acquisition information, etc.
  • Chapter 3: Provides the analysis of various market segments by Type, covering the market size and development potential of each market segment, to help readers find the blue ocean market in different market segments.
  • Chapter 4: Provides the analysis of various market segments by Application, covering the market size and development potential of each market segment, to help readers find the blue ocean market in different downstream markets.
  • Chapter 5: Sales, revenue of Public Service Robot in regional level. It provides a quantitative analysis of the market size and development potential of each region and introduces the market development, future development prospects, market space, and market size of each country in the world.
  • Chapter 6: Sales, revenue of Public Service Robot in country level. It provides sigmate data by Type, and by Application for each country/region.
  • Chapter 7: Provides profiles of key players, introducing the basic situation of the main companies in the market in detail, including product sales, revenue, price, gross margin, product introduction, recent development, etc.
  • Chapter 8: Analysis of industrial chain, including the upstream and downstream of the industry.
  • Chapter 9: Conclusion.

FAQ for this report

What is the Public Service Robot - Market size in 2030?

Ans: The Public Service Robot - Market size in 2030 will be US$ 17 million.

Who are the main players in the Public Service Robot - Market report?

Ans: The main players in the Public Service Robot - Market are KUKA (Swisslog), Daifuku, Knapp, Dematic, Grenzebach, Bastian, CIM Corp, Amazon Robotics, Vanderlande, Vecna, Hitachi, Hi-tech Robotic Systemz, Adept Technology, Grey Orange, IAM Robotics, Fetch Robotics, Starship Technologies, Robby Technologies, Boston Dynamics, Robomart, Eliport, Piaggio Fast Forward, Box Bot, Savioke, Dispatch, TeleRetail, Marble, Nuro, Jingdong

What are the Application segmentation covered in the Public Service Robot - Market report?

Ans: The Applications covered in the Public Service Robot - Market report are Security Patrol, Community Service, Intelligent Traffic Police, Hotel Service, Exhibition Service, Intelligent Pension, Other

What are the Type segmentation covered in the Public Service Robot - Market report?

Ans: The Types covered in the Public Service Robot - Market report are Logistics Robot, Courier Robot, Welcome Service Robot, Bank Robot, Retail Robot, Other

Recommended Reports

Service Robots

Delivery & Retail Robots

Healthcare & Education Robots

1 Market Overview
1.1 Public Service Robot Product Introduction
1.2 Global Public Service Robot Market Size Forecast
1.2.1 Global Public Service Robot Sales Value (2019-2030)
1.2.2 Global Public Service Robot Sales Volume (2019-2030)
1.2.3 Global Public Service Robot Sales Price (2019-2030)
1.3 Public Service Robot Market Trends & Drivers
1.3.1 Public Service Robot Industry Trends
1.3.2 Public Service Robot Market Drivers & Opportunity
1.3.3 Public Service Robot Market Challenges
1.3.4 Public Service Robot Market Restraints
1.4 Assumptions and Limitations
1.5 Study Objectives
1.6 Years Considered
2 Competitive Analysis by Company
2.1 Global Public Service Robot Players Revenue Ranking (2023)
2.2 Global Public Service Robot Revenue by Company (2019-2024)
2.3 Global Public Service Robot Players Sales Volume Ranking (2023)
2.4 Global Public Service Robot Sales Volume by Company Players (2019-2024)
2.5 Global Public Service Robot Average Price by Company (2019-2024)
2.6 Key Manufacturers Public Service Robot Manufacturing Base Distribution and Headquarters
2.7 Key Manufacturers Public Service Robot Product Offered
2.8 Key Manufacturers Time to Begin Mass Production of Public Service Robot
2.9 Public Service Robot Market Competitive Analysis
2.9.1 Public Service Robot Market Concentration Rate (2019-2024)
2.9.2 Global 5 and 10 Largest Manufacturers by Public Service Robot Revenue in 2023
2.9.3 Global Top Manufacturers by Company Type (Tier 1, Tier 2, and Tier 3) & (based on the Revenue in Public Service Robot as of 2023)
2.10 Mergers & Acquisitions, Expansion
3 Segmentation by Type
3.1 Introduction by Type
3.1.1 Logistics Robot
3.1.2 Courier Robot
3.1.3 Welcome Service Robot
3.1.4 Bank Robot
3.1.5 Retail Robot
3.1.6 Other
3.2 Global Public Service Robot Sales Value by Type
3.2.1 Global Public Service Robot Sales Value by Type (2019 VS 2023 VS 2030)
3.2.2 Global Public Service Robot Sales Value, by Type (2019-2030)
3.2.3 Global Public Service Robot Sales Value, by Type (%) (2019-2030)
3.3 Global Public Service Robot Sales Volume by Type
3.3.1 Global Public Service Robot Sales Volume by Type (2019 VS 2023 VS 2030)
3.3.2 Global Public Service Robot Sales Volume, by Type (2019-2030)
3.3.3 Global Public Service Robot Sales Volume, by Type (%) (2019-2030)
3.4 Global Public Service Robot Average Price by Type (2019-2030)
4 Segmentation by Application
4.1 Introduction by Application
4.1.1 Security Patrol
4.1.2 Community Service
4.1.3 Intelligent Traffic Police
4.1.4 Hotel Service
4.1.5 Exhibition Service
4.1.6 Intelligent Pension
4.1.7 Other
4.2 Global Public Service Robot Sales Value by Application
4.2.1 Global Public Service Robot Sales Value by Application (2019 VS 2023 VS 2030)
4.2.2 Global Public Service Robot Sales Value, by Application (2019-2030)
4.2.3 Global Public Service Robot Sales Value, by Application (%) (2019-2030)
4.3 Global Public Service Robot Sales Volume by Application
4.3.1 Global Public Service Robot Sales Volume by Application (2019 VS 2023 VS 2030)
4.3.2 Global Public Service Robot Sales Volume, by Application (2019-2030)
4.3.3 Global Public Service Robot Sales Volume, by Application (%) (2019-2030)
4.4 Global Public Service Robot Average Price by Application (2019-2030)
5 Segmentation by Region
5.1 Global Public Service Robot Sales Value by Region
5.1.1 Global Public Service Robot Sales Value by Region: 2019 VS 2023 VS 2030
5.1.2 Global Public Service Robot Sales Value by Region (2019-2024)
5.1.3 Global Public Service Robot Sales Value by Region (2025-2030)
5.1.4 Global Public Service Robot Sales Value by Region (%), (2019-2030)
5.2 Global Public Service Robot Sales Volume by Region
5.2.1 Global Public Service Robot Sales Volume by Region: 2019 VS 2023 VS 2030
5.2.2 Global Public Service Robot Sales Volume by Region (2019-2024)
5.2.3 Global Public Service Robot Sales Volume by Region (2025-2030)
5.2.4 Global Public Service Robot Sales Volume by Region (%), (2019-2030)
5.3 Global Public Service Robot Average Price by Region (2019-2030)
5.4 North America
5.4.1 North America Public Service Robot Sales Value, 2019-2030
5.4.2 North America Public Service Robot Sales Value by Country (%), 2023 VS 2030
5.5 Europe
5.5.1 Europe Public Service Robot Sales Value, 2019-2030
5.5.2 Europe Public Service Robot Sales Value by Country (%), 2023 VS 2030
5.6 Asia Pacific
5.6.1 Asia Pacific Public Service Robot Sales Value, 2019-2030
5.6.2 Asia Pacific Public Service Robot Sales Value by Country (%), 2023 VS 2030
5.7 South America
5.7.1 South America Public Service Robot Sales Value, 2019-2030
5.7.2 South America Public Service Robot Sales Value by Country (%), 2023 VS 2030
5.8 Middle East & Africa
5.8.1 Middle East & Africa Public Service Robot Sales Value, 2019-2030
5.8.2 Middle East & Africa Public Service Robot Sales Value by Country (%), 2023 VS 2030
6 Segmentation by Key Countries/Regions
6.1 Key Countries/Regions Public Service Robot Sales Value Growth Trends, 2019 VS 2023 VS 2030
6.2 Key Countries/Regions Public Service Robot Sales Value
6.2.1 Key Countries/Regions Public Service Robot Sales Value, 2019-2030
6.2.2 Key Countries/Regions Public Service Robot Sales Volume, 2019-2030
6.3 United States
6.3.1 United States Public Service Robot Sales Value, 2019-2030
6.3.2 United States Public Service Robot Sales Value by Type (%), 2023 VS 2030
6.3.3 United States Public Service Robot Sales Value by Application, 2023 VS 2030
6.4 Europe
6.4.1 Europe Public Service Robot Sales Value, 2019-2030
6.4.2 Europe Public Service Robot Sales Value by Type (%), 2023 VS 2030
6.4.3 Europe Public Service Robot Sales Value by Application, 2023 VS 2030
6.5 China
6.5.1 China Public Service Robot Sales Value, 2019-2030
6.5.2 China Public Service Robot Sales Value by Type (%), 2023 VS 2030
6.5.3 China Public Service Robot Sales Value by Application, 2023 VS 2030
6.6 Japan
6.6.1 Japan Public Service Robot Sales Value, 2019-2030
6.6.2 Japan Public Service Robot Sales Value by Type (%), 2023 VS 2030
6.6.3 Japan Public Service Robot Sales Value by Application, 2023 VS 2030
6.7 South Korea
6.7.1 South Korea Public Service Robot Sales Value, 2019-2030
6.7.2 South Korea Public Service Robot Sales Value by Type (%), 2023 VS 2030
6.7.3 South Korea Public Service Robot Sales Value by Application, 2023 VS 2030
6.8 Southeast Asia
6.8.1 Southeast Asia Public Service Robot Sales Value, 2019-2030
6.8.2 Southeast Asia Public Service Robot Sales Value by Type (%), 2023 VS 2030
6.8.3 Southeast Asia Public Service Robot Sales Value by Application, 2023 VS 2030
6.9 India
6.9.1 India Public Service Robot Sales Value, 2019-2030
6.9.2 India Public Service Robot Sales Value by Type (%), 2023 VS 2030
6.9.3 India Public Service Robot Sales Value by Application, 2023 VS 2030
7 Company Profiles
7.1 KUKA (Swisslog)
7.1.1 KUKA (Swisslog) Company Information
7.1.2 KUKA (Swisslog) Introduction and Business Overview
7.1.3 KUKA (Swisslog) Public Service Robot Sales, Revenue and Gross Margin (2019-2024)
7.1.4 KUKA (Swisslog) Public Service Robot Product Offerings
7.1.5 KUKA (Swisslog) Recent Development
7.2 Daifuku
7.2.1 Daifuku Company Information
7.2.2 Daifuku Introduction and Business Overview
7.2.3 Daifuku Public Service Robot Sales, Revenue and Gross Margin (2019-2024)
7.2.4 Daifuku Public Service Robot Product Offerings
7.2.5 Daifuku Recent Development
7.3 Knapp
7.3.1 Knapp Company Information
7.3.2 Knapp Introduction and Business Overview
7.3.3 Knapp Public Service Robot Sales, Revenue and Gross Margin (2019-2024)
7.3.4 Knapp Public Service Robot Product Offerings
7.3.5 Knapp Recent Development
7.4 Dematic
7.4.1 Dematic Company Information
7.4.2 Dematic Introduction and Business Overview
7.4.3 Dematic Public Service Robot Sales, Revenue and Gross Margin (2019-2024)
7.4.4 Dematic Public Service Robot Product Offerings
7.4.5 Dematic Recent Development
7.5 Grenzebach
7.5.1 Grenzebach Company Information
7.5.2 Grenzebach Introduction and Business Overview
7.5.3 Grenzebach Public Service Robot Sales, Revenue and Gross Margin (2019-2024)
7.5.4 Grenzebach Public Service Robot Product Offerings
7.5.5 Grenzebach Recent Development
7.6 Bastian
7.6.1 Bastian Company Information
7.6.2 Bastian Introduction and Business Overview
7.6.3 Bastian Public Service Robot Sales, Revenue and Gross Margin (2019-2024)
7.6.4 Bastian Public Service Robot Product Offerings
7.6.5 Bastian Recent Development
7.7 CIM Corp
7.7.1 CIM Corp Company Information
7.7.2 CIM Corp Introduction and Business Overview
7.7.3 CIM Corp Public Service Robot Sales, Revenue and Gross Margin (2019-2024)
7.7.4 CIM Corp Public Service Robot Product Offerings
7.7.5 CIM Corp Recent Development
7.8 Amazon Robotics
7.8.1 Amazon Robotics Company Information
7.8.2 Amazon Robotics Introduction and Business Overview
7.8.3 Amazon Robotics Public Service Robot Sales, Revenue and Gross Margin (2019-2024)
7.8.4 Amazon Robotics Public Service Robot Product Offerings
7.8.5 Amazon Robotics Recent Development
7.9 Vanderlande
7.9.1 Vanderlande Company Information
7.9.2 Vanderlande Introduction and Business Overview
7.9.3 Vanderlande Public Service Robot Sales, Revenue and Gross Margin (2019-2024)
7.9.4 Vanderlande Public Service Robot Product Offerings
7.9.5 Vanderlande Recent Development
7.10 Vecna
7.10.1 Vecna Company Information
7.10.2 Vecna Introduction and Business Overview
7.10.3 Vecna Public Service Robot Sales, Revenue and Gross Margin (2019-2024)
7.10.4 Vecna Public Service Robot Product Offerings
7.10.5 Vecna Recent Development
7.11 Hitachi
7.11.1 Hitachi Company Information
7.11.2 Hitachi Introduction and Business Overview
7.11.3 Hitachi Public Service Robot Sales, Revenue and Gross Margin (2019-2024)
7.11.4 Hitachi Public Service Robot Product Offerings
7.11.5 Hitachi Recent Development
7.12 Hi-tech Robotic Systemz
7.12.1 Hi-tech Robotic Systemz Company Information
7.12.2 Hi-tech Robotic Systemz Introduction and Business Overview
7.12.3 Hi-tech Robotic Systemz Public Service Robot Sales, Revenue and Gross Margin (2019-2024)
7.12.4 Hi-tech Robotic Systemz Public Service Robot Product Offerings
7.12.5 Hi-tech Robotic Systemz Recent Development
7.13 Adept Technology
7.13.1 Adept Technology Company Information
7.13.2 Adept Technology Introduction and Business Overview
7.13.3 Adept Technology Public Service Robot Sales, Revenue and Gross Margin (2019-2024)
7.13.4 Adept Technology Public Service Robot Product Offerings
7.13.5 Adept Technology Recent Development
7.14 Grey Orange
7.14.1 Grey Orange Company Information
7.14.2 Grey Orange Introduction and Business Overview
7.14.3 Grey Orange Public Service Robot Sales, Revenue and Gross Margin (2019-2024)
7.14.4 Grey Orange Public Service Robot Product Offerings
7.14.5 Grey Orange Recent Development
7.15 IAM Robotics
7.15.1 IAM Robotics Company Information
7.15.2 IAM Robotics Introduction and Business Overview
7.15.3 IAM Robotics Public Service Robot Sales, Revenue and Gross Margin (2019-2024)
7.15.4 IAM Robotics Public Service Robot Product Offerings
7.15.5 IAM Robotics Recent Development
7.16 Fetch Robotics
7.16.1 Fetch Robotics Company Information
7.16.2 Fetch Robotics Introduction and Business Overview
7.16.3 Fetch Robotics Public Service Robot Sales, Revenue and Gross Margin (2019-2024)
7.16.4 Fetch Robotics Public Service Robot Product Offerings
7.16.5 Fetch Robotics Recent Development
7.17 Starship Technologies
7.17.1 Starship Technologies Company Information
7.17.2 Starship Technologies Introduction and Business Overview
7.17.3 Starship Technologies Public Service Robot Sales, Revenue and Gross Margin (2019-2024)
7.17.4 Starship Technologies Public Service Robot Product Offerings
7.17.5 Starship Technologies Recent Development
7.18 Robby Technologies
7.18.1 Robby Technologies Company Information
7.18.2 Robby Technologies Introduction and Business Overview
7.18.3 Robby Technologies Public Service Robot Sales, Revenue and Gross Margin (2019-2024)
7.18.4 Robby Technologies Public Service Robot Product Offerings
7.18.5 Robby Technologies Recent Development
7.19 Boston Dynamics
7.19.1 Boston Dynamics Company Information
7.19.2 Boston Dynamics Introduction and Business Overview
7.19.3 Boston Dynamics Public Service Robot Sales, Revenue and Gross Margin (2019-2024)
7.19.4 Boston Dynamics Public Service Robot Product Offerings
7.19.5 Boston Dynamics Recent Development
7.20 Robomart
7.20.1 Robomart Company Information
7.20.2 Robomart Introduction and Business Overview
7.20.3 Robomart Public Service Robot Sales, Revenue and Gross Margin (2019-2024)
7.20.4 Robomart Public Service Robot Product Offerings
7.20.5 Robomart Recent Development
7.21 Eliport
7.21.1 Eliport Company Information
7.21.2 Eliport Introduction and Business Overview
7.21.3 Eliport Public Service Robot Sales, Revenue and Gross Margin (2019-2024)
7.21.4 Eliport Public Service Robot Product Offerings
7.21.5 Eliport Recent Development
7.22 Piaggio Fast Forward
7.22.1 Piaggio Fast Forward Company Information
7.22.2 Piaggio Fast Forward Introduction and Business Overview
7.22.3 Piaggio Fast Forward Public Service Robot Sales, Revenue and Gross Margin (2019-2024)
7.22.4 Piaggio Fast Forward Public Service Robot Product Offerings
7.22.5 Piaggio Fast Forward Recent Development
7.23 Box Bot
7.23.1 Box Bot Company Information
7.23.2 Box Bot Introduction and Business Overview
7.23.3 Box Bot Public Service Robot Sales, Revenue and Gross Margin (2019-2024)
7.23.4 Box Bot Public Service Robot Product Offerings
7.23.5 Box Bot Recent Development
7.24 Savioke
7.24.1 Savioke Company Information
7.24.2 Savioke Introduction and Business Overview
7.24.3 Savioke Public Service Robot Sales, Revenue and Gross Margin (2019-2024)
7.24.4 Savioke Public Service Robot Product Offerings
7.24.5 Savioke Recent Development
7.25 Dispatch
7.25.1 Dispatch Company Information
7.25.2 Dispatch Introduction and Business Overview
7.25.3 Dispatch Public Service Robot Sales, Revenue and Gross Margin (2019-2024)
7.25.4 Dispatch Public Service Robot Product Offerings
7.25.5 Dispatch Recent Development
7.26 TeleRetail
7.26.1 TeleRetail Company Information
7.26.2 TeleRetail Introduction and Business Overview
7.26.3 TeleRetail Public Service Robot Sales, Revenue and Gross Margin (2019-2024)
7.26.4 TeleRetail Public Service Robot Product Offerings
7.26.5 TeleRetail Recent Development
7.27 Marble
7.27.1 Marble Company Information
7.27.2 Marble Introduction and Business Overview
7.27.3 Marble Public Service Robot Sales, Revenue and Gross Margin (2019-2024)
7.27.4 Marble Public Service Robot Product Offerings
7.27.5 Marble Recent Development
7.28 Nuro
7.28.1 Nuro Company Information
7.28.2 Nuro Introduction and Business Overview
7.28.3 Nuro Public Service Robot Sales, Revenue and Gross Margin (2019-2024)
7.28.4 Nuro Public Service Robot Product Offerings
7.28.5 Nuro Recent Development
7.29 Jingdong
7.29.1 Jingdong Company Information
7.29.2 Jingdong Introduction and Business Overview
7.29.3 Jingdong Public Service Robot Sales, Revenue and Gross Margin (2019-2024)
7.29.4 Jingdong Public Service Robot Product Offerings
7.29.5 Jingdong Recent Development
8 Industry Chain Analysis
8.1 Public Service Robot Industrial Chain
8.2 Public Service Robot Upstream Analysis
8.2.1 Key Raw Materials
8.2.2 Raw Materials Key Suppliers
8.2.3 Manufacturing Cost Structure
8.3 Midstream Analysis
8.4 Downstream Analysis (Customers Analysis)
8.5 Sales Model and Sales Channels
8.5.1 Public Service Robot Sales Model
8.5.2 Sales Channel
8.5.3 Public Service Robot Distributors
9 Research Findings and Conclusion
10 Appendix
10.1 Research Methodology
10.1.1 Methodology/Research Approach
10.1.2 Data Source
10.2 Author Details
10.3 Disclaimer
List of Tables
    Table 1. Public Service Robot Market Trends
    Table 2. Public Service Robot Market Drivers & Opportunity
    Table 3. Public Service Robot Market Challenges
    Table 4. Public Service Robot Market Restraints
    Table 5. Global Public Service Robot Revenue by Company (2019-2024) & (US$ Million)
    Table 6. Global Public Service Robot Revenue Market Share by Company (2019-2024)
    Table 7. Global Public Service Robot Sales Volume by Company (2019-2024) & (Units)
    Table 8. Global Public Service Robot Sales Volume Market Share by Company (2019-2024)
    Table 9. Global Market Public Service Robot Price by Company (2019-2024) & (US$/Unit)
    Table 10. Key Manufacturers Public Service Robot Manufacturing Base Distribution and Headquarters
    Table 11. Key Manufacturers Public Service Robot Product Type
    Table 12. Key Manufacturers Time to Begin Mass Production of Public Service Robot
    Table 13. Global Public Service Robot Manufacturers Market Concentration Ratio (CR5 and HHI)
    Table 14. Global Top Manufacturers Market Share by Company Type (Tier 1, Tier 2, and Tier 3) & (based on the Revenue in Public Service Robot as of 2023)
    Table 15. Mergers & Acquisitions, Expansion Plans
    Table 16. Global Public Service Robot Sales Value by Type: 2019 VS 2023 VS 2030 (US$ Million)
    Table 17. Global Public Service Robot Sales Value by Type (2019-2024) & (US$ Million)
    Table 18. Global Public Service Robot Sales Value by Type (2025-2030) & (US$ Million)
    Table 19. Global Public Service Robot Sales Market Share in Value by Type (2019-2024) & (%)
    Table 20. Global Public Service Robot Sales Market Share in Value by Type (2025-2030) & (%)
    Table 21. Global Public Service Robot Sales Volume by Type: 2019 VS 2023 VS 2030 (Units)
    Table 22. Global Public Service Robot Sales Volume by Type (2019-2024) & (Units)
    Table 23. Global Public Service Robot Sales Volume by Type (2025-2030) & (Units)
    Table 24. Global Public Service Robot Sales Market Share in Volume by Type (2019-2024) & (%)
    Table 25. Global Public Service Robot Sales Market Share in Volume by Type (2025-2030) & (%)
    Table 26. Global Public Service Robot Price by Type (2019-2024) & (US$/Unit)
    Table 27. Global Public Service Robot Price by Type (2025-2030) & (US$/Unit)
    Table 28. Global Public Service Robot Sales Value by Application: 2019 VS 2023 VS 2030 (US$ Million)
    Table 29. Global Public Service Robot Sales Value by Application (2019-2024) & (US$ Million)
    Table 30. Global Public Service Robot Sales Value by Application (2025-2030) & (US$ Million)
    Table 31. Global Public Service Robot Sales Market Share in Value by Application (2019-2024) & (%)
    Table 32. Global Public Service Robot Sales Market Share in Value by Application (2025-2030) & (%)
    Table 33. Global Public Service Robot Sales Volume by Application: 2019 VS 2023 VS 2030 (Units)
    Table 34. Global Public Service Robot Sales Volume by Application (2019-2024) & (Units)
    Table 35. Global Public Service Robot Sales Volume by Application (2025-2030) & (Units)
    Table 36. Global Public Service Robot Sales Market Share in Volume by Application (2019-2024) & (%)
    Table 37. Global Public Service Robot Sales Market Share in Volume by Application (2025-2030) & (%)
    Table 38. Global Public Service Robot Price by Application (2019-2024) & (US$/Unit)
    Table 39. Global Public Service Robot Price by Application (2025-2030) & (US$/Unit)
    Table 40. Global Public Service Robot Sales Value by Region: 2019 VS 2023 VS 2030 (US$ Million)
    Table 41. Global Public Service Robot Sales Value by Region (2019-2024) & (US$ Million)
    Table 42. Global Public Service Robot Sales Value by Region (2025-2030) & (US$ Million)
    Table 43. Global Public Service Robot Sales Value by Region (2019-2024) & (%)
    Table 44. Global Public Service Robot Sales Value by Region (2025-2030) & (%)
    Table 45. Global Public Service Robot Sales Volume by Region (Units): 2019 VS 2023 VS 2030
    Table 46. Global Public Service Robot Sales Volume by Region (2019-2024) & (Units)
    Table 47. Global Public Service Robot Sales Volume by Region (2025-2030) & (Units)
    Table 48. Global Public Service Robot Sales Volume by Region (2019-2024) & (%)
    Table 49. Global Public Service Robot Sales Volume by Region (2025-2030) & (%)
    Table 50. Global Public Service Robot Average Price by Region (2019-2024) & (US$/Unit)
    Table 51. Global Public Service Robot Average Price by Region (2025-2030) & (US$/Unit)
    Table 52. Key Countries/Regions Public Service Robot Sales Value Growth Trends, (US$ Million): 2019 VS 2023 VS 2030
    Table 53. Key Countries/Regions Public Service Robot Sales Value, (2019-2024) & (US$ Million)
    Table 54. Key Countries/Regions Public Service Robot Sales Value, (2025-2030) & (US$ Million)
    Table 55. Key Countries/Regions Public Service Robot Sales Volume, (2019-2024) & (Units)
    Table 56. Key Countries/Regions Public Service Robot Sales Volume, (2025-2030) & (Units)
    Table 57. KUKA (Swisslog) Company Information
    Table 58. KUKA (Swisslog) Introduction and Business Overview
    Table 59. KUKA (Swisslog) Public Service Robot Sales (Units), Revenue (US$ Million), Price (US$/Unit) and Gross Margin (2019-2024)
    Table 60. KUKA (Swisslog) Public Service Robot Product Offerings
    Table 61. KUKA (Swisslog) Recent Development
    Table 62. Daifuku Company Information
    Table 63. Daifuku Introduction and Business Overview
    Table 64. Daifuku Public Service Robot Sales (Units), Revenue (US$ Million), Price (US$/Unit) and Gross Margin (2019-2024)
    Table 65. Daifuku Public Service Robot Product Offerings
    Table 66. Daifuku Recent Development
    Table 67. Knapp Company Information
    Table 68. Knapp Introduction and Business Overview
    Table 69. Knapp Public Service Robot Sales (Units), Revenue (US$ Million), Price (US$/Unit) and Gross Margin (2019-2024)
    Table 70. Knapp Public Service Robot Product Offerings
    Table 71. Knapp Recent Development
    Table 72. Dematic Company Information
    Table 73. Dematic Introduction and Business Overview
    Table 74. Dematic Public Service Robot Sales (Units), Revenue (US$ Million), Price (US$/Unit) and Gross Margin (2019-2024)
    Table 75. Dematic Public Service Robot Product Offerings
    Table 76. Dematic Recent Development
    Table 77. Grenzebach Company Information
    Table 78. Grenzebach Introduction and Business Overview
    Table 79. Grenzebach Public Service Robot Sales (Units), Revenue (US$ Million), Price (US$/Unit) and Gross Margin (2019-2024)
    Table 80. Grenzebach Public Service Robot Product Offerings
    Table 81. Grenzebach Recent Development
    Table 82. Bastian Company Information
    Table 83. Bastian Introduction and Business Overview
    Table 84. Bastian Public Service Robot Sales (Units), Revenue (US$ Million), Price (US$/Unit) and Gross Margin (2019-2024)
    Table 85. Bastian Public Service Robot Product Offerings
    Table 86. Bastian Recent Development
    Table 87. CIM Corp Company Information
    Table 88. CIM Corp Introduction and Business Overview
    Table 89. CIM Corp Public Service Robot Sales (Units), Revenue (US$ Million), Price (US$/Unit) and Gross Margin (2019-2024)
    Table 90. CIM Corp Public Service Robot Product Offerings
    Table 91. CIM Corp Recent Development
    Table 92. Amazon Robotics Company Information
    Table 93. Amazon Robotics Introduction and Business Overview
    Table 94. Amazon Robotics Public Service Robot Sales (Units), Revenue (US$ Million), Price (US$/Unit) and Gross Margin (2019-2024)
    Table 95. Amazon Robotics Public Service Robot Product Offerings
    Table 96. Amazon Robotics Recent Development
    Table 97. Vanderlande Company Information
    Table 98. Vanderlande Introduction and Business Overview
    Table 99. Vanderlande Public Service Robot Sales (Units), Revenue (US$ Million), Price (US$/Unit) and Gross Margin (2019-2024)
    Table 100. Vanderlande Public Service Robot Product Offerings
    Table 101. Vanderlande Recent Development
    Table 102. Vecna Company Information
    Table 103. Vecna Introduction and Business Overview
    Table 104. Vecna Public Service Robot Sales (Units), Revenue (US$ Million), Price (US$/Unit) and Gross Margin (2019-2024)
    Table 105. Vecna Public Service Robot Product Offerings
    Table 106. Vecna Recent Development
    Table 107. Hitachi Company Information
    Table 108. Hitachi Introduction and Business Overview
    Table 109. Hitachi Public Service Robot Sales (Units), Revenue (US$ Million), Price (US$/Unit) and Gross Margin (2019-2024)
    Table 110. Hitachi Public Service Robot Product Offerings
    Table 111. Hitachi Recent Development
    Table 112. Hi-tech Robotic Systemz Company Information
    Table 113. Hi-tech Robotic Systemz Introduction and Business Overview
    Table 114. Hi-tech Robotic Systemz Public Service Robot Sales (Units), Revenue (US$ Million), Price (US$/Unit) and Gross Margin (2019-2024)
    Table 115. Hi-tech Robotic Systemz Public Service Robot Product Offerings
    Table 116. Hi-tech Robotic Systemz Recent Development
    Table 117. Adept Technology Company Information
    Table 118. Adept Technology Introduction and Business Overview
    Table 119. Adept Technology Public Service Robot Sales (Units), Revenue (US$ Million), Price (US$/Unit) and Gross Margin (2019-2024)
    Table 120. Adept Technology Public Service Robot Product Offerings
    Table 121. Adept Technology Recent Development
    Table 122. Grey Orange Company Information
    Table 123. Grey Orange Introduction and Business Overview
    Table 124. Grey Orange Public Service Robot Sales (Units), Revenue (US$ Million), Price (US$/Unit) and Gross Margin (2019-2024)
    Table 125. Grey Orange Public Service Robot Product Offerings
    Table 126. Grey Orange Recent Development
    Table 127. IAM Robotics Company Information
    Table 128. IAM Robotics Introduction and Business Overview
    Table 129. IAM Robotics Public Service Robot Sales (Units), Revenue (US$ Million), Price (US$/Unit) and Gross Margin (2019-2024)
    Table 130. IAM Robotics Public Service Robot Product Offerings
    Table 131. IAM Robotics Recent Development
    Table 132. Fetch Robotics Company Information
    Table 133. Fetch Robotics Introduction and Business Overview
    Table 134. Fetch Robotics Public Service Robot Sales (Units), Revenue (US$ Million), Price (US$/Unit) and Gross Margin (2019-2024)
    Table 135. Fetch Robotics Public Service Robot Product Offerings
    Table 136. Fetch Robotics Recent Development
    Table 137. Starship Technologies Company Information
    Table 138. Starship Technologies Introduction and Business Overview
    Table 139. Starship Technologies Public Service Robot Sales (Units), Revenue (US$ Million), Price (US$/Unit) and Gross Margin (2019-2024)
    Table 140. Starship Technologies Public Service Robot Product Offerings
    Table 141. Starship Technologies Recent Development
    Table 142. Robby Technologies Company Information
    Table 143. Robby Technologies Introduction and Business Overview
    Table 144. Robby Technologies Public Service Robot Sales (Units), Revenue (US$ Million), Price (US$/Unit) and Gross Margin (2019-2024)
    Table 145. Robby Technologies Public Service Robot Product Offerings
    Table 146. Robby Technologies Recent Development
    Table 147. Boston Dynamics Company Information
    Table 148. Boston Dynamics Introduction and Business Overview
    Table 149. Boston Dynamics Public Service Robot Sales (Units), Revenue (US$ Million), Price (US$/Unit) and Gross Margin (2019-2024)
    Table 150. Boston Dynamics Public Service Robot Product Offerings
    Table 151. Boston Dynamics Recent Development
    Table 152. Robomart Company Information
    Table 153. Robomart Introduction and Business Overview
    Table 154. Robomart Public Service Robot Sales (Units), Revenue (US$ Million), Price (US$/Unit) and Gross Margin (2019-2024)
    Table 155. Robomart Public Service Robot Product Offerings
    Table 156. Robomart Recent Development
    Table 157. Eliport Company Information
    Table 158. Eliport Introduction and Business Overview
    Table 159. Eliport Public Service Robot Sales (Units), Revenue (US$ Million), Price (US$/Unit) and Gross Margin (2019-2024)
    Table 160. Eliport Public Service Robot Product Offerings
    Table 161. Eliport Recent Development
    Table 162. Piaggio Fast Forward Company Information
    Table 163. Piaggio Fast Forward Introduction and Business Overview
    Table 164. Piaggio Fast Forward Public Service Robot Sales (Units), Revenue (US$ Million), Price (US$/Unit) and Gross Margin (2019-2024)
    Table 165. Piaggio Fast Forward Public Service Robot Product Offerings
    Table 166. Piaggio Fast Forward Recent Development
    Table 167. Box Bot Company Information
    Table 168. Box Bot Introduction and Business Overview
    Table 169. Box Bot Public Service Robot Sales (Units), Revenue (US$ Million), Price (US$/Unit) and Gross Margin (2019-2024)
    Table 170. Box Bot Public Service Robot Product Offerings
    Table 171. Box Bot Recent Development
    Table 172. Savioke Company Information
    Table 173. Savioke Introduction and Business Overview
    Table 174. Savioke Public Service Robot Sales (Units), Revenue (US$ Million), Price (US$/Unit) and Gross Margin (2019-2024)
    Table 175. Savioke Public Service Robot Product Offerings
    Table 176. Savioke Recent Development
    Table 177. Dispatch Introduction and Business Overview
    Table 178. Dispatch Public Service Robot Sales (Units), Revenue (US$ Million), Price (US$/Unit) and Gross Margin (2019-2024)
    Table 179. Dispatch Public Service Robot Product Offerings
    Table 180. Dispatch Recent Development
    Table 181. Dispatch Company Information
    Table 182. TeleRetail Company Information
    Table 183. TeleRetail Introduction and Business Overview
    Table 184. TeleRetail Public Service Robot Sales (Units), Revenue (US$ Million), Price (US$/Unit) and Gross Margin (2019-2024)
    Table 185. TeleRetail Public Service Robot Product Offerings
    Table 186. TeleRetail Recent Development
    Table 187. Marble Company Information
    Table 188. Marble Introduction and Business Overview
    Table 189. Marble Public Service Robot Sales (Units), Revenue (US$ Million), Price (US$/Unit) and Gross Margin (2019-2024)
    Table 190. Marble Public Service Robot Product Offerings
    Table 191. Marble Recent Development
    Table 192. Nuro Company Information
    Table 193. Nuro Introduction and Business Overview
    Table 194. Nuro Public Service Robot Sales (Units), Revenue (US$ Million), Price (US$/Unit) and Gross Margin (2019-2024)
    Table 195. Nuro Public Service Robot Product Offerings
    Table 196. Nuro Recent Development
    Table 197. Jingdong Company Information
    Table 198. Jingdong Introduction and Business Overview
    Table 199. Jingdong Public Service Robot Sales (Units), Revenue (US$ Million), Price (US$/Unit) and Gross Margin (2019-2024)
    Table 200. Jingdong Public Service Robot Product Offerings
    Table 201. Jingdong Recent Development
    Table 202. Key Raw Materials Lists
    Table 203. Raw Materials Key Suppliers Lists
    Table 204. Public Service Robot Downstream Customers
    Table 205. Public Service Robot Distributors List
    Table 206. Research Programs/Design for This Report
    Table 207. Key Data Information from Secondary Sources
    Table 208. Key Data Information from Primary Sources
List of Figures
    Figure 1. Public Service Robot Product Picture
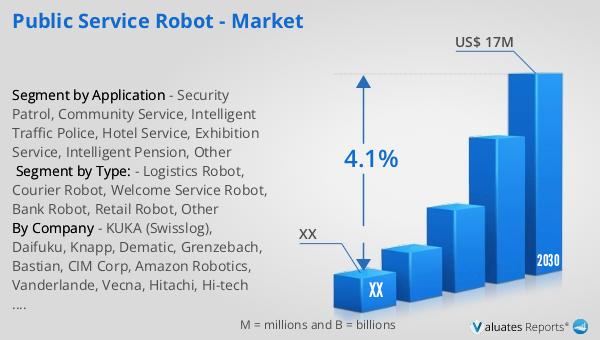
    Figure 2. Global Public Service Robot Sales Value, 2019 VS 2023 VS 2030 (US$ Million)
    Figure 3. Global Public Service Robot Sales Value (2019-2030) & (US$ Million)
    Figure 4. Global Public Service Robot Sales Volume (2019-2030) & (Units)
    Figure 5. Global Public Service Robot Sales Price (2019-2030) & (US$/Unit)
    Figure 6. Public Service Robot Report Years Considered
    Figure 7. Global Public Service Robot Players Revenue Ranking (2023) & (US$ Million)
    Figure 8. Global Public Service Robot Players Sales Volume Ranking (2023) & (Units)
    Figure 9. The 5 and 10 Largest Manufacturers in the World: Market Share by Public Service Robot Revenue in 2023
    Figure 10. Public Service Robot Market Share by Company Type (Tier 1, Tier 2, and Tier 3): 2019 VS 2023
    Figure 11. Logistics Robot Picture
    Figure 12. Courier Robot Picture
    Figure 13. Welcome Service Robot Picture
    Figure 14. Bank Robot Picture
    Figure 15. Retail Robot Picture
    Figure 16. Other Picture
    Figure 17. Global Public Service Robot Sales Value by Type (2019 VS 2023 VS 2030) & (US$ Million)
    Figure 18. Global Public Service Robot Sales Value Market Share by Type, 2023 & 2030
    Figure 19. Global Public Service Robot Sales Volume by Type (2019 VS 2023 VS 2030) & (Units)
    Figure 20. Global Public Service Robot Sales Volume Market Share by Type, 2023 & 2030
    Figure 21. Global Public Service Robot Price by Type (2019-2030) & (US$/Unit)
    Figure 22. Product Picture of Security Patrol
    Figure 23. Product Picture of Community Service
    Figure 24. Product Picture of Intelligent Traffic Police
    Figure 25. Product Picture of Hotel Service
    Figure 26. Product Picture of Exhibition Service
    Figure 27. Product Picture of Intelligent Pension
    Figure 28. Product Picture of Other
    Figure 29. Global Public Service Robot Sales Value by Application (2019 VS 2023 VS 2030) & (US$ Million)
    Figure 30. Global Public Service Robot Sales Value Market Share by Application, 2023 & 2030
    Figure 31. Global Public Service Robot Sales Volume by Application (2019 VS 2023 VS 2030) & (Units)
    Figure 32. Global Public Service Robot Sales Volume Market Share by Application, 2023 & 2030
    Figure 33. Global Public Service Robot Price by Application (2019-2030) & (US$/Unit)
    Figure 34. North America Public Service Robot Sales Value (2019-2030) & (US$ Million)
    Figure 35. North America Public Service Robot Sales Value by Country (%), 2023 VS 2030
    Figure 36. Europe Public Service Robot Sales Value (2019-2030) & (US$ Million)
    Figure 37. Europe Public Service Robot Sales Value by Country (%), 2023 VS 2030
    Figure 38. Asia Pacific Public Service Robot Sales Value (2019-2030) & (US$ Million)
    Figure 39. Asia Pacific Public Service Robot Sales Value by Country (%), 2023 VS 2030
    Figure 40. South America Public Service Robot Sales Value (2019-2030) & (US$ Million)
    Figure 41. South America Public Service Robot Sales Value by Country (%), 2023 VS 2030
    Figure 42. Middle East & Africa Public Service Robot Sales Value (2019-2030) & (US$ Million)
    Figure 43. Middle East & Africa Public Service Robot Sales Value by Country (%), 2023 VS 2030
    Figure 44. Key Countries/Regions Public Service Robot Sales Value (%), (2019-2030)
    Figure 45. Key Countries/Regions Public Service Robot Sales Volume (%), (2019-2030)
    Figure 46. United States Public Service Robot Sales Value, (2019-2030) & (US$ Million)
    Figure 47. United States Public Service Robot Sales Value by Type (%), 2023 VS 2030
    Figure 48. United States Public Service Robot Sales Value by Application (%), 2023 VS 2030
    Figure 49. Europe Public Service Robot Sales Value, (2019-2030) & (US$ Million)
    Figure 50. Europe Public Service Robot Sales Value by Type (%), 2023 VS 2030
    Figure 51. Europe Public Service Robot Sales Value by Application (%), 2023 VS 2030
    Figure 52. China Public Service Robot Sales Value, (2019-2030) & (US$ Million)
    Figure 53. China Public Service Robot Sales Value by Type (%), 2023 VS 2030
    Figure 54. China Public Service Robot Sales Value by Application (%), 2023 VS 2030
    Figure 55. Japan Public Service Robot Sales Value, (2019-2030) & (US$ Million)
    Figure 56. Japan Public Service Robot Sales Value by Type (%), 2023 VS 2030
    Figure 57. Japan Public Service Robot Sales Value by Application (%), 2023 VS 2030
    Figure 58. South Korea Public Service Robot Sales Value, (2019-2030) & (US$ Million)
    Figure 59. South Korea Public Service Robot Sales Value by Type (%), 2023 VS 2030
    Figure 60. South Korea Public Service Robot Sales Value by Application (%), 2023 VS 2030
    Figure 61. Southeast Asia Public Service Robot Sales Value, (2019-2030) & (US$ Million)
    Figure 62. Southeast Asia Public Service Robot Sales Value by Type (%), 2023 VS 2030
    Figure 63. Southeast Asia Public Service Robot Sales Value by Application (%), 2023 VS 2030
    Figure 64. India Public Service Robot Sales Value, (2019-2030) & (US$ Million)
    Figure 65. India Public Service Robot Sales Value by Type (%), 2023 VS 2030
    Figure 66. India Public Service Robot Sales Value by Application (%), 2023 VS 2030
    Figure 67. Public Service Robot Industrial Chain
    Figure 68. Public Service Robot Manufacturing Cost Structure
    Figure 69. Channels of Distribution (Direct Sales, and Distribution)
    Figure 70. Bottom-up and Top-down Approaches for This Report
    Figure 71. Data Triangulation
    Figure 72. Key Executives Interviewed
SELECT A FORMAT
Added to Cart
Electronic (PDF)

$3950

This license allows only one user to access the PDF.
Electronic (PDF)

$5925

This license allows 1 - 5 user to access the PDF, license is suitable for small groups of 5 users working together
Electronic (PDF)

$7900

This license allows users/teams in a same Enterprise to use this report, various departments within an enterpise can use this report
Add to Cart
Buy Now (15% Discount)

OUR CUSTOMER

Bioinformatics Barcelona

RELATED REPORTS

Global High Precision Probe Station Market Research Report 2025

120 Pages
Type: Report
Code: QYRE-Auto-25F19592
Fri Sep 12 00:00:00 UTC 2025

Add to Cart

Global MCR Based Static VAR Compensator Market Research Report 2025

120 Pages
Type: Report
Code: QYRE-Auto-22W19666
Fri Sep 12 00:00:00 UTC 2025

Add to Cart

Global Channel Impeller Pump Market Research Report 2025

120 Pages
Type: Report
Code: QYRE-Auto-39T19646
Fri Sep 12 00:00:00 UTC 2025

Add to Cart

Global Geometric Precision Instrument Market Research Report 2025

120 Pages
Type: Report
Code: QYRE-Auto-11L19943
Fri Sep 12 00:00:00 UTC 2025

Add to Cart