List of Tables
Table 1. Global Medical Wellness Market Size Growth Rate by Type (US$ Million): 2021 vs 2025 vs 2032
Table 2. Key Players of Complementary and Alternative Medicine
Table 3. Key Players of Beauty Care and Anti-Aging
Table 4. Key Players of Preventative, Personalized Medicine and Public Health
Table 5. Key Players of Healthy Eating, Nutrition and Weight Loss
Table 6. Key Players of Rejuvenation
Table 7. Key Players of Other
Table 8. Global Medical Wellness Market Size Growth Rate by Service Type (US$ Million): 2021 vs 2025 vs 2032
Table 9. Key Players of Preventive Healthcare
Table 10. Key Players of Rehabilitation & Functional Medicine
Table 11. Key Players of Holistic Health Management
Table 12. Key Players of Anti-aging & Regenerative Medicine
Table 13. Global Medical Wellness Market Size Growth Rate by Target Population (US$ Million): 2021 vs 2025 vs 2032
Table 14. Key Players of Young & Middle-aged Adults
Table 15. Key Players of Elderly Population
Table 16. Key Players of Special Populations
Table 17. Key Players of Other
Table 18. Global Medical Wellness Market Size Growth by Application (US$ Million): 2021 vs 2025 vs 2032
Table 19. Global Medical Wellness Market Size by Region (US$ Million): 2021 vs 2025 vs 2032
Table 20. Global Medical Wellness Market Size by Region (US$ Million), 2021–2026
Table 21. Global Medical Wellness Market Share by Region (2021–2026)
Table 22. Global Medical Wellness Forecasted Market Size by Region (US$ Million), 2027–2032
Table 23. Global Medical Wellness Market Share by Region (2027–2032)
Table 24. Medical Wellness Market Trends
Table 25. Medical Wellness Market Drivers
Table 26. Medical Wellness Market Challenges
Table 27. Medical Wellness Market Restraints
Table 28. Global Medical Wellness Revenue by Players (US$ Million), 2021–2026
Table 29. Global Medical Wellness Market Share by Players (2021–2026)
Table 30. Global Top Medical Wellness Players by Tier (Tier 1, Tier 2, and Tier 3), based on Medical Wellness Revenue, 2025
Table 31. Ranking of Global Top Medical Wellness Companies by Revenue (US$ Million) in 2025
Table 32. Global 5 Largest Players Market Share by Medical Wellness Revenue (CR5 and HHI), 2021–2026
Table 33. Global Key Players of Medical Wellness, Headquarters and Area Served
Table 34. Global Key Players of Medical Wellness, Products and Applications
Table 35. Global Key Players of Medical Wellness, Date of General Availability (GA)
Table 36. Mergers and Acquisitions, Expansion Plans
Table 37. Global Medical Wellness Market Size by Type (US$ Million), 2021–2026
Table 38. Global Medical Wellness Revenue Market Share by Type (2021–2026)
Table 39. Global Medical Wellness Forecasted Market Size by Type (US$ Million), 2027–2032
Table 40. Global Medical Wellness Revenue Market Share by Type (2027–2032)
Table 41. Global Medical Wellness Market Size by Application (US$ Million), 2021–2026
Table 42. Global Medical Wellness Revenue Market Share by Application (2021–2026)
Table 43. Global Medical Wellness Forecasted Market Size by Application (US$ Million), 2027–2032
Table 44. Global Medical Wellness Revenue Market Share by Application (2027–2032)
Table 45. North America Medical Wellness Market Size Growth Rate by Country (US$ Million): 2021 vs 2025 vs 2032
Table 46. North America Medical Wellness Market Size by Country (US$ Million), 2021–2026
Table 47. North America Medical Wellness Market Size by Country (US$ Million), 2027–2032
Table 48. Europe Medical Wellness Market Size Growth Rate by Country (US$ Million): 2021 vs 2025 vs 2032
Table 49. Europe Medical Wellness Market Size by Country (US$ Million), 2021–2026
Table 50. Europe Medical Wellness Market Size by Country (US$ Million), 2027–2032
Table 51. Asia-Pacific Medical Wellness Market Size Growth Rate by Region (US$ Million): 2021 vs 2025 vs 2032
Table 52. Asia-Pacific Medical Wellness Market Size by Region (US$ Million), 2021–2026
Table 53. Asia-Pacific Medical Wellness Market Size by Region (US$ Million), 2027–2032
Table 54. Latin America Medical Wellness Market Size Growth Rate by Country (US$ Million): 2021 vs 2025 vs 2032
Table 55. Latin America Medical Wellness Market Size by Country (US$ Million), 2021–2026
Table 56. Latin America Medical Wellness Market Size by Country (US$ Million), 2027–2032
Table 57. Middle East & Africa Medical Wellness Market Size Growth Rate by Country (US$ Million): 2021 vs 2025 vs 2032
Table 58. Middle East & Africa Medical Wellness Market Size by Country (US$ Million), 2021–2026
Table 59. Middle East & Africa Medical Wellness Market Size by Country (US$ Million), 2027–2032
Table 60. Massage Envy Company Details
Table 61. Massage Envy Business Overview
Table 62. Massage Envy Medical Wellness Product
Table 63. Massage Envy Revenue in Medical Wellness Business (US$ Million), 2021–2026
Table 64. Massage Envy Recent Development
Table 65. Steiner Leisure Limited Company Details
Table 66. Steiner Leisure Limited Business Overview
Table 67. Steiner Leisure Limited Medical Wellness Product
Table 68. Steiner Leisure Limited Revenue in Medical Wellness Business (US$ Million), 2021–2026
Table 69. Steiner Leisure Limited Recent Development
Table 70. World Gym Company Details
Table 71. World Gym Business Overview
Table 72. World Gym Medical Wellness Product
Table 73. World Gym Revenue in Medical Wellness Business (US$ Million), 2021–2026
Table 74. World Gym Recent Development
Table 75. Fitness World Company Details
Table 76. Fitness World Business Overview
Table 77. Fitness World Medical Wellness Product
Table 78. Fitness World Revenue in Medical Wellness Business (US$ Million), 2021–2026
Table 79. Fitness World Recent Development
Table 80. Universal Companies Company Details
Table 81. Universal Companies Business Overview
Table 82. Universal Companies Medical Wellness Product
Table 83. Universal Companies Revenue in Medical Wellness Business (US$ Million), 2021–2026
Table 84. Universal Companies Recent Development
Table 85. Beauty Farm Company Details
Table 86. Beauty Farm Business Overview
Table 87. Beauty Farm Medical Wellness Product
Table 88. Beauty Farm Revenue in Medical Wellness Business (US$ Million), 2021–2026
Table 89. Beauty Farm Recent Development
Table 90. VLCC Wellness Center Company Details
Table 91. VLCC Wellness Center Business Overview
Table 92. VLCC Wellness Center Medical Wellness Product
Table 93. VLCC Wellness Center Revenue in Medical Wellness Business (US$ Million), 2021–2026
Table 94. VLCC Wellness Center Recent Development
Table 95. Nanjing Zhaohui Company Details
Table 96. Nanjing Zhaohui Business Overview
Table 97. Nanjing Zhaohui Medical Wellness Product
Table 98. Nanjing Zhaohui Revenue in Medical Wellness Business (US$ Million), 2021–2026
Table 99. Nanjing Zhaohui Recent Development
Table 100. Edge Systems LLC Company Details
Table 101. Edge Systems LLC Business Overview
Table 102. Edge Systems LLC Medical Wellness Product
Table 103. Edge Systems LLC Revenue in Medical Wellness Business (US$ Million), 2021–2026
Table 104. Edge Systems LLC Recent Development
Table 105. HEALING HOTELS OF THE WORLD Company Details
Table 106. HEALING HOTELS OF THE WORLD Business Overview
Table 107. HEALING HOTELS OF THE WORLD Medical Wellness Product
Table 108. HEALING HOTELS OF THE WORLD Revenue in Medical Wellness Business (US$ Million), 2021–2026
Table 109. HEALING HOTELS OF THE WORLD Recent Development
Table 110. Gold's Gym International Company Details
Table 111. Gold's Gym International Business Overview
Table 112. Gold's Gym International Medical Wellness Product
Table 113. Gold's Gym International Revenue in Medical Wellness Business (US$ Million), 2021–2026
Table 114. Gold's Gym International Recent Development
Table 115. Bon Vital Company Details
Table 116. Bon Vital Business Overview
Table 117. Bon Vital Medical Wellness Product
Table 118. Bon Vital Revenue in Medical Wellness Business (US$ Million), 2021–2026
Table 119. Bon Vital Recent Development
Table 120. Kaya Skin Clinic Company Details
Table 121. Kaya Skin Clinic Business Overview
Table 122. Kaya Skin Clinic Medical Wellness Product
Table 123. Kaya Skin Clinic Revenue in Medical Wellness Business (US$ Million), 2021–2026
Table 124. Kaya Skin Clinic Recent Development
Table 125. The Body Holiday Company Details
Table 126. The Body Holiday Business Overview
Table 127. The Body Holiday Medical Wellness Product
Table 128. The Body Holiday Revenue in Medical Wellness Business (US$ Million), 2021–2026
Table 129. The Body Holiday Recent Development
Table 130. Kayco Vivid Company Details
Table 131. Kayco Vivid Business Overview
Table 132. Kayco Vivid Medical Wellness Product
Table 133. Kayco Vivid Revenue in Medical Wellness Business (US$ Million), 2021–2026
Table 134. Kayco Vivid Recent Development
Table 135. Arashiyu Japanese Foot Spa Company Details
Table 136. Arashiyu Japanese Foot Spa Business Overview
Table 137. Arashiyu Japanese Foot Spa Medical Wellness Product
Table 138. Arashiyu Japanese Foot Spa Revenue in Medical Wellness Business (US$ Million), 2021–2026
Table 139. Arashiyu Japanese Foot Spa Recent Development
Table 140. Enrich Hair & Skin Company Details
Table 141. Enrich Hair & Skin Business Overview
Table 142. Enrich Hair & Skin Medical Wellness Product
Table 143. Enrich Hair & Skin Revenue in Medical Wellness Business (US$ Million), 2021–2026
Table 144. Enrich Hair & Skin Recent Development
Table 145. WTS International Company Details
Table 146. WTS International Business Overview
Table 147. WTS International Medical Wellness Product
Table 148. WTS International Revenue in Medical Wellness Business (US$ Million), 2021–2026
Table 149. WTS International Recent Development
Table 150. Biologique Recherche Company Details
Table 151. Biologique Recherche Business Overview
Table 152. Biologique Recherche Medical Wellness Product
Table 153. Biologique Recherche Revenue in Medical Wellness Business (US$ Million), 2021–2026
Table 154. Biologique Recherche Recent Development
Table 155. Guardian Lifecare Company Details
Table 156. Guardian Lifecare Business Overview
Table 157. Guardian Lifecare Medical Wellness Product
Table 158. Guardian Lifecare Revenue in Medical Wellness Business (US$ Million), 2021–2026
Table 159. Guardian Lifecare Recent Development
Table 160. Healthkart Company Details
Table 161. Healthkart Business Overview
Table 162. Healthkart Medical Wellness Product
Table 163. Healthkart Revenue in Medical Wellness Business (US$ Million), 2021–2026
Table 164. Healthkart Recent Development
Table 165. Research Programs/Design for This Report
Table 166. Key Data Information from Secondary Sources
Table 167. Key Data Information from Primary Sources
Table 168. Authors List of This Report
List of Figures
Figure 1. Medical Wellness Picture
Figure 2. Global Medical Wellness Market Size Comparison by Type (US$ Million), 2021–2032
Figure 3. Global Medical Wellness Market Share by Type: 2025 vs 2032
Figure 4. Complementary and Alternative Medicine Features
Figure 5. Beauty Care and Anti-Aging Features
Figure 6. Preventative, Personalized Medicine and Public Health Features
Figure 7. Healthy Eating, Nutrition and Weight Loss Features
Figure 8. Rejuvenation Features
Figure 9. Other Features
Figure 10. Global Medical Wellness Market Size Comparison by Service Type (US$ Million), 2021–2032
Figure 11. Preventive Healthcare Features
Figure 12. Rehabilitation & Functional Medicine Features
Figure 13. Holistic Health Management Features
Figure 14. Anti-aging & Regenerative Medicine Features
Figure 15. Global Medical Wellness Market Size Comparison by Target Population (US$ Million), 2021–2032
Figure 16. Young & Middle-aged Adults Features
Figure 17. Elderly Population Features
Figure 18. Special Populations Features
Figure 19. Other Features
Figure 20. Global Medical Wellness Market Size by Application (US$ Million), 2021–2032
Figure 21. Global Medical Wellness Market Share by Application: 2025 vs 2032
Figure 22. Franchise Case Studies
Figure 23. Company Owned Outlets Case Studies
Figure 24. Medical Wellness Report Years Considered
Figure 25. Global Medical Wellness Market Size (US$ Million), Year-over-Year: 2021–2032
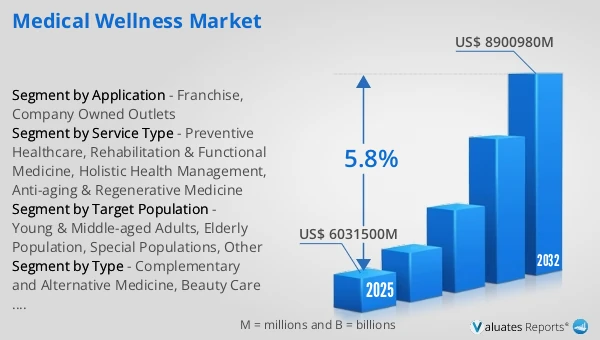
Figure 26. Global Medical Wellness Market Size, (US$ Million), 2021 vs 2025 vs 2032
Figure 27. Global Medical Wellness Market Share by Region: 2025 vs 2032
Figure 28. Global Medical Wellness Market Share by Players in 2025
Figure 29. Global Medical Wellness Market Share by Company Type (Tier 1, Tier 2, and Tier 3)
Figure 30. The Top 10 and 5 Players Market Share by Medical Wellness Revenue in 2025
Figure 31. North America Medical Wellness Market Size YoY Growth (US$ Million), 2021–2032
Figure 32. North America Medical Wellness Market Share by Country (2021–2032)
Figure 33. United States Medical Wellness Market Size YoY Growth (US$ Million), 2021–2032
Figure 34. Canada Medical Wellness Market Size YoY Growth (US$ Million), 2021–2032
Figure 35. Europe Medical Wellness Market Size YoY Growth (US$ Million), 2021–2032
Figure 36. Europe Medical Wellness Market Share by Country (2021–2032)
Figure 37. Germany Medical Wellness Market Size YoY Growth (US$ Million), 2021–2032
Figure 38. France Medical Wellness Market Size YoY Growth (US$ Million), 2021–2032
Figure 39. U.K. Medical Wellness Market Size YoY Growth (US$ Million), 2021–2032
Figure 40. Italy Medical Wellness Market Size YoY Growth (US$ Million), 2021–2032
Figure 41. Russia Medical Wellness Market Size YoY Growth (US$ Million), 2021–2032
Figure 42. Ireland Medical Wellness Market Size YoY Growth (US$ Million), 2021–2032
Figure 43. Asia-Pacific Medical Wellness Market Size YoY Growth (US$ Million), 2021–2032
Figure 44. Asia-Pacific Medical Wellness Market Share by Region (2021–2032)
Figure 45. China Medical Wellness Market Size YoY Growth (US$ Million), 2021–2032
Figure 46. Japan Medical Wellness Market Size YoY Growth (US$ Million), 2021–2032
Figure 47. South Korea Medical Wellness Market Size YoY Growth (US$ Million), 2021–2032
Figure 48. Southeast Asia Medical Wellness Market Size YoY Growth (US$ Million), 2021–2032
Figure 49. India Medical Wellness Market Size YoY Growth (US$ Million), 2021–2032
Figure 50. Australia & New Zealand Medical Wellness Market Size YoY Growth (US$ Million), 2021–2032
Figure 51. Latin America Medical Wellness Market Size YoY Growth (US$ Million), 2021–2032
Figure 52. Latin America Medical Wellness Market Share by Country (2021–2032)
Figure 53. Mexico Medical Wellness Market Size YoY Growth (US$ Million), 2021–2032
Figure 54. Brazil Medical Wellness Market Size YoY Growth (US$ Million), 2021–2032
Figure 55. Middle East & Africa Medical Wellness Market Size YoY Growth (US$ Million), 2021–2032
Figure 56. Middle East & Africa Medical Wellness Market Share by Country (2021–2032)
Figure 57. Israel Medical Wellness Market Size YoY Growth (US$ Million), 2021–2032
Figure 58. Saudi Arabia Medical Wellness Market Size YoY Growth (US$ Million), 2021–2032
Figure 59. UAE Medical Wellness Market Size YoY Growth (US$ Million), 2021–2032
Figure 60. Massage Envy Revenue Growth Rate in Medical Wellness Business (2021–2026)
Figure 61. Steiner Leisure Limited Revenue Growth Rate in Medical Wellness Business (2021–2026)
Figure 62. World Gym Revenue Growth Rate in Medical Wellness Business (2021–2026)
Figure 63. Fitness World Revenue Growth Rate in Medical Wellness Business (2021–2026)
Figure 64. Universal Companies Revenue Growth Rate in Medical Wellness Business (2021–2026)
Figure 65. Beauty Farm Revenue Growth Rate in Medical Wellness Business (2021–2026)
Figure 66. VLCC Wellness Center Revenue Growth Rate in Medical Wellness Business (2021–2026)
Figure 67. Nanjing Zhaohui Revenue Growth Rate in Medical Wellness Business (2021–2026)
Figure 68. Edge Systems LLC Revenue Growth Rate in Medical Wellness Business (2021–2026)
Figure 69. HEALING HOTELS OF THE WORLD Revenue Growth Rate in Medical Wellness Business (2021–2026)
Figure 70. Gold's Gym International Revenue Growth Rate in Medical Wellness Business (2021–2026)
Figure 71. Bon Vital Revenue Growth Rate in Medical Wellness Business (2021–2026)
Figure 72. Kaya Skin Clinic Revenue Growth Rate in Medical Wellness Business (2021–2026)
Figure 73. The Body Holiday Revenue Growth Rate in Medical Wellness Business (2021–2026)
Figure 74. Kayco Vivid Revenue Growth Rate in Medical Wellness Business (2021–2026)
Figure 75. Arashiyu Japanese Foot Spa Revenue Growth Rate in Medical Wellness Business (2021–2026)
Figure 76. Enrich Hair & Skin Revenue Growth Rate in Medical Wellness Business (2021–2026)
Figure 77. WTS International Revenue Growth Rate in Medical Wellness Business (2021–2026)
Figure 78. Biologique Recherche Revenue Growth Rate in Medical Wellness Business (2021–2026)
Figure 79. Guardian Lifecare Revenue Growth Rate in Medical Wellness Business (2021–2026)
Figure 80. Healthkart Revenue Growth Rate in Medical Wellness Business (2021–2026)
Figure 81. Bottom-up and Top-down Approaches for This Report
Figure 82. Data Triangulation
Figure 83. Key Executives Interviewed