List of Tables
Table 1. Global Market Interactive Patient Care Systems (IPC) Software Market Size (US$ Million) Comparison by Region 2018 VS 2022 VS 2029
Table 2. Global Interactive Patient Care Systems (IPC) Software Market Size by Region (2018-2023) & (US$ Million)
Table 3. Global Interactive Patient Care Systems (IPC) Software Market Size Share by Region (2018-2023)
Table 4. Global Interactive Patient Care Systems (IPC) Software Forecasted Market Size by Region (2024-2029) & (US$ Million)
Table 5. Global Interactive Patient Care Systems (IPC) Software Forecasted Market Size Share by Region (2024-2029)
Table 6. Global Interactive Patient Care Systems (IPC) Software Market Size (US$ Million) by Type: 2018 VS 2022 VS 2029
Table 7. Global Interactive Patient Care Systems (IPC) Software Market Size by Type (2018-2023) & (US$ Million)
Table 8. Global Interactive Patient Care Systems (IPC) Software Revenue Market Share by Type (2018-2023)
Table 9. Global Interactive Patient Care Systems (IPC) Software Forecasted Market Size by Type (2024-2029) & (US$ Million)
Table 10. Global Interactive Patient Care Systems (IPC) Software Revenue Market Share by Type (2024-2029)
Table 11. North America Interactive Patient Care Systems (IPC) Software Revenue by Type (2018-2023) & (US$ Million)
Table 12. North America Interactive Patient Care Systems (IPC) Software Revenue by Type (2024-2029) & (US$ Million)
Table 13. Europe Interactive Patient Care Systems (IPC) Software Revenue by Type (2018-2023) & (US$ Million)
Table 14. Europe Interactive Patient Care Systems (IPC) Software Revenue by Type (2024-2029) & (US$ Million)
Table 15. Asia-Pacific Interactive Patient Care Systems (IPC) Software Revenue by Type (2018-2023) & (US$ Million)
Table 16. Asia-Pacific Interactive Patient Care Systems (IPC) Software Revenue by Type (2024-2029) & (US$ Million)
Table 17. Latin America Interactive Patient Care Systems (IPC) Software Revenue by Type (2018-2023) & (US$ Million)
Table 18. Latin America Interactive Patient Care Systems (IPC) Software Revenue by Type (2024-2029) & (US$ Million)
Table 19. Middle East and Africa Interactive Patient Care Systems (IPC) Software Revenue by Type (2018-2023) & (US$ Million)
Table 20. Middle East and Africa Interactive Patient Care Systems (IPC) Software Revenue by Type (2024-2029) & (US$ Million)
Table 21. Global Interactive Patient Care Systems (IPC) Software Market Size (US$ Million) by Application: 2018 VS 2022 VS 2029
Table 22. Global Interactive Patient Care Systems (IPC) Software Market Size by Application (2018-2023) & (US$ Million)
Table 23. Global Interactive Patient Care Systems (IPC) Software Revenue Market Share by Application (2018-2023)
Table 24. Global Interactive Patient Care Systems (IPC) Software Forecasted Market Size by Application (2024-2029) & (US$ Million)
Table 25. Global Interactive Patient Care Systems (IPC) Software Revenue Market Share by Application (2024-2029)
Table 26. North America Interactive Patient Care Systems (IPC) Software Revenue by Application (2018-2023) & (US$ Million)
Table 27. North America Interactive Patient Care Systems (IPC) Software Revenue by Application (2024-2029) & (US$ Million)
Table 28. Europe Interactive Patient Care Systems (IPC) Software Revenue by Application (2018-2023) & (US$ Million)
Table 29. Europe Interactive Patient Care Systems (IPC) Software Revenue by Application (2024-2029) & (US$ Million)
Table 30. Asia-Pacific Interactive Patient Care Systems (IPC) Software Revenue by Application (2018-2023) & (US$ Million)
Table 31. Asia-Pacific Interactive Patient Care Systems (IPC) Software Revenue by Application (2024-2029) & (US$ Million)
Table 32. Latin America Interactive Patient Care Systems (IPC) Software Revenue by Application (2018-2023) & (US$ Million)
Table 33. Latin America Interactive Patient Care Systems (IPC) Software Revenue by Application (2024-2029) & (US$ Million)
Table 34. Middle East and Africa Interactive Patient Care Systems (IPC) Software Revenue by Application (2018-2023) & (US$ Million)
Table 35. Middle East and Africa Interactive Patient Care Systems (IPC) Software Revenue by Application (2024-2029) & (US$ Million)
Table 36. Global Interactive Patient Care Systems (IPC) Software Revenue (US$ Million) by Players (2018-2023)
Table 37. Global Interactive Patient Care Systems (IPC) Software Revenue Market Share by Players (2018-2023)
Table 38. Global Top Players Market Share by Company Type (Tier 1, Tier 2 and Tier 3) & (based on the Revenue in Interactive Patient Care Systems (IPC) Software as of 2022)
Table 39. Date of Key Players Enter into Interactive Patient Care Systems (IPC) Software Market
Table 40. Global Interactive Patient Care Systems (IPC) Software Key Players Headquarters and Area Served
Table 41. Interactive Patient Care Systems (IPC) Software Product Solution and Service
Table 42. Global Interactive Patient Care Systems (IPC) Software Players Market Concentration Ratio (CR5 and HHI)
Table 43. Mergers & Acquisitions, Expansion Plans
Table 44. Access Care Planning (formerly Mobizio) Basic Information List
Table 45. Access Care Planning (formerly Mobizio) Description and Business Overview
Table 46. Access Care Planning (formerly Mobizio) Interactive Patient Care Systems (IPC) Software Products, Services and Solutions
Table 47. Revenue (US$ Million) in Interactive Patient Care Systems (IPC) Software Business of Access Care Planning (formerly Mobizio) (2018-2023)
Table 48. Access Care Planning (formerly Mobizio) Recent Developments
Table 49. Cerner Basic Information List
Table 50. Cerner Description and Business Overview
Table 51. Cerner Interactive Patient Care Systems (IPC) Software Products, Services and Solutions
Table 52. Revenue (US$ Million) in Interactive Patient Care Systems (IPC) Software Business of Cerner (2018-2023)
Table 53. Cerner Recent Developments
Table 54. CloudDX Clinic Vitals Basic Information List
Table 55. CloudDX Clinic Vitals Description and Business Overview
Table 56. CloudDX Clinic Vitals Interactive Patient Care Systems (IPC) Software Products, Services and Solutions
Table 57. Revenue (US$ Million) in Interactive Patient Care Systems (IPC) Software Business of CloudDX Clinic Vitals (2018-2023)
Table 58. CloudDX Clinic Vitals Recent Developments
Table 59. Consult-PRO Chairside Suite Basic Information List
Table 60. Consult-PRO Chairside Suite Description and Business Overview
Table 61. Consult-PRO Chairside Suite Interactive Patient Care Systems (IPC) Software Products, Services and Solutions
Table 62. Revenue (US$ Million) in Interactive Patient Care Systems (IPC) Software Business of Consult-PRO Chairside Suite (2018-2023)
Table 63. Consult-PRO Chairside Suite Recent Developments
Table 64. Epic Basic Information List
Table 65. Epic Description and Business Overview
Table 66. Epic Interactive Patient Care Systems (IPC) Software Products, Services and Solutions
Table 67. Revenue (US$ Million) in Interactive Patient Care Systems (IPC) Software Business of Epic (2018-2023)
Table 68. Epic Recent Developments
Table 69. GetWellNetwork Basic Information List
Table 70. GetWellNetwork Description and Business Overview
Table 71. GetWellNetwork Interactive Patient Care Systems (IPC) Software Products, Services and Solutions
Table 72. Revenue (US$ Million) in Interactive Patient Care Systems (IPC) Software Business of GetWellNetwork (2018-2023)
Table 73. GetWellNetwork Recent Developments
Table 74. Happytal Basic Information List
Table 75. Happytal Description and Business Overview
Table 76. Happytal Interactive Patient Care Systems (IPC) Software Products, Services and Solutions
Table 77. Revenue (US$ Million) in Interactive Patient Care Systems (IPC) Software Business of Happytal (2018-2023)
Table 78. Happytal Recent Developments
Table 79. OneView Basic Information List
Table 80. OneView Description and Business Overview
Table 81. OneView Interactive Patient Care Systems (IPC) Software Products, Services and Solutions
Table 82. Revenue (US$ Million) in Interactive Patient Care Systems (IPC) Software Business of OneView (2018-2023)
Table 83. OneView Recent Developments
Table 84. Optum Basic Information List
Table 85. Optum Description and Business Overview
Table 86. Optum Interactive Patient Care Systems (IPC) Software Products, Services and Solutions
Table 87. Revenue (US$ Million) in Interactive Patient Care Systems (IPC) Software Business of Optum (2018-2023)
Table 88. Optum Recent Developments
Table 89. Oscar Senior Basic Information List
Table 90. Oscar Senior Description and Business Overview
Table 91. Oscar Senior Interactive Patient Care Systems (IPC) Software Products, Services and Solutions
Table 92. Revenue (US$ Million) in Interactive Patient Care Systems (IPC) Software Business of Oscar Senior (2018-2023)
Table 93. Oscar Senior Recent Developments
Table 94. pCare Basic Information List
Table 95. pCare Description and Business Overview
Table 96. pCare Interactive Patient Care Systems (IPC) Software Products, Services and Solutions
Table 97. Revenue (US$ Million) in Interactive Patient Care Systems (IPC) Software Business of pCare (2018-2023)
Table 98. pCare Recent Developments
Table 99. Vocera Care Experience Basic Information List
Table 100. Vocera Care Experience Description and Business Overview
Table 101. Vocera Care Experience Interactive Patient Care Systems (IPC) Software Products, Services and Solutions
Table 102. Revenue (US$ Million) in Interactive Patient Care Systems (IPC) Software Business of Vocera Care Experience (2018-2023)
Table 103. Vocera Care Experience Recent Developments
Table 104. North America Interactive Patient Care Systems (IPC) Software Market Size by Country (2018-2023) & (US$ Million)
Table 105. North America Interactive Patient Care Systems (IPC) Software Market Size by Country (2024-2029) & (US$ Million)
Table 106. Europe Interactive Patient Care Systems (IPC) Software Market Size by Country (2018-2023) & (US$ Million)
Table 107. Europe Interactive Patient Care Systems (IPC) Software Market Size by Country (2024-2029) & (US$ Million)
Table 108. Asia-Pacific Interactive Patient Care Systems (IPC) Software Market Size Growth Rate (CAGR) by Region (US$ Million): 2018 VS 2022 VS 2029
Table 109. Asia-Pacific Interactive Patient Care Systems (IPC) Software Market Size by Region (2018-2023) & (US$ Million)
Table 110. Asia-Pacific Interactive Patient Care Systems (IPC) Software Market Size by Region (2024-2029) & (US$ Million)
Table 111. Asia-Pacific Interactive Patient Care Systems (IPC) Software Market Share by Region (2018-2023)
Table 112. Asia-Pacific Interactive Patient Care Systems (IPC) Software Market Share by Region (2024-2029)
Table 113. Latin America Interactive Patient Care Systems (IPC) Software Market Size Growth Rate (CAGR) by Region (US$ Million): 2018 VS 2022 VS 2029
Table 114. Latin America Interactive Patient Care Systems (IPC) Software Market Size by Country (2018-2023) & (US$ Million)
Table 115. Latin America Interactive Patient Care Systems (IPC) Software Market Size by Country (2024-2029) & (US$ Million)
Table 116. Middle East & Africa Interactive Patient Care Systems (IPC) Software Market Size Growth Rate (CAGR) by Region (US$ Million): 2018 VS 2022 VS 2029
Table 117. Middle East & Africa Interactive Patient Care Systems (IPC) Software Market Size by Country (2018-2023) & (US$ Million)
Table 118. Middle East & Africa Interactive Patient Care Systems (IPC) Software Market Size by Country (2024-2029) & (US$ Million)
Table 119. Interactive Patient Care Systems (IPC) Software Market Trends
Table 120. Interactive Patient Care Systems (IPC) Software Market Drivers
Table 121. Interactive Patient Care Systems (IPC) Software Market Challenges
Table 122. Interactive Patient Care Systems (IPC) Software Market Restraints
Table 123. Research Programs/Design for This Report
Table 124. Key Data Information from Secondary Sources
Table 125. Key Data Information from Primary Sources
List of Figures
Figure 1. Global Interactive Patient Care Systems (IPC) Software Market Size Year-over-Year 2018-2029 & (US$ Million)
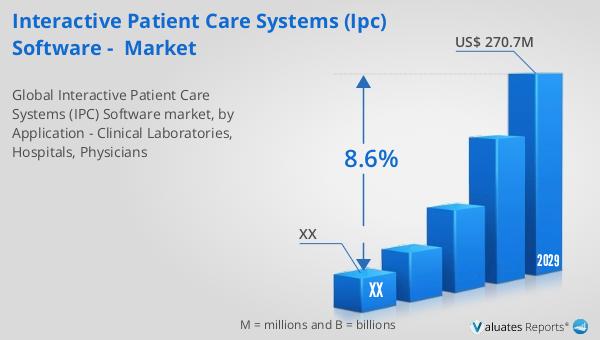
Figure 2. Global Interactive Patient Care Systems (IPC) Software Market Size (US$ Million), 2018 VS 2022 VS 2029
Figure 3. Global Interactive Patient Care Systems (IPC) Software Market Share by Regions: 2022 VS 2029
Figure 4. Global Interactive Patient Care Systems (IPC) Software Forecasted Market Size Share by Region (2024-2029)
Figure 5. North America Interactive Patient Care Systems (IPC) Software Market Size Growth Rate (2018-2029) & (US$ Million)
Figure 6. Europe Interactive Patient Care Systems (IPC) Software Market Size Growth Rate (2018-2029) & (US$ Million)
Figure 7. Asia-Pacific Interactive Patient Care Systems (IPC) Software Market Size Growth Rate (2018-2029) & (US$ Million)
Figure 8. Latin America Interactive Patient Care Systems (IPC) Software Market Size Growth Rate (2018-2029) & (US$ Million)
Figure 9. Middle East & Africa Interactive Patient Care Systems (IPC) Software Market Size Growth Rate (2018-2029) & (US$ Million)
Figure 10. Product Picture of Cloud Based
Figure 11. Global Cloud Based Market Size (US$ Million) & YoY Growth (2018-2029)
Figure 12. Product Picture of Web Based
Figure 13. Global Web Based Market Size (US$ Million) & YoY Growth (2018-2029)
Figure 14. Global Interactive Patient Care Systems (IPC) Software Market Size Share by Type: 2022 & 2029
Figure 15. North America Interactive Patient Care Systems (IPC) Software Revenue Market Share by Type (2018-2029)
Figure 16. Europe Interactive Patient Care Systems (IPC) Software Revenue Market Share by Type (2018-2029)
Figure 17. Asia-Pacific Interactive Patient Care Systems (IPC) Software Revenue Market Share by Type (2018-2029)
Figure 18. Latin America Interactive Patient Care Systems (IPC) Software Revenue Market Share by Type (2018-2029)
Figure 19. Middle East and Africa Interactive Patient Care Systems (IPC) Software Revenue Market Share by Type (2018-2029)
Figure 20. Clinical Laboratories Market Size (US$ Million) & YoY Growth (2018-2029)
Figure 21. Hospitals Market Size (US$ Million) & YoY Growth (2018-2029)
Figure 22. Physicians Market Size (US$ Million) & YoY Growth (2018-2029)
Figure 23. Global Interactive Patient Care Systems (IPC) Software Market Size Share by Application: 2022 & 2029
Figure 24. North America Interactive Patient Care Systems (IPC) Software Revenue Market Share by Application (2018-2029)
Figure 25. Europe Interactive Patient Care Systems (IPC) Software Revenue Market Share by Application (2018-2029)
Figure 26. Asia-Pacific Interactive Patient Care Systems (IPC) Software Revenue Market Share by Application (2018-2029)
Figure 27. Latin America Interactive Patient Care Systems (IPC) Software Revenue Market Share by Application (2018-2029)
Figure 28. Middle East and Africa Interactive Patient Care Systems (IPC) Software Revenue Market Share by Application (2018-2029)
Figure 29. Interactive Patient Care Systems (IPC) Software Market Share by Company Type (Tier 1, Tier 2 and Tier 3): 2018 VS 2022
Figure 30. Global Top 5 and Top 10 Players Interactive Patient Care Systems (IPC) Software Market Share in 2022
Figure 31. North America Interactive Patient Care Systems (IPC) Software Market Share by Country (2018-2029)
Figure 32. U.S. Interactive Patient Care Systems (IPC) Software Market Size (2018-2029) & (US$ Million)
Figure 33. Canada Interactive Patient Care Systems (IPC) Software Market Size (2018-2029) & (US$ Million)
Figure 34. Germany Interactive Patient Care Systems (IPC) Software Market Size (2018-2029) & (US$ Million)
Figure 35. France Interactive Patient Care Systems (IPC) Software Market Size (2018-2029) & (US$ Million)
Figure 36. U.K. Interactive Patient Care Systems (IPC) Software Market Size (2018-2029) & (US$ Million)
Figure 37. Italy Interactive Patient Care Systems (IPC) Software Market Size (2018-2029) & (US$ Million)
Figure 38. Russia Interactive Patient Care Systems (IPC) Software Market Size (2018-2029) & (US$ Million)
Figure 39. Nordic Countries Interactive Patient Care Systems (IPC) Software Market Size (2018-2029) & (US$ Million)
Figure 40. Asia-Pacific Interactive Patient Care Systems (IPC) Software Market Share by Region (2018-2029)
Figure 41. China Interactive Patient Care Systems (IPC) Software Market Size (2018-2029) & (US$ Million)
Figure 42. Japan Interactive Patient Care Systems (IPC) Software Market Size (2018-2029) & (US$ Million)
Figure 43. South Korea Interactive Patient Care Systems (IPC) Software Market Size (2018-2029) & (US$ Million)
Figure 44. Southeast Asia Interactive Patient Care Systems (IPC) Software Market Size (2018-2029) & (US$ Million)
Figure 45. India Interactive Patient Care Systems (IPC) Software Market Size (2018-2029) & (US$ Million)
Figure 46. Australia Interactive Patient Care Systems (IPC) Software Market Size (2018-2029) & (US$ Million)
Figure 47. Latin America Interactive Patient Care Systems (IPC) Software Market Share by Country (2018-2029)
Figure 48. Mexico Interactive Patient Care Systems (IPC) Software Market Size (2018-2029) & (US$ Million)
Figure 49. Brazil Interactive Patient Care Systems (IPC) Software Market Size (2018-2029) & (US$ Million)
Figure 50. Middle East & Africa Interactive Patient Care Systems (IPC) Software Market Share by Country (2018-2029)
Figure 51. Turkey Interactive Patient Care Systems (IPC) Software Market Size (2018-2029) & (US$ Million)
Figure 52. Saudi Arabia Interactive Patient Care Systems (IPC) Software Market Size (2018-2029) & (US$ Million)
Figure 53. UAE Interactive Patient Care Systems (IPC) Software Market Size (2018-2029) & (US$ Million)
Figure 54. Bottom-up and Top-down Approaches for This Report