FEATURED COMPANIES
Obducat
Resist Processing Systems Market Size
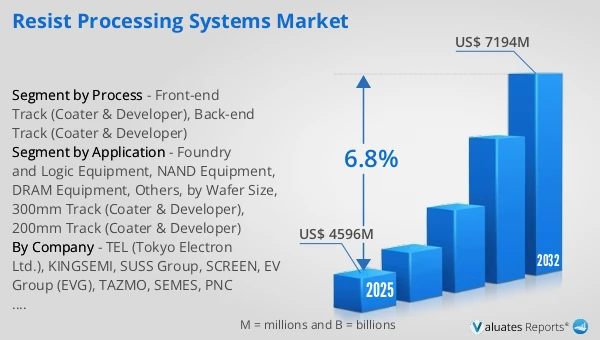
The global Resist Processing Systems market was valued at US$ 4596 million in 2025 and is anticipated to reach US$ 7194 million by 2032, at a CAGR of 6.8% from 2026 to 2032.
Resist Processing Systems Market
The 2025 U.S. tariff policies introduce profound uncertainty into the global economic landscape. This report critically examines the implications of recent tariff adjustments and international strategic countermeasures on Resist Processing Systems competitive dynamics, regional economic interdependencies, and supply chain reconfigurations.
Resist Processing Systems typically refer to integrated coat/develop “track” tools (coater/developer, wafer track) deployed next to a stepper/scanner inside a lithography cell to execute the sequential resist-processing flow that enables pattern transfer. In practical scope, a resist track integrates modular functions such as spin/spray coating, edge-bead removal (EBR), bake and thermal conditioning (soft bake / PEB / chill), developing (puddle/spray), rinse/dry, buffering and robotic wafer handling, with FOUP/load-port interfaces and alignment/transfer modules to match scanner takt time. Tokyo Electron’s annual report describes the coater/developer as the system that coats and develops wafers with photoresist, operating together with the exposure tool in the lithography process. In addition to wafer tracks, some suppliers also offer photomask resist processing platforms (mask coater/developer + PEB, etc.) for advanced mask manufacturing requirements.
In terms of product types / process forms and core technologies, the mainstream in high-volume manufacturing is the 300mm multi-module, high-throughput track platform, evolving along two axes: advanced-node readiness and broader materials/applications readiness. TEL positions its CLEAN TRACK™ LITHIUS™ series around extensibility to advanced processes, high throughput, footprint efficiency, higher OEE and lower cost of ownership, and in 2025 highlighted defect-control and productivity improvements in its latest LITHIUS Pro DICE™. SCREEN’s DT-3000 (SOKUDO DUO) emphasizes dual, parallel process lines to raise throughput and improve handling reliability, and explicitly supports advanced immersion ArF as well as e-beam and DSA coat/develop/bake solutions. Track platforms are also expanding to wider material sets (PI, BARC, SOC/SOD, spin-on hard mask, etc.) and to mixed 200/300mm and advanced packaging workflows; Kingsemi states its KS-FT200/300 covers i-line/KrF/ArF plus multiple materials and supports stand-alone or in-line operation with mainstream scanners. For 200mm and R&D/pilot use, EVG and SUSS highlight modular resist processing (spin/spray coat, develop, bake/chill) and versatility for advanced back-end / packaging applications.
Across applications, value chain, and industry dynamics, resist processing systems are indispensable for logic, memory, and specialty processes, and are increasingly extended to advanced packaging and specialty coatings. Upstream inputs span resist/developer/solvent chemistries and filtration, precision fluid metering/dispense, thermal subsystems (hot/chill plates), precision motion and handling (robots, servos, encoders), clean micro-environments and exhaust, sensors/metrology and data infrastructure, and control software. Midstream suppliers include the leading HVM platforms (TEL and SCREEN) alongside emerging alternative suppliers (e.g., SEMES’ public statements on mass-producing an ArF-i photo-processing track tool, and China’s expanding domestic track offerings). Downstream integration is tightly coupled to scanners and fab automation (takt time and OEE co-optimization). Key trends/drivers are: (i) tighter defect and thermal stability requirements for EUV/High-NA and increased litho process steps, (ii) OEE and uptime pressure as scanner time becomes more valuable (favoring high-throughput, low-downtime architectures such as dual-line tracks), (iii) advanced packaging and new materials broadening process windows and substrate versatility needs, and (iv) supply-chain resilience/localization pushing second-source adoption and domestic capability build-out.
This report delivers a comprehensive overview of the global Resist Processing Systems market, with both quantitative and qualitative analyses, to help readers develop growth strategies, assess the competitive landscape, evaluate their position in the current market, and make informed business decisions regarding Resist Processing Systems. The Resist Processing Systems market size, estimates, and forecasts are provided in terms of output/shipments (Units) and revenue (US$ millions), with 2025 as the base year and historical and forecast data for 2021–2032.
The report segments the global Resist Processing Systems market comprehensively. Regional market sizes by Process, by Wafer Size, by Application, and by company are also provided. For deeper insight, the report profiles the competitive landscape, key competitors, and their respective market rankings, and discusses technological trends and new product developments.
This report will assist Resist Processing Systems manufacturers, new entrants, and companies across the industry value chain with information on revenues, production, and average prices for the overall market and its sub-segments, by company, by Process, by Wafer Size, and by region.
Market Segmentation
Scope of Resist Processing Systems Market Report
| Report Metric |
Details |
| Report Name |
Resist Processing Systems Market |
| Accounted market size in 2025 |
US$ 4596 million |
| Forecasted market size in 2032 |
US$ 7194 million |
| CAGR |
6.8% |
| Base Year |
2025 |
| Forecasted years |
2026 - 2032 |
| Segment by Process |
- Front-end Track (Coater & Developer)
- Back-end Track (Coater & Developer)
|
| Segment by Application |
- Foundry and Logic Equipment
- NAND Equipment
- DRAM Equipment
- Others
- by Wafer Size
- 300mm Track (Coater & Developer)
- 200mm Track (Coater & Developer)
|
| Production by Region |
- North America
- Europe
- China
- Japan
- South Korea
|
| Consumption by Region |
- North America (United States, Canada)
- Europe (Germany, France, UK, Italy, Russia)
- Asia-Pacific (China, Japan, South Korea, Taiwan)
- Southeast Asia (India)
- Latin America (Mexico, Brazil)
|
| By Company |
TEL (Tokyo Electron Ltd.), KINGSEMI, SUSS Group, SCREEN, EV Group (EVG), TAZMO, SEMES, PNC Technology Group, Obducat, ELS System Technology, Litho Tech Japan Corporation, LithExx-Systems |
| Forecast units |
USD million in value |
| Report coverage |
Revenue and volume forecast, company share, competitive landscape, growth factors and trends |
Chapter Outline
- Chapter 1: Defines the scope of the report and presents an executive summary of market segments (by Process, by Wafer Size, by Application, etc.), including the size of each segment and its future growth potential. It offers a high-level view of the current market and its likely evolution in the short, medium, and long term.
- Chapter 2: Provides a detailed analysis of the competitive landscape for Resist Processing Systems manufacturers, including prices, production, value-based market shares, latest development plans, and information on mergers and acquisitions.
- Chapter 3: Examines Resist Processing Systems production/output and value by region and country, providing a quantitative assessment of market size and growth potential for each region over the next six years.
- Chapter 4: Analyzes Resist Processing Systems consumption at the regional and country levels. It quantifies market size and growth potential for each region and its key countries, and outlines market development, outlook, addressable space, and national production.
- Chapter 5: Analyzes market segments by Process, covering the size and growth potential of each segment to help readers identify “blue ocean” opportunities.
- Chapter 6: Analyzes market segments by Wafer Size, covering the size and growth potential of each segment to help readers identify “blue ocean” opportunities in downstream markets.
- Chapter 7: Profiles key players, detailing the fundamentals of major companies, including product production/output, value, price, gross margin, product portfolio/introductions, and recent developments.
- Chapter 8: Reviews the industry value chain, including upstream and downstream segments.
- Chapter 9: Discusses market dynamics and recent developments, including drivers, restraints, challenges and risks for manufacturers, U.S. Tariffs and relevant policy analysis.
- Chapter 10: Summarizes the key findings and conclusions of the report.
FAQ for this report
How fast is Resist Processing Systems Market growing?
Ans: The Resist Processing Systems Market witnessing a CAGR of 6.8% during the forecast period 2026-2032.
What is the Resist Processing Systems Market size in 2032?
Ans: The Resist Processing Systems Market size in 2032 will be US$ 7194 million.
Who are the main players in the Resist Processing Systems Market report?
Ans: The main players in the Resist Processing Systems Market are TEL (Tokyo Electron Ltd.), KINGSEMI, SUSS Group, SCREEN, EV Group (EVG), TAZMO, SEMES, PNC Technology Group, Obducat, ELS System Technology, Litho Tech Japan Corporation, LithExx-Systems
What are the Application segmentation covered in the Resist Processing Systems Market report?
Ans: The Applications covered in the Resist Processing Systems Market report are Foundry and Logic Equipment, NAND Equipment, DRAM Equipment, Others, by Wafer Size, 300mm Track (Coater & Developer), 200mm Track (Coater & Developer)

