FEATURED COMPANIES
Alstom
Siemens AG
Modern Tram Market Size
The global Modern Tram market was valued at US$ 4056 million in 2025 and is anticipated to reach US$ 5847 million by 2032, at a CAGR of 4.8% from 2026 to 2032.
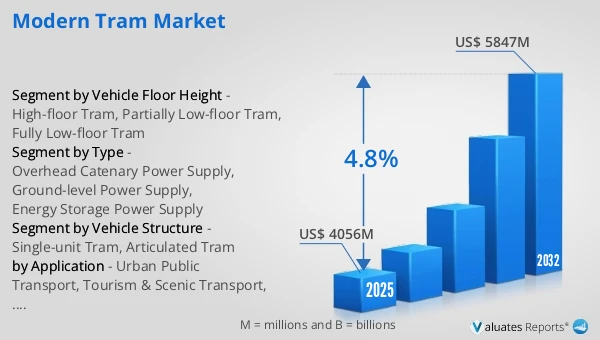
Modern Tram Market
The 2025 U.S. tariff policies introduce profound uncertainty into the global economic landscape. This report critically examines the implications of recent tariff adjustments and international strategic countermeasures on Modern Tram competitive dynamics, regional economic interdependencies, and supply chain reconfigurations.
A modern tram is an advanced urban rail vehicle designed for efficient, sustainable, and high-comfort public transportation within cities, featuring low-floor designs for easy boarding, electric propulsion systems, digital control and signaling technologies, and often battery or catenary-free operation. Compared with traditional trams, modern trams offer higher energy efficiency, reduced noise and emissions, improved passenger accessibility, and seamless integration with smart city and multimodal transport systems. In 2025, global Modern Tram production reached approximately 1556 units, with an average global market price of around US$2.61 million usd per unit.The production capacity for Modern Tram in 2025 was approximately 1700 units. The typical gross profit margin for Modern Tram is between 20% and 40%.
The Modern Tram market refers to the global market for next-generation urban tram systems that integrate advanced vehicle technologies, digital control systems, and sustainable energy solutions to provide efficient, low-carbon urban mobility. Modern trams typically feature low-floor designs, high energy efficiency, smart signaling, regenerative braking, and increasingly battery-powered or catenary-free operation, making them a key component of smart city and sustainable transportation strategies worldwide. The market is driven by urbanization, environmental regulations, and investments in public transit infrastructure, with Europe, Asia-Pacific, and the Middle East as major growth regions.
This report delivers a comprehensive overview of the global Modern Tram market, with both quantitative and qualitative analyses, to help readers develop growth strategies, assess the competitive landscape, evaluate their position in the current market, and make informed business decisions regarding Modern Tram. The Modern Tram market size, estimates, and forecasts are provided in terms of output/shipments (Units) and revenue (US$ millions), with 2025 as the base year and historical and forecast data for 2021–2032.
The report segments the global Modern Tram market comprehensively. Regional market sizes by Type, by Application, by Vehicle Structure, and by company are also provided. For deeper insight, the report profiles the competitive landscape, key competitors, and their respective market rankings, and discusses technological trends and new product developments.
This report will assist Modern Tram manufacturers, new entrants, and companies across the industry value chain with information on revenues, production, and average prices for the overall market and its sub-segments, by company, by Type, by Application, and by region.
Market Segmentation
Scope of Modern Tram Market Report
| Report Metric |
Details |
| Report Name |
Modern Tram Market |
| Accounted market size in 2025 |
US$ 4056 million |
| Forecasted market size in 2032 |
US$ 5847 million |
| CAGR |
4.8% |
| Base Year |
2025 |
| Forecasted years |
2026 - 2032 |
| Segment by Type |
- Overhead Catenary Power Supply
- Ground-level Power Supply
- Energy Storage Power Supply
|
| Segment by Vehicle Structure |
- Single-unit Tram
- Articulated Tram
|
| Segment by Vehicle Floor Height |
- High-floor Tram
- Partially Low-floor Tram
- Fully Low-floor Tram
|
| by Application |
- Urban Public Transport
- Tourism & Scenic Transport
- Airport & Transport Hub Shuttle
- Others
|
| Production by Region |
- North America
- Europe
- China
- Japan
- South Korea
- India
|
| Consumption by Region |
- North America (United States, Canada)
- Europe (Germany, France, UK, Italy, Russia)
- Asia-Pacific (China, Japan, South Korea, Taiwan)
- Southeast Asia (India)
- Latin America (Mexico, Brazil)
|
| By Company |
Alstom, Stadler Rail, Siemens, CAF Mobility, Škoda Group, Pesa, CRRC Corporation, Hitachi Rail, Bozankaya, Durmazlar, Astra Vagoane Calatori, Modertrans, TATRA-YUG, UKCP, PC Transport Systems, BKM HOLDING |
| Forecast units |
USD million in value |
| Report coverage |
Revenue and volume forecast, company share, competitive landscape, growth factors and trends |
Chapter Outline
- Chapter 1: Defines the scope of the report and presents an executive summary of market segments (by Type, by Application, by Vehicle Structure, etc.), including the size of each segment and its future growth potential. It offers a high-level view of the current market and its likely evolution in the short, medium, and long term.
- Chapter 2: Provides a detailed analysis of the competitive landscape for Modern Tram manufacturers, including prices, production, value-based market shares, latest development plans, and information on mergers and acquisitions.
- Chapter 3: Examines Modern Tram production/output and value by region and country, providing a quantitative assessment of market size and growth potential for each region over the next six years.
- Chapter 4: Analyzes Modern Tram consumption at the regional and country levels. It quantifies market size and growth potential for each region and its key countries, and outlines market development, outlook, addressable space, and national production.
- Chapter 5: Analyzes market segments by Type, covering the size and growth potential of each segment to help readers identify “blue ocean” opportunities.
- Chapter 6: Analyzes market segments by Application, covering the size and growth potential of each segment to help readers identify “blue ocean” opportunities in downstream markets.
- Chapter 7: Profiles key players, detailing the fundamentals of major companies, including product production/output, value, price, gross margin, product portfolio/introductions, and recent developments.
- Chapter 8: Reviews the industry value chain, including upstream and downstream segments.
- Chapter 9: Discusses market dynamics and recent developments, including drivers, restraints, challenges and risks for manufacturers, U.S. Tariffs and relevant policy analysis.
- Chapter 10: Summarizes the key findings and conclusions of the report.
FAQ for this report
How fast is Modern Tram Market growing?
Ans: The Modern Tram Market witnessing a CAGR of 4.8% during the forecast period 2026-2032.
What is the Modern Tram Market size in 2032?
Ans: The Modern Tram Market size in 2032 will be US$ 5847 million.
Who are the main players in the Modern Tram Market report?
Ans: The main players in the Modern Tram Market are Alstom, Stadler Rail, Siemens, CAF Mobility, Škoda Group, Pesa, CRRC Corporation, Hitachi Rail, Bozankaya, Durmazlar, Astra Vagoane Calatori, Modertrans, TATRA-YUG, UKCP, PC Transport Systems, BKM HOLDING
What are the Application segmentation covered in the Modern Tram Market report?
Ans: The Applications covered in the Modern Tram Market report are Urban Public Transport, Tourism & Scenic Transport, Airport & Transport Hub Shuttle, Others
What are the Type segmentation covered in the Modern Tram Market report?
Ans: The Types covered in the Modern Tram Market report are Overhead Catenary Power Supply, Ground-level Power Supply, Energy Storage Power Supply

