List of Tables
Table 1. Global Combustible Dust Testing Market Size Growth Rate by Type (US$ Million): 2020 VS 2024 VS 2031
Table 2. Key Players of Particle Size Analysis
Table 3. Key Players of Ignition Sensitivity
Table 4. Key Players of Dust Resistivity
Table 5. Key Players of Others
Table 6. Global Combustible Dust Testing Market Size Growth Rate by Testing Purpose (US$ Million): 2020 VS 2024 VS 2031
Table 7. Key Players of Hazard Identification Testing
Table 8. Key Players of Risk Severity Quantification Testing
Table 9. Key Players of Ignition Source Sensitivity Testing
Table 10. Key Players of Compliance & Regulatory Testing
Table 11. Key Players of Mitigation Efficacy Testing
Table 12. Global Combustible Dust Testing Market Size Growth Rate by Dust Particle Size (Technical Subset) (US$ Million): 2020 VS 2024 VS 2031
Table 13. Key Players of Macro-Dust (>420 microns)
Table 14. Key Players of Micro-Dust (100–420 microns)
Table 15. Key Players of Nano-Dust (<100 microns)
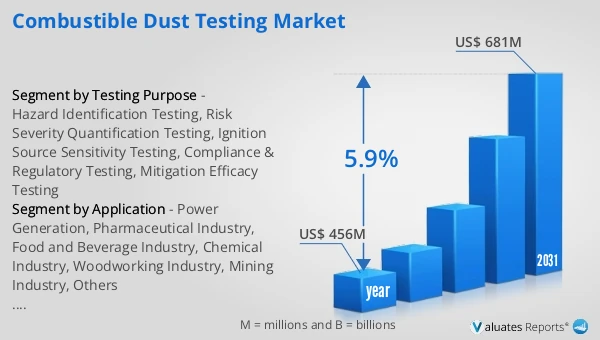
Table 16. Global Combustible Dust Testing Market Size Growth by Application (US$ Million): 2020 VS 2024 VS 2031
Table 17. Global Combustible Dust Testing Market Size by Region (US$ Million): 2020 VS 2024 VS 2031
Table 18. Global Combustible Dust Testing Market Size by Region (2020-2025) & (US$ Million)
Table 19. Global Combustible Dust Testing Market Share by Region (2020-2025)
Table 20. Global Combustible Dust Testing Forecasted Market Size by Region (2026-2031) & (US$ Million)
Table 21. Global Combustible Dust Testing Market Share by Region (2026-2031)
Table 22. Combustible Dust Testing Market Trends
Table 23. Combustible Dust Testing Market Drivers
Table 24. Combustible Dust Testing Market Challenges
Table 25. Combustible Dust Testing Market Restraints
Table 26. Global Combustible Dust Testing Revenue by Players (2020-2025) & (US$ Million)
Table 27. Global Combustible Dust Testing Market Share by Players (2020-2025)
Table 28. Global Top Combustible Dust Testing Players by Company Type (Tier 1, Tier 2, and Tier 3) & (based on the Revenue in Combustible Dust Testing as of 2024)
Table 29. Ranking of Global Top Combustible Dust Testing Companies by Revenue (US$ Million) in 2024
Table 30. Global 5 Largest Players Market Share by Combustible Dust Testing Revenue (CR5 and HHI) & (2020-2025)
Table 31. Global Key Players of Combustible Dust Testing, Headquarters and Area Served
Table 32. Global Key Players of Combustible Dust Testing, Product and Application
Table 33. Global Key Players of Combustible Dust Testing, Date of Enter into This Industry
Table 34. Mergers & Acquisitions, Expansion Plans
Table 35. Global Combustible Dust Testing Market Size by Type (2020-2025) & (US$ Million)
Table 36. Global Combustible Dust Testing Revenue Market Share by Type (2020-2025)
Table 37. Global Combustible Dust Testing Forecasted Market Size by Type (2026-2031) & (US$ Million)
Table 38. Global Combustible Dust Testing Revenue Market Share by Type (2026-2031)
Table 39. Global Combustible Dust Testing Market Size by Application (2020-2025) & (US$ Million)
Table 40. Global Combustible Dust Testing Revenue Market Share by Application (2020-2025)
Table 41. Global Combustible Dust Testing Forecasted Market Size by Application (2026-2031) & (US$ Million)
Table 42. Global Combustible Dust Testing Revenue Market Share by Application (2026-2031)
Table 43. North America Combustible Dust Testing Market Size Growth Rate by Country (US$ Million): 2020 VS 2024 VS 2031
Table 44. North America Combustible Dust Testing Market Size by Country (2020-2025) & (US$ Million)
Table 45. North America Combustible Dust Testing Market Size by Country (2026-2031) & (US$ Million)
Table 46. Europe Combustible Dust Testing Market Size Growth Rate by Country (US$ Million): 2020 VS 2024 VS 2031
Table 47. Europe Combustible Dust Testing Market Size by Country (2020-2025) & (US$ Million)
Table 48. Europe Combustible Dust Testing Market Size by Country (2026-2031) & (US$ Million)
Table 49. Asia-Pacific Combustible Dust Testing Market Size Growth Rate by Region (US$ Million): 2020 VS 2024 VS 2031
Table 50. Asia-Pacific Combustible Dust Testing Market Size by Region (2020-2025) & (US$ Million)
Table 51. Asia-Pacific Combustible Dust Testing Market Size by Region (2026-2031) & (US$ Million)
Table 52. Latin America Combustible Dust Testing Market Size Growth Rate by Country (US$ Million): 2020 VS 2024 VS 2031
Table 53. Latin America Combustible Dust Testing Market Size by Country (2020-2025) & (US$ Million)
Table 54. Latin America Combustible Dust Testing Market Size by Country (2026-2031) & (US$ Million)
Table 55. Middle East & Africa Combustible Dust Testing Market Size Growth Rate by Country (US$ Million): 2020 VS 2024 VS 2031
Table 56. Middle East & Africa Combustible Dust Testing Market Size by Country (2020-2025) & (US$ Million)
Table 57. Middle East & Africa Combustible Dust Testing Market Size by Country (2026-2031) & (US$ Million)
Table 58. Stonehouse Process Safety Company Details
Table 59. Stonehouse Process Safety Business Overview
Table 60. Stonehouse Process Safety Combustible Dust Testing Product
Table 61. Stonehouse Process Safety Revenue in Combustible Dust Testing Business (2020-2025) & (US$ Million)
Table 62. Stonehouse Process Safety Recent Development
Table 63. Fauske & Associates Company Details
Table 64. Fauske & Associates Business Overview
Table 65. Fauske & Associates Combustible Dust Testing Product
Table 66. Fauske & Associates Revenue in Combustible Dust Testing Business (2020-2025) & (US$ Million)
Table 67. Fauske & Associates Recent Development
Table 68. Imperial Systems Company Details
Table 69. Imperial Systems Business Overview
Table 70. Imperial Systems Combustible Dust Testing Product
Table 71. Imperial Systems Revenue in Combustible Dust Testing Business (2020-2025) & (US$ Million)
Table 72. Imperial Systems Recent Development
Table 73. Exponent Company Details
Table 74. Exponent Business Overview
Table 75. Exponent Combustible Dust Testing Product
Table 76. Exponent Revenue in Combustible Dust Testing Business (2020-2025) & (US$ Million)
Table 77. Exponent Recent Development
Table 78. Sigma-HSE Company Details
Table 79. Sigma-HSE Business Overview
Table 80. Sigma-HSE Combustible Dust Testing Product
Table 81. Sigma-HSE Revenue in Combustible Dust Testing Business (2020-2025) & (US$ Million)
Table 82. Sigma-HSE Recent Development
Table 83. ioKinetic Company Details
Table 84. ioKinetic Business Overview
Table 85. ioKinetic Combustible Dust Testing Product
Table 86. ioKinetic Revenue in Combustible Dust Testing Business (2020-2025) & (US$ Million)
Table 87. ioKinetic Recent Development
Table 88. Simtars Company Details
Table 89. Simtars Business Overview
Table 90. Simtars Combustible Dust Testing Product
Table 91. Simtars Revenue in Combustible Dust Testing Business (2020-2025) & (US$ Million)
Table 92. Simtars Recent Development
Table 93. DEKRA Company Details
Table 94. DEKRA Business Overview
Table 95. DEKRA Combustible Dust Testing Product
Table 96. DEKRA Revenue in Combustible Dust Testing Business (2020-2025) & (US$ Million)
Table 97. DEKRA Recent Development
Table 98. Air Separation Technologies Company Details
Table 99. Air Separation Technologies Business Overview
Table 100. Air Separation Technologies Combustible Dust Testing Product
Table 101. Air Separation Technologies Revenue in Combustible Dust Testing Business (2020-2025) & (US$ Million)
Table 102. Air Separation Technologies Recent Development
Table 103. Jensen Hughes Company Details
Table 104. Jensen Hughes Business Overview
Table 105. Jensen Hughes Combustible Dust Testing Product
Table 106. Jensen Hughes Revenue in Combustible Dust Testing Business (2020-2025) & (US$ Million)
Table 107. Jensen Hughes Recent Development
Table 108. QE Safety Company Details
Table 109. QE Safety Business Overview
Table 110. QE Safety Combustible Dust Testing Product
Table 111. QE Safety Revenue in Combustible Dust Testing Business (2020-2025) & (US$ Million)
Table 112. QE Safety Recent Development
Table 113. Sumika Chemical Analysis Service, Ltd. (SCAS) Company Details
Table 114. Sumika Chemical Analysis Service, Ltd. (SCAS) Business Overview
Table 115. Sumika Chemical Analysis Service, Ltd. (SCAS) Combustible Dust Testing Product
Table 116. Sumika Chemical Analysis Service, Ltd. (SCAS) Revenue in Combustible Dust Testing Business (2020-2025) & (US$ Million)
Table 117. Sumika Chemical Analysis Service, Ltd. (SCAS) Recent Development
Table 118. Gexcon Company Details
Table 119. Gexcon Business Overview
Table 120. Gexcon Combustible Dust Testing Product
Table 121. Gexcon Revenue in Combustible Dust Testing Business (2020-2025) & (US$ Million)
Table 122. Gexcon Recent Development
Table 123. Intertek Company Details
Table 124. Intertek Business Overview
Table 125. Intertek Combustible Dust Testing Product
Table 126. Intertek Revenue in Combustible Dust Testing Business (2020-2025) & (US$ Million)
Table 127. Intertek Recent Development
Table 128. Dustcon Solutions Company Details
Table 129. Dustcon Solutions Business Overview
Table 130. Dustcon Solutions Combustible Dust Testing Product
Table 131. Dustcon Solutions Revenue in Combustible Dust Testing Business (2020-2025) & (US$ Million)
Table 132. Dustcon Solutions Recent Development
Table 133. ioMosaic Company Details
Table 134. ioMosaic Business Overview
Table 135. ioMosaic Combustible Dust Testing Product
Table 136. ioMosaic Revenue in Combustible Dust Testing Business (2020-2025) & (US$ Million)
Table 137. ioMosaic Recent Development
Table 138. Suppression Systems, Inc Company Details
Table 139. Suppression Systems, Inc Business Overview
Table 140. Suppression Systems, Inc Combustible Dust Testing Product
Table 141. Suppression Systems, Inc Revenue in Combustible Dust Testing Business (2020-2025) & (US$ Million)
Table 142. Suppression Systems, Inc Recent Development
Table 143. EMSL Analytical, Inc. Company Details
Table 144. EMSL Analytical, Inc. Business Overview
Table 145. EMSL Analytical, Inc. Combustible Dust Testing Product
Table 146. EMSL Analytical, Inc. Revenue in Combustible Dust Testing Business (2020-2025) & (US$ Million)
Table 147. EMSL Analytical, Inc. Recent Development
Table 148. Measurlabs Company Details
Table 149. Measurlabs Business Overview
Table 150. Measurlabs Combustible Dust Testing Product
Table 151. Measurlabs Revenue in Combustible Dust Testing Business (2020-2025) & (US$ Million)
Table 152. Measurlabs Recent Development
Table 153. Research Programs/Design for This Report
Table 154. Key Data Information from Secondary Sources
Table 155. Key Data Information from Primary Sources
Table 156. Authors List of This Report
List of Figures
Figure 1. Combustible Dust Testing Picture
Figure 2. Global Combustible Dust Testing Market Size Comparison by Type (2020-2031) & (US$ Million)
Figure 3. Global Combustible Dust Testing Market Share by Type: 2024 VS 2031
Figure 4. Particle Size Analysis Features
Figure 5. Ignition Sensitivity Features
Figure 6. Dust Resistivity Features
Figure 7. Others Features
Figure 8. Global Combustible Dust Testing Market Size Comparison by Testing Purpose (2020-2031) & (US$ Million)
Figure 9. Hazard Identification Testing Features
Figure 10. Risk Severity Quantification Testing Features
Figure 11. Ignition Source Sensitivity Testing Features
Figure 12. Compliance & Regulatory Testing Features
Figure 13. Mitigation Efficacy Testing Features
Figure 14. Global Combustible Dust Testing Market Size Comparison by Dust Particle Size (Technical Subset) (2020-2031) & (US$ Million)
Figure 15. Macro-Dust (>420 microns) Features
Figure 16. Micro-Dust (100–420 microns) Features
Figure 17. Nano-Dust (<100 microns) Features
Figure 18. Global Combustible Dust Testing Market Size by Application (2020-2031) & (US$ Million)
Figure 19. Global Combustible Dust Testing Market Share by Application: 2024 VS 2031
Figure 20. Power Generation Case Studies
Figure 21. Pharmaceutical Industry Case Studies
Figure 22. Food and Beverage Industry Case Studies
Figure 23. Chemical Industry Case Studies
Figure 24. Woodworking Industry Case Studies
Figure 25. Mining Industry Case Studies
Figure 26. Others Case Studies
Figure 27. Combustible Dust Testing Report Years Considered
Figure 28. Global Combustible Dust Testing Market Size (US$ Million), Year-over-Year: 2020-2031
Figure 29. Global Combustible Dust Testing Market Size, (US$ Million), 2020 VS 2024 VS 2031
Figure 30. Global Combustible Dust Testing Market Share by Region: 2024 VS 2031
Figure 31. Global Combustible Dust Testing Market Share by Players in 2024
Figure 32. Global Combustible Dust Testing Market Share by Company Type (Tier 1, Tier 2, and Tier 3)
Figure 33. The Top 10 and 5 Players Market Share by Combustible Dust Testing Revenue in 2024
Figure 34. North America Combustible Dust Testing Market Size YoY Growth (2020-2031) & (US$ Million)
Figure 35. North America Combustible Dust Testing Market Share by Country (2020-2031)
Figure 36. United States Combustible Dust Testing Market Size YoY Growth (2020-2031) & (US$ Million)
Figure 37. Canada Combustible Dust Testing Market Size YoY Growth (2020-2031) & (US$ Million)
Figure 38. Europe Combustible Dust Testing Market Size YoY Growth (2020-2031) & (US$ Million)
Figure 39. Europe Combustible Dust Testing Market Share by Country (2020-2031)
Figure 40. Germany Combustible Dust Testing Market Size YoY Growth (2020-2031) & (US$ Million)
Figure 41. France Combustible Dust Testing Market Size YoY Growth (2020-2031) & (US$ Million)
Figure 42. U.K. Combustible Dust Testing Market Size YoY Growth (2020-2031) & (US$ Million)
Figure 43. Italy Combustible Dust Testing Market Size YoY Growth (2020-2031) & (US$ Million)
Figure 44. Russia Combustible Dust Testing Market Size YoY Growth (2020-2031) & (US$ Million)
Figure 45. Ireland Combustible Dust Testing Market Size YoY Growth (2020-2031) & (US$ Million)
Figure 46. Asia-Pacific Combustible Dust Testing Market Size YoY Growth (2020-2031) & (US$ Million)
Figure 47. Asia-Pacific Combustible Dust Testing Market Share by Region (2020-2031)
Figure 48. China Combustible Dust Testing Market Size YoY Growth (2020-2031) & (US$ Million)
Figure 49. Japan Combustible Dust Testing Market Size YoY Growth (2020-2031) & (US$ Million)
Figure 50. South Korea Combustible Dust Testing Market Size YoY Growth (2020-2031) & (US$ Million)
Figure 51. Southeast Asia Combustible Dust Testing Market Size YoY Growth (2020-2031) & (US$ Million)
Figure 52. India Combustible Dust Testing Market Size YoY Growth (2020-2031) & (US$ Million)
Figure 53. Australia & New Zealand Combustible Dust Testing Market Size YoY Growth (2020-2031) & (US$ Million)
Figure 54. Latin America Combustible Dust Testing Market Size YoY Growth (2020-2031) & (US$ Million)
Figure 55. Latin America Combustible Dust Testing Market Share by Country (2020-2031)
Figure 56. Mexico Combustible Dust Testing Market Size YoY Growth (2020-2031) & (US$ Million)
Figure 57. Brazil Combustible Dust Testing Market Size YoY Growth (2020-2031) & (US$ Million)
Figure 58. Middle East & Africa Combustible Dust Testing Market Size YoY Growth (2020-2031) & (US$ Million)
Figure 59. Middle East & Africa Combustible Dust Testing Market Share by Country (2020-2031)
Figure 60. Israel Combustible Dust Testing Market Size YoY Growth (2020-2031) & (US$ Million)
Figure 61. Saudi Arabia Combustible Dust Testing Market Size YoY Growth (2020-2031) & (US$ Million)
Figure 62. UAE Combustible Dust Testing Market Size YoY Growth (2020-2031) & (US$ Million)
Figure 63. Stonehouse Process Safety Revenue Growth Rate in Combustible Dust Testing Business (2020-2025)
Figure 64. Fauske & Associates Revenue Growth Rate in Combustible Dust Testing Business (2020-2025)
Figure 65. Imperial Systems Revenue Growth Rate in Combustible Dust Testing Business (2020-2025)
Figure 66. Exponent Revenue Growth Rate in Combustible Dust Testing Business (2020-2025)
Figure 67. Sigma-HSE Revenue Growth Rate in Combustible Dust Testing Business (2020-2025)
Figure 68. ioKinetic Revenue Growth Rate in Combustible Dust Testing Business (2020-2025)
Figure 69. Simtars Revenue Growth Rate in Combustible Dust Testing Business (2020-2025)
Figure 70. DEKRA Revenue Growth Rate in Combustible Dust Testing Business (2020-2025)
Figure 71. Air Separation Technologies Revenue Growth Rate in Combustible Dust Testing Business (2020-2025)
Figure 72. Jensen Hughes Revenue Growth Rate in Combustible Dust Testing Business (2020-2025)
Figure 73. QE Safety Revenue Growth Rate in Combustible Dust Testing Business (2020-2025)
Figure 74. Sumika Chemical Analysis Service, Ltd. (SCAS) Revenue Growth Rate in Combustible Dust Testing Business (2020-2025)
Figure 75. Gexcon Revenue Growth Rate in Combustible Dust Testing Business (2020-2025)
Figure 76. Intertek Revenue Growth Rate in Combustible Dust Testing Business (2020-2025)
Figure 77. Dustcon Solutions Revenue Growth Rate in Combustible Dust Testing Business (2020-2025)
Figure 78. ioMosaic Revenue Growth Rate in Combustible Dust Testing Business (2020-2025)
Figure 79. Suppression Systems, Inc Revenue Growth Rate in Combustible Dust Testing Business (2020-2025)
Figure 80. EMSL Analytical, Inc. Revenue Growth Rate in Combustible Dust Testing Business (2020-2025)
Figure 81. Measurlabs Revenue Growth Rate in Combustible Dust Testing Business (2020-2025)
Figure 82. Bottom-up and Top-down Approaches for This Report
Figure 83. Data Triangulation
Figure 84. Key Executives Interviewed