List of Tables
Table 1. Global General Lighting Market Value by Type, (US$ Million) & (2024 VS 2031)
Table 2. Global General Lighting Market Value by Application, (US$ Million) & (2024 VS 2031)
Table 3. Global General Lighting Production Capacity (K Units) by Manufacturers in 2024
Table 4. Global General Lighting Production by Manufacturers (2020-2025) & (K Units)
Table 5. Global General Lighting Production Market Share by Manufacturers (2020-2025)
Table 6. Global General Lighting Production Value by Manufacturers (2020-2025) & (US$ Million)
Table 7. Global General Lighting Production Value Share by Manufacturers (2020-2025)
Table 8. Global Key Players of General Lighting, Industry Ranking, 2023 VS 2024
Table 9. Company Type (Tier 1, Tier 2, and Tier 3) & (based on the Production Value in General Lighting as of 2024)
Table 10. Global Market General Lighting Average Price by Manufacturers (USD/Unit) & (2020-2025)
Table 11. Global Key Manufacturers of General Lighting, Manufacturing Base Distribution and Headquarters
Table 12. Global Key Manufacturers of General Lighting, Product Offered and Application
Table 13. Global Key Manufacturers of General Lighting, Date of Enter into This Industry
Table 14. Global General Lighting Manufacturers Market Concentration Ratio (CR5 and HHI)
Table 15. Mergers & Acquisitions, Expansion Plans
Table 16. Global General Lighting Production Value by Region: 2020 VS 2024 VS 2031 (US$ Million)
Table 17. Global General Lighting Production Value (US$ Million) by Region (2020-2025)
Table 18. Global General Lighting Production Value Market Share by Region (2020-2025)
Table 19. Global General Lighting Production Value (US$ Million) Forecast by Region (2026-2031)
Table 20. Global General Lighting Production Value Market Share Forecast by Region (2026-2031)
Table 21. Global General Lighting Production Comparison by Region: 2020 VS 2024 VS 2031 (K Units)
Table 22. Global General Lighting Production (K Units) by Region (2020-2025)
Table 23. Global General Lighting Production Market Share by Region (2020-2025)
Table 24. Global General Lighting Production (K Units) Forecast by Region (2026-2031)
Table 25. Global General Lighting Production Market Share Forecast by Region (2026-2031)
Table 26. Global General Lighting Market Average Price (USD/Unit) by Region (2020-2025)
Table 27. Global General Lighting Market Average Price (USD/Unit) by Region (2026-2031)
Table 28. Global General Lighting Consumption Growth Rate by Region: 2020 VS 2024 VS 2031 (K Units)
Table 29. Global General Lighting Consumption by Region (2020-2025) & (K Units)
Table 30. Global General Lighting Consumption Market Share by Region (2020-2025)
Table 31. Global General Lighting Forecasted Consumption by Region (2026-2031) & (K Units)
Table 32. Global General Lighting Forecasted Consumption Market Share by Region (2026-2031)
Table 33. North America General Lighting Consumption Growth Rate by Country: 2020 VS 2024 VS 2031 (K Units)
Table 34. North America General Lighting Consumption by Country (2020-2025) & (K Units)
Table 35. North America General Lighting Consumption by Country (2026-2031) & (K Units)
Table 36. Europe General Lighting Consumption Growth Rate by Country: 2020 VS 2024 VS 2031 (K Units)
Table 37. Europe General Lighting Consumption by Country (2020-2025) & (K Units)
Table 38. Europe General Lighting Consumption by Country (2026-2031) & (K Units)
Table 39. Asia Pacific General Lighting Consumption Growth Rate by Region: 2020 VS 2024 VS 2031 (K Units)
Table 40. Asia Pacific General Lighting Consumption by Region (2020-2025) & (K Units)
Table 41. Asia Pacific General Lighting Consumption by Region (2026-2031) & (K Units)
Table 42. Latin America, Middle East & Africa General Lighting Consumption Growth Rate by Country: 2020 VS 2024 VS 2031 (K Units)
Table 43. Latin America, Middle East & Africa General Lighting Consumption by Country (2020-2025) & (K Units)
Table 44. Latin America, Middle East & Africa General Lighting Consumption by Country (2026-2031) & (K Units)
Table 45. Global General Lighting Production (K Units) by Type (2020-2025)
Table 46. Global General Lighting Production (K Units) by Type (2026-2031)
Table 47. Global General Lighting Production Market Share by Type (2020-2025)
Table 48. Global General Lighting Production Market Share by Type (2026-2031)
Table 49. Global General Lighting Production Value (US$ Million) by Type (2020-2025)
Table 50. Global General Lighting Production Value (US$ Million) by Type (2026-2031)
Table 51. Global General Lighting Production Value Market Share by Type (2020-2025)
Table 52. Global General Lighting Production Value Market Share by Type (2026-2031)
Table 53. Global General Lighting Price (USD/Unit) by Type (2020-2025)
Table 54. Global General Lighting Price (USD/Unit) by Type (2026-2031)
Table 55. Global General Lighting Production (K Units) by Application (2020-2025)
Table 56. Global General Lighting Production (K Units) by Application (2026-2031)
Table 57. Global General Lighting Production Market Share by Application (2020-2025)
Table 58. Global General Lighting Production Market Share by Application (2026-2031)
Table 59. Global General Lighting Production Value (US$ Million) by Application (2020-2025)
Table 60. Global General Lighting Production Value (US$ Million) by Application (2026-2031)
Table 61. Global General Lighting Production Value Market Share by Application (2020-2025)
Table 62. Global General Lighting Production Value Market Share by Application (2026-2031)
Table 63. Global General Lighting Price (USD/Unit) by Application (2020-2025)
Table 64. Global General Lighting Price (USD/Unit) by Application (2026-2031)
Table 65. Neff-Perkins Company General Lighting Company Information
Table 66. Neff-Perkins Company General Lighting Specification and Application
Table 67. Neff-Perkins Company General Lighting Production (K Units), Value (US$ Million), Price (USD/Unit) and Gross Margin (2020-2025)
Table 68. Neff-Perkins Company Main Business and Markets Served
Table 69. Neff-Perkins Company Recent Developments/Updates
Table 70. Ashtabula Rubber Co General Lighting Company Information
Table 71. Ashtabula Rubber Co General Lighting Specification and Application
Table 72. Ashtabula Rubber Co General Lighting Production (K Units), Value (US$ Million), Price (USD/Unit) and Gross Margin (2020-2025)
Table 73. Ashtabula Rubber Co Main Business and Markets Served
Table 74. Ashtabula Rubber Co Recent Developments/Updates
Table 75. Seals Eastern, Inc General Lighting Company Information
Table 76. Seals Eastern, Inc General Lighting Specification and Application
Table 77. Seals Eastern, Inc General Lighting Production (K Units), Value (US$ Million), Price (USD/Unit) and Gross Margin (2020-2025)
Table 78. Seals Eastern, Inc Main Business and Markets Served
Table 79. Seals Eastern, Inc Recent Developments/Updates
Table 80. Enbi General Lighting Company Information
Table 81. Enbi General Lighting Specification and Application
Table 82. Enbi General Lighting Production (K Units), Value (US$ Million), Price (USD/Unit) and Gross Margin (2020-2025)
Table 83. Enbi Main Business and Markets Served
Table 84. Enbi Recent Developments/Updates
Table 85. Timco Rubber General Lighting Company Information
Table 86. Timco Rubber General Lighting Specification and Application
Table 87. Timco Rubber General Lighting Production (K Units), Value (US$ Million), Price (USD/Unit) and Gross Margin (2020-2025)
Table 88. Timco Rubber Main Business and Markets Served
Table 89. Timco Rubber Recent Developments/Updates
Table 90. Dunnage Engineering General Lighting Company Information
Table 91. Dunnage Engineering General Lighting Specification and Application
Table 92. Dunnage Engineering General Lighting Production (K Units), Value (US$ Million), Price (USD/Unit) and Gross Margin (2020-2025)
Table 93. Dunnage Engineering Main Business and Markets Served
Table 94. Dunnage Engineering Recent Developments/Updates
Table 95. KPM Plasto Rubber Co General Lighting Company Information
Table 96. KPM Plasto Rubber Co General Lighting Specification and Application
Table 97. KPM Plasto Rubber Co General Lighting Production (K Units), Value (US$ Million), Price (USD/Unit) and Gross Margin (2020-2025)
Table 98. KPM Plasto Rubber Co Main Business and Markets Served
Table 99. KPM Plasto Rubber Co Recent Developments/Updates
Table 100. Athena General Lighting Company Information
Table 101. Athena General Lighting Specification and Application
Table 102. Athena General Lighting Production (K Units), Value (US$ Million), Price (USD/Unit) and Gross Margin (2020-2025)
Table 103. Athena Main Business and Markets Served
Table 104. Athena Recent Developments/Updates
Table 105. HUEHOCO Group General Lighting Company Information
Table 106. HUEHOCO Group General Lighting Specification and Application
Table 107. HUEHOCO Group General Lighting Production (K Units), Value (US$ Million), Price (USD/Unit) and Gross Margin (2020-2025)
Table 108. HUEHOCO Group Main Business and Markets Served
Table 109. HUEHOCO Group Recent Developments/Updates
Table 110. Star-Glo Industries, Inc General Lighting Company Information
Table 111. Star-Glo Industries, Inc General Lighting Specification and Application
Table 112. Star-Glo Industries, Inc General Lighting Production (K Units), Value (US$ Million), Price (USD/Unit) and Gross Margin (2020-2025)
Table 113. Star-Glo Industries, Inc Main Business and Markets Served
Table 114. Star-Glo Industries, Inc Recent Developments/Updates
Table 115. Hoffmann GmbH General Lighting Company Information
Table 116. Hoffmann GmbH General Lighting Specification and Application
Table 117. Hoffmann GmbH General Lighting Production (K Units), Value (US$ Million), Price (USD/Unit) and Gross Margin (2020-2025)
Table 118. Hoffmann GmbH Main Business and Markets Served
Table 119. Hoffmann GmbH Recent Developments/Updates
Table 120. MikronPMP Aerospace General Lighting Company Information
Table 121. MikronPMP Aerospace General Lighting Specification and Application
Table 122. MikronPMP Aerospace General Lighting Production (K Units), Value (US$ Million), Price (USD/Unit) and Gross Margin (2020-2025)
Table 123. MikronPMP Aerospace Main Business and Markets Served
Table 124. MikronPMP Aerospace Recent Developments/Updates
Table 125. The Western Group General Lighting Company Information
Table 126. The Western Group General Lighting Specification and Application
Table 127. The Western Group General Lighting Production (K Units), Value (US$ Million), Price (USD/Unit) and Gross Margin (2020-2025)
Table 128. The Western Group Main Business and Markets Served
Table 129. The Western Group Recent Developments/Updates
Table 130. Teamful General Lighting Company Information
Table 131. Teamful General Lighting Specification and Application
Table 132. Teamful General Lighting Production (K Units), Value (US$ Million), Price (USD/Unit) and Gross Margin (2020-2025)
Table 133. Teamful Main Business and Markets Served
Table 134. Teamful Recent Developments/Updates
Table 135. CALVOSEALING General Lighting Company Information
Table 136. CALVOSEALING General Lighting Specification and Application
Table 137. CALVOSEALING General Lighting Production (K Units), Value (US$ Million), Price (USD/Unit) and Gross Margin (2020-2025)
Table 138. CALVOSEALING Main Business and Markets Served
Table 139. CALVOSEALING Recent Developments/Updates
Table 140. UK Seals & Polymers Ltd General Lighting Company Information
Table 141. UK Seals & Polymers Ltd General Lighting Specification and Application
Table 142. UK Seals & Polymers Ltd General Lighting Production (K Units), Value (US$ Million), Price (USD/Unit) and Gross Margin (2020-2025)
Table 143. UK Seals & Polymers Ltd Main Business and Markets Served
Table 144. UK Seals & Polymers Ltd Recent Developments/Updates
Table 145. Gorman General Lighting Company Information
Table 146. Gorman General Lighting Specification and Application
Table 147. Gorman General Lighting Production (K Units), Value (US$ Million), Price (USD/Unit) and Gross Margin (2020-2025)
Table 148. Gorman Main Business and Markets Served
Table 149. Gorman Recent Developments/Updates
Table 150. KN Rubber LLC General Lighting Company Information
Table 151. KN Rubber LLC General Lighting Specification and Application
Table 152. KN Rubber LLC General Lighting Production (K Units), Value (US$ Million), Price (USD/Unit) and Gross Margin (2020-2025)
Table 153. KN Rubber LLC Main Business and Markets Served
Table 154. KN Rubber LLC Recent Developments/Updates
Table 155. I.B. Moore Co., Inc General Lighting Company Information
Table 156. I.B. Moore Co., Inc General Lighting Specification and Application
Table 157. I.B. Moore Co., Inc General Lighting Production (K Units), Value (US$ Million), Price (USD/Unit) and Gross Margin (2020-2025)
Table 158. I.B. Moore Co., Inc Main Business and Markets Served
Table 159. I.B. Moore Co., Inc Recent Developments/Updates
Table 160. Associated Rubber, Inc General Lighting Company Information
Table 161. Associated Rubber, Inc General Lighting Specification and Application
Table 162. Associated Rubber, Inc General Lighting Production (K Units), Value (US$ Million), Price (USD/Unit) and Gross Margin (2020-2025)
Table 163. Associated Rubber, Inc Main Business and Markets Served
Table 164. Associated Rubber, Inc Recent Developments/Updates
Table 165. Isolation Technology, Inc General Lighting Company Information
Table 166. Isolation Technology, Inc General Lighting Specification and Application
Table 167. Isolation Technology, Inc General Lighting Production (K Units), Value (US$ Million), Price (USD/Unit) and Gross Margin (2020-2025)
Table 168. Isolation Technology, Inc Main Business and Markets Served
Table 169. Isolation Technology, Inc Recent Developments/Updates
Table 170. Industrial Molded Rubber Products (IMR) General Lighting Company Information
Table 171. Industrial Molded Rubber Products (IMR) General Lighting Specification and Application
Table 172. Industrial Molded Rubber Products (IMR) General Lighting Production (K Units), Value (US$ Million), Price (USD/Unit) and Gross Margin (2020-2025)
Table 173. Industrial Molded Rubber Products (IMR) Main Business and Markets Served
Table 174. Industrial Molded Rubber Products (IMR) Recent Developments/Updates
Table 175. Western Wire of Texas General Lighting Company Information
Table 176. Western Wire of Texas General Lighting Specification and Application
Table 177. Western Wire of Texas General Lighting Production (K Units), Value (US$ Million), Price (USD/Unit) and Gross Margin (2020-2025)
Table 178. Western Wire of Texas Main Business and Markets Served
Table 179. Western Wire of Texas Recent Developments/Updates
Table 180. Chengdu Junma Sealing Technology Co.,Ltd General Lighting Company Information
Table 181. Chengdu Junma Sealing Technology Co.,Ltd General Lighting Specification and Application
Table 182. Chengdu Junma Sealing Technology Co.,Ltd General Lighting Production (K Units), Value (US$ Million), Price (USD/Unit) and Gross Margin (2020-2025)
Table 183. Chengdu Junma Sealing Technology Co.,Ltd Main Business and Markets Served
Table 184. Chengdu Junma Sealing Technology Co.,Ltd Recent Developments/Updates
Table 185. Rubber Concept (RC) General Lighting Company Information
Table 186. Rubber Concept (RC) General Lighting Specification and Application
Table 187. Rubber Concept (RC) General Lighting Production (K Units), Value (US$ Million), Price (USD/Unit) and Gross Margin (2020-2025)
Table 188. Rubber Concept (RC) Main Business and Markets Served
Table 189. Rubber Concept (RC) Recent Developments/Updates
Table 190. RD Rubber Technology Corporation General Lighting Company Information
Table 191. RD Rubber Technology Corporation General Lighting Specification and Application
Table 192. RD Rubber Technology Corporation General Lighting Production (K Units), Value (US$ Million), Price (USD/Unit) and Gross Margin (2020-2025)
Table 193. RD Rubber Technology Corporation Main Business and Markets Served
Table 194. RD Rubber Technology Corporation Recent Developments/Updates
Table 195. Pierce-Roberts Rubber Company General Lighting Company Information
Table 196. Pierce-Roberts Rubber Company General Lighting Specification and Application
Table 197. Pierce-Roberts Rubber Company General Lighting Production (K Units), Value (US$ Million), Price (USD/Unit) and Gross Margin (2020-2025)
Table 198. Pierce-Roberts Rubber Company Main Business and Markets Served
Table 199. Pierce-Roberts Rubber Company Recent Developments/Updates
Table 200. Key Raw Materials Lists
Table 201. Raw Materials Key Suppliers Lists
Table 202. General Lighting Distributors List
Table 203. General Lighting Customers List
Table 204. General Lighting Market Trends
Table 205. General Lighting Market Drivers
Table 206. General Lighting Market Challenges
Table 207. General Lighting Market Restraints
Table 208. Research Programs/Design for This Report
Table 209. Key Data Information from Secondary Sources
Table 210. Key Data Information from Primary Sources
Table 211. Authors List of This Report
List of Figures
Figure 1. Product Picture of General Lighting
Figure 2. Global General Lighting Market Value by Type, (US$ Million) & (2020-2031)
Figure 3. Global General Lighting Market Share by Type: 2024 VS 2031
Figure 4. Traditional Lighting Product Picture
Figure 5. LED Lighting Product Picture
Figure 6. Global General Lighting Market Value by Application, (US$ Million) & (2020-2031)
Figure 7. Global General Lighting Market Share by Application: 2024 VS 2031
Figure 8. Residential
Figure 9. Commercial
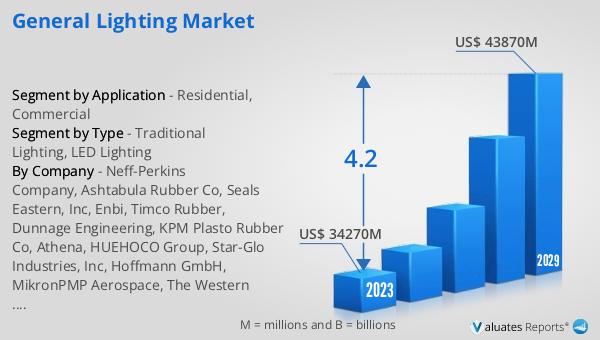
Figure 10. Global General Lighting Production Value (US$ Million), 2020 VS 2024 VS 2031
Figure 11. Global General Lighting Production Value (US$ Million) & (2020-2031)
Figure 12. Global General Lighting Production Capacity (K Units) & (2020-2031)
Figure 13. Global General Lighting Production (K Units) & (2020-2031)
Figure 14. Global General Lighting Average Price (USD/Unit) & (2020-2031)
Figure 15. General Lighting Report Years Considered
Figure 16. General Lighting Production Share by Manufacturers in 2024
Figure 17. Global General Lighting Production Value Share by Manufacturers (2024)
Figure 18. General Lighting Market Share by Company Type (Tier 1, Tier 2, and Tier 3): 2020 VS 2024
Figure 19. The Global 5 and 10 Largest Players: Market Share by General Lighting Revenue in 2024
Figure 20. Global General Lighting Production Value by Region: 2020 VS 2024 VS 2031 (US$ Million)
Figure 21. Global General Lighting Production Value Market Share by Region: 2020 VS 2024 VS 2031
Figure 22. Global General Lighting Production Comparison by Region: 2020 VS 2024 VS 2031 (K Units)
Figure 23. Global General Lighting Production Market Share by Region: 2020 VS 2024 VS 2031
Figure 24. North America General Lighting Production Value (US$ Million) Growth Rate (2020-2031)
Figure 25. Europe General Lighting Production Value (US$ Million) Growth Rate (2020-2031)
Figure 26. China General Lighting Production Value (US$ Million) Growth Rate (2020-2031)
Figure 27. Japan General Lighting Production Value (US$ Million) Growth Rate (2020-2031)
Figure 28. Global General Lighting Consumption by Region: 2020 VS 2024 VS 2031 (K Units)
Figure 29. Global General Lighting Consumption Market Share by Region: 2020 VS 2024 VS 2031
Figure 30. North America General Lighting Consumption and Growth Rate (2020-2031) & (K Units)
Figure 31. North America General Lighting Consumption Market Share by Country (2020-2031)
Figure 32. U.S. General Lighting Consumption and Growth Rate (2020-2031) & (K Units)
Figure 33. Canada General Lighting Consumption and Growth Rate (2020-2031) & (K Units)
Figure 34. Europe General Lighting Consumption and Growth Rate (2020-2031) & (K Units)
Figure 35. Europe General Lighting Consumption Market Share by Country (2020-2031)
Figure 36. Germany General Lighting Consumption and Growth Rate (2020-2031) & (K Units)
Figure 37. France General Lighting Consumption and Growth Rate (2020-2031) & (K Units)
Figure 38. U.K. General Lighting Consumption and Growth Rate (2020-2031) & (K Units)
Figure 39. Italy General Lighting Consumption and Growth Rate (2020-2031) & (K Units)
Figure 40. Netherlands General Lighting Consumption and Growth Rate (2020-2031) & (K Units)
Figure 41. Asia Pacific General Lighting Consumption and Growth Rate (2020-2031) & (K Units)
Figure 42. Asia Pacific General Lighting Consumption Market Share by Region (2020-2031)
Figure 43. China General Lighting Consumption and Growth Rate (2020-2031) & (K Units)
Figure 44. Japan General Lighting Consumption and Growth Rate (2020-2031) & (K Units)
Figure 45. South Korea General Lighting Consumption and Growth Rate (2020-2031) & (K Units)
Figure 46. China Taiwan General Lighting Consumption and Growth Rate (2020-2031) & (K Units)
Figure 47. Southeast Asia General Lighting Consumption and Growth Rate (2020-2031) & (K Units)
Figure 48. India General Lighting Consumption and Growth Rate (2020-2031) & (K Units)
Figure 49. Latin America, Middle East & Africa General Lighting Consumption and Growth Rate (2020-2031) & (K Units)
Figure 50. Latin America, Middle East & Africa General Lighting Consumption Market Share by Country (2020-2031)
Figure 51. Mexico General Lighting Consumption and Growth Rate (2020-2031) & (K Units)
Figure 52. Brazil General Lighting Consumption and Growth Rate (2020-2031) & (K Units)
Figure 53. Turkey General Lighting Consumption and Growth Rate (2020-2031) & (K Units)
Figure 54. GCC Countries General Lighting Consumption and Growth Rate (2020-2031) & (K Units)
Figure 55. Global Production Market Share of General Lighting by Type (2020-2031)
Figure 56. Global Production Value Market Share of General Lighting by Type (2020-2031)
Figure 57. Global General Lighting Price (USD/Unit) by Type (2020-2031)
Figure 58. Global Production Market Share of General Lighting by Application (2020-2031)
Figure 59. Global Production Value Market Share of General Lighting by Application (2020-2031)
Figure 60. Global General Lighting Price (USD/Unit) by Application (2020-2031)
Figure 61. General Lighting Value Chain
Figure 62. Channels of Distribution (Direct Vs Distribution)
Figure 63. Bottom-up and Top-down Approaches for This Report
Figure 64. Data Triangulation