
| Report Metric | Details |
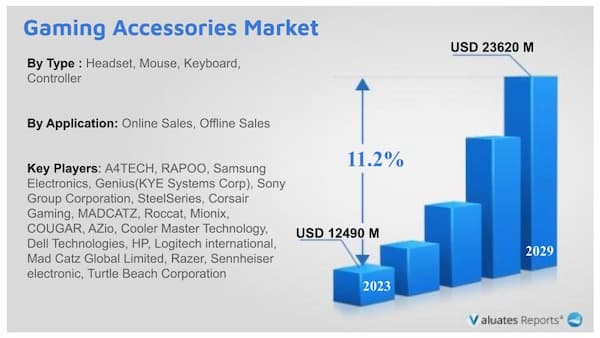
| Report Name | Gaming Accessories Market |
| Segment by Type |
|
| Segment by Application |
|
| By Region |
|
| By Company | A4TECH, RAPOO, Samsung Electronics, Genius(KYE Systems Corp), Sony Group Corporation, SteelSeries, Corsair Gaming, MADCATZ, Roccat, Mionix, COUGAR, AZio, Cooler Master Technology, Dell Technologies, HP, Logitech international, Mad Catz Global Limited, Razer, Sennheiser electronic, Turtle Beach Corporation |
| Forecast units | USD million in value |
| Report coverage | Revenue and volume forecast, company share, competitive landscape, growth factors and trends |
1 Report Overview
1.1 Study Scope
1.2 Market Analysis by Type
1.2.1 Global Gaming Accessories Market Size Growth Rate by Type, 2018 VS 2022 VS 2029
1.2.2 Headset
1.2.3 Mouse
1.2.4 Keyboard
1.2.5 Others
1.3 Market by Application
1.3.1 Global Gaming Accessories Market Size Growth Rate by Application, 2018 VS 2022 VS 2029
1.3.2 Online Sales
1.3.3 Offline Sales
1.4 Assumptions and Limitations
1.5 Study Objectives
1.6 Years Considered
2 Global Growth Trends
2.1 Global Gaming Accessories Market Perspective (2018-2029)
2.2 Global Gaming Accessories Growth Trends by Region
2.2.1 Gaming Accessories Market Size by Region: 2018 VS 2022 VS 2029
2.2.2 Gaming Accessories Historic Market Size by Region (2018-2023)
2.2.3 Gaming Accessories Forecasted Market Size by Region (2024-2029)
2.3 Gaming Accessories Market Dynamics
2.3.1 Gaming Accessories Industry Trends
2.3.2 Gaming Accessories Market Drivers
2.3.3 Gaming Accessories Market Challenges
2.3.4 Gaming Accessories Market Restraints
3 Competition Landscape by Key Players
3.1 Global Revenue Gaming Accessories by Players
3.1.1 Global Gaming Accessories Revenue by Players (2018-2023)
3.1.2 Global Gaming Accessories Revenue Market Share by Players (2018-2023)
3.2 Global Gaming Accessories Market Share by Company Type (Tier 1, Tier 2, and Tier 3)
3.3 Global Key Players of Gaming Accessories, Ranking by Revenue, 2021 VS 2022 VS 2023
3.4 Global Gaming Accessories Market Concentration Ratio
3.4.1 Global Gaming Accessories Market Concentration Ratio (CR5 and HHI)
3.4.2 Global Top 10 and Top 5 Companies by Gaming Accessories Revenue in 2022
3.5 Global Key Players of Gaming Accessories Head office and Area Served
3.6 Global Key Players of Gaming Accessories, Product and Application
3.7 Global Key Players of Gaming Accessories, Date of Enter into This Industry
3.8 Mergers & Acquisitions, Expansion Plans
4 Gaming Accessories Breakdown Data by Type
4.1 Global Gaming Accessories Historic Market Size by Type (2018-2023)
4.2 Global Gaming Accessories Forecasted Market Size by Type (2024-2029)
5 Gaming Accessories Breakdown Data by Application
5.1 Global Gaming Accessories Historic Market Size by Application (2018-2023)
5.2 Global Gaming Accessories Forecasted Market Size by Application (2024-2029)
6 North America
6.1 North America Gaming Accessories Market Size (2018-2029)
6.2 North America Gaming Accessories Market Size by Type
6.2.1 North America Gaming Accessories Market Size by Type (2018-2023)
6.2.2 North America Gaming Accessories Market Size by Type (2024-2029)
6.2.3 North America Gaming Accessories Market Share by Type (2018-2029)
6.3 North America Gaming Accessories Market Size by Application
6.3.1 North America Gaming Accessories Market Size by Application (2018-2023)
6.3.2 North America Gaming Accessories Market Size by Application (2024-2029)
6.3.3 North America Gaming Accessories Market Share by Application (2018-2029)
6.4 North America Gaming Accessories Market Size by Country
6.4.1 North America Gaming Accessories Market Size by Country: 2018 VS 2022 VS 2029
6.4.2 North America Gaming Accessories Market Size by Country (2018-2023)
6.4.3 North America Gaming Accessories Market Size by Country (2024-2029)
6.4.4 United States
6.4.5 Canada
7 Europe
7.1 Europe Gaming Accessories Market Size (2018-2029)
7.2 Europe Gaming Accessories Market Size by Type
7.2.1 Europe Gaming Accessories Market Size by Type (2018-2023)
7.2.2 Europe Gaming Accessories Market Size by Type (2024-2029)
7.2.3 Europe Gaming Accessories Market Share by Type (2018-2029)
7.3 Europe Gaming Accessories Market Size by Application
7.3.1 Europe Gaming Accessories Market Size by Application (2018-2023)
7.3.2 Europe Gaming Accessories Market Size by Application (2024-2029)
7.3.3 Europe Gaming Accessories Market Share by Application (2018-2029)
7.4 Europe Gaming Accessories Market Size by Country
7.4.1 Europe Gaming Accessories Market Size by Country: 2018 VS 2022 VS 2029
7.4.2 Europe Gaming Accessories Market Size by Country (2018-2023)
7.4.3 Europe Gaming Accessories Market Size by Country (2024-2029)
7.4.3 Germany
7.4.4 France
7.4.5 U.K.
7.4.6 Italy
7.4.7 Russia
7.4.8 Nordic Countries
8 China
8.1 China Gaming Accessories Market Size (2018-2029)
8.2 China Gaming Accessories Market Size by Type
8.2.1 China Gaming Accessories Market Size by Type (2018-2023)
8.2.2 China Gaming Accessories Market Size by Type (2024-2029)
8.2.3 China Gaming Accessories Market Share by Type (2018-2029)
8.3 China Gaming Accessories Market Size by Application
8.3.1 China Gaming Accessories Market Size by Application (2018-2023)
8.3.2 China Gaming Accessories Market Size by Application (2024-2029)
8.3.3 China Gaming Accessories Market Share by Application (2018-2029)
9 Asia (excluding China)
9.1 Asia Gaming Accessories Market Size (2018-2029)
9.2 Asia Gaming Accessories Market Size by Type
9.2.1 Asia Gaming Accessories Market Size by Type (2018-2023)
9.2.2 Asia Gaming Accessories Market Size by Type (2024-2029)
9.2.3 Asia Gaming Accessories Market Share by Type (2018-2029)
9.3 Asia Gaming Accessories Market Size by Application
9.3.1 Asia Gaming Accessories Market Size by Application (2018-2023)
9.3.2 Asia Gaming Accessories Market Size by Application (2024-2029)
9.3.3 Asia Gaming Accessories Market Share by Application (2018-2029)
9.4 Asia Gaming Accessories Market Size by Region
9.4.1 Asia Gaming Accessories Market Size by Region: 2018 VS 2022 VS 2029
9.4.2 Asia Gaming Accessories Market Size by Region (2018-2023)
9.4.3 Asia Gaming Accessories Market Size by Region (2024-2029)
9.4.4 Japan
9.4.5 South Korea
9.4.6 China Taiwan
9.4.7 Southeast Asia
9.4.8 India
9.4.9 Australia
10 Middle East, Africa, and Latin America
10.1 Middle East, Africa, and Latin America Gaming Accessories Market Size (2018-2029)
10.2 Middle East, Africa, and Latin America Gaming Accessories Market Size by Type
10.2.1 Middle East, Africa, and Latin America Gaming Accessories Market Size by Type (2018-2023)
10.2.2 Middle East, Africa, and Latin America Gaming Accessories Market Size by Type (2024-2029)
10.2.3 Middle East, Africa, and Latin America Gaming Accessories Market Share by Type (2018-2029)
10.3 Middle East, Africa, and Latin America Gaming Accessories Market Size by Application
10.3.1 Middle East, Africa, and Latin America Gaming Accessories Market Size by Application (2018-2023)
10.3.2 Middle East, Africa, and Latin America Gaming Accessories Market Size by Application (2024-2029)
10.3.3 Middle East, Africa, and Latin America Gaming Accessories Market Share by Application (2018-2029)
10.4 Middle East, Africa, and Latin America Gaming Accessories Market Size by Country
10.4.1 Middle East, Africa, and Latin America Gaming Accessories Market Size by Country: 2018 VS 2022 VS 2029
10.4.2 Middle East, Africa, and Latin America Gaming Accessories Market Size by Country (2018-2023)
10.4.3 Middle East, Africa, and Latin America Gaming Accessories Market Size by Country (2024-2029)
10.4.4 Brazil
10.4.5 Mexico
10.4.6 Turkey
10.4.7 Saudi Arabia
10.4.8 Israel
10.4.9 GCC Countries
11 Key Players Profiles
11.1 Corsair Gaming
11.1.1 Corsair Gaming Company Details
11.1.2 Corsair Gaming Business Overview
11.1.3 Corsair Gaming Gaming Accessories Introduction
11.1.4 Corsair Gaming Revenue in Gaming Accessories Business (2018-2023)
11.1.5 Corsair Gaming Recent Developments
11.2 Sony Corporation
11.2.1 Sony Corporation Company Details
11.2.2 Sony Corporation Business Overview
11.2.3 Sony Corporation Gaming Accessories Introduction
11.2.4 Sony Corporation Revenue in Gaming Accessories Business (2018-2023)
11.2.5 Sony Corporation Recent Developments
11.3 Turtle Beach Corporation
11.3.1 Turtle Beach Corporation Company Details
11.3.2 Turtle Beach Corporation Business Overview
11.3.3 Turtle Beach Corporation Gaming Accessories Introduction
11.3.4 Turtle Beach Corporation Revenue in Gaming Accessories Business (2018-2023)
11.3.5 Turtle Beach Corporation Recent Developments
11.4 Samsung Electronics
11.4.1 Samsung Electronics Company Details
11.4.2 Samsung Electronics Business Overview
11.4.3 Samsung Electronics Gaming Accessories Introduction
11.4.4 Samsung Electronics Revenue in Gaming Accessories Business (2018-2023)
11.4.5 Samsung Electronics Recent Developments
11.5 Mad Catz Global Limited
11.5.1 Mad Catz Global Limited Company Details
11.5.2 Mad Catz Global Limited Business Overview
11.5.3 Mad Catz Global Limited Gaming Accessories Introduction
11.5.4 Mad Catz Global Limited Revenue in Gaming Accessories Business (2018-2023)
11.5.5 Mad Catz Global Limited Recent Developments
11.6 Genius(KYE Systems Corp)
11.6.1 Genius(KYE Systems Corp) Company Details
11.6.2 Genius(KYE Systems Corp) Business Overview
11.6.3 Genius(KYE Systems Corp) Gaming Accessories Introduction
11.6.4 Genius(KYE Systems Corp) Revenue in Gaming Accessories Business (2018-2023)
11.6.5 Genius(KYE Systems Corp) Recent Developments
11.7 MADCATZ
11.7.1 MADCATZ Company Details
11.7.2 MADCATZ Business Overview
11.7.3 MADCATZ Gaming Accessories Introduction
11.7.4 MADCATZ Revenue in Gaming Accessories Business (2018-2023)
11.7.5 MADCATZ Recent Developments
11.8 Cooler Master Technology
11.8.1 Cooler Master Technology Company Details
11.8.2 Cooler Master Technology Business Overview
11.8.3 Cooler Master Technology Gaming Accessories Introduction
11.8.4 Cooler Master Technology Revenue in Gaming Accessories Business (2018-2023)
11.8.5 Cooler Master Technology Recent Developments
11.9 HP
11.9.1 HP Company Details
11.9.2 HP Business Overview
11.9.3 HP Gaming Accessories Introduction
11.9.4 HP Revenue in Gaming Accessories Business (2018-2023)
11.9.5 HP Recent Developments
11.10 Logitech international
11.10.1 Logitech international Company Details
11.10.2 Logitech international Business Overview
11.10.3 Logitech international Gaming Accessories Introduction
11.10.4 Logitech international Revenue in Gaming Accessories Business (2018-2023)
11.10.5 Logitech international Recent Developments
11.11 Razer
11.11.1 Razer Company Details
11.11.2 Razer Business Overview
11.11.3 Razer Gaming Accessories Introduction
11.11.4 Razer Revenue in Gaming Accessories Business (2018-2023)
11.11.5 Razer Recent Developments
11.12 Sennheiser electronic
11.12.1 Sennheiser electronic Company Details
11.12.2 Sennheiser electronic Business Overview
11.12.3 Sennheiser electronic Gaming Accessories Introduction
11.12.4 Sennheiser electronic Revenue in Gaming Accessories Business (2018-2023)
11.12.5 Sennheiser electronic Recent Developments
11.13 A4TECH
11.13.1 A4TECH Company Details
11.13.2 A4TECH Business Overview
11.13.3 A4TECH Gaming Accessories Introduction
11.13.4 A4TECH Revenue in Gaming Accessories Business (2018-2023)
11.13.5 A4TECH Recent Developments
11.14 RAPOO
11.14.1 RAPOO Company Details
11.14.2 RAPOO Business Overview
11.14.3 RAPOO Gaming Accessories Introduction
11.14.4 RAPOO Revenue in Gaming Accessories Business (2018-2023)
11.14.5 RAPOO Recent Developments
11.15 SteelSeries
11.15.1 SteelSeries Company Details
11.15.2 SteelSeries Business Overview
11.15.3 SteelSeries Gaming Accessories Introduction
11.15.4 SteelSeries Revenue in Gaming Accessories Business (2018-2023)
11.15.5 SteelSeries Recent Developments
11.16 Roccat
11.16.1 Roccat Company Details
11.16.2 Roccat Business Overview
11.16.3 Roccat Gaming Accessories Introduction
11.16.4 Roccat Revenue in Gaming Accessories Business (2018-2023)
11.16.5 Roccat Recent Developments
11.17 Mionix
11.17.1 Mionix Company Details
11.17.2 Mionix Business Overview
11.17.3 Mionix Gaming Accessories Introduction
11.17.4 Mionix Revenue in Gaming Accessories Business (2018-2023)
11.17.5 Mionix Recent Developments
11.18 COUGAR
11.18.1 COUGAR Company Details
11.18.2 COUGAR Business Overview
11.18.3 COUGAR Gaming Accessories Introduction
11.18.4 COUGAR Revenue in Gaming Accessories Business (2018-2023)
11.18.5 COUGAR Recent Developments
11.19 AZio
11.19.1 AZio Company Details
11.19.2 AZio Business Overview
11.19.3 AZio Gaming Accessories Introduction
11.19.4 AZio Revenue in Gaming Accessories Business (2018-2023)
11.19.5 AZio Recent Developments
11.20 Corsair Gaming
11.20.1 Corsair Gaming Company Details
11.20.2 Corsair Gaming Business Overview
11.20.3 Corsair Gaming Gaming Accessories Introduction
11.20.4 Corsair Gaming Revenue in Gaming Accessories Business (2018-2023)
11.20.5 Corsair Gaming Recent Developments
11.21 Plantronics
11.21.1 Plantronics Company Details
11.21.2 Plantronics Business Overview
11.21.3 Plantronics Gaming Accessories Introduction
11.21.4 Plantronics Revenue in Gaming Accessories Business (2018-2023)
11.21.5 Plantronics Recent Developments
11.22 Audio-Technica
11.22.1 Audio-Technica Company Details
11.22.2 Audio-Technica Business Overview
11.22.3 Audio-Technica Gaming Accessories Introduction
11.22.4 Audio-Technica Revenue in Gaming Accessories Business (2018-2023)
11.22.5 Audio-Technica Recent Developments
11.23 Guangdong Kotion Electroacoustic Technology
11.23.1 Guangdong Kotion Electroacoustic Technology Company Details
11.23.2 Guangdong Kotion Electroacoustic Technology Business Overview
11.23.3 Guangdong Kotion Electroacoustic Technology Gaming Accessories Introduction
11.23.4 Guangdong Kotion Electroacoustic Technology Revenue in Gaming Accessories Business (2018-2023)
11.23.5 Guangdong Kotion Electroacoustic Technology Recent Developments
11.24 Trust International
11.24.1 Trust International Company Details
11.24.2 Trust International Business Overview
11.24.3 Trust International Gaming Accessories Introduction
11.24.4 Trust International Revenue in Gaming Accessories Business (2018-2023)
11.24.5 Trust International Recent Developments
12 Analyst's Viewpoints/Conclusions
13 Appendix
13.1 Research Methodology
13.1.1 Methodology/Research Approach
13.1.2 Data Source
13.2 Disclaimer
List of Tables
Table 1. Global Gaming Accessories Market Size Growth Rate by Type (US$ Million), 2018 VS 2022 VS 2029
Table 2. Key Players of Headset
Table 3. Key Players of Mouse
Table 4. Key Players of Keyboard
Table 5. Key Players of Others
Table 6. Global Gaming Accessories Market Size Growth Rate by Application (US$ Million), 2018 VS 2022 VS 2029
Table 7. Global Gaming Accessories Market Size Growth Rate (CAGR) by Region (US$ Million): 2018 VS 2022 VS 2029
Table 8. Global Gaming Accessories Market Size by Region (2018-2023) & (US$ Million)
Table 9. Global Gaming Accessories Market Share by Region (2018-2023)
Table 10. Global Gaming Accessories Forecasted Market Size by Region (2024-2029) & (US$ Million)
Table 11. Global Gaming Accessories Market Share by Region (2024-2029)
Table 12. Gaming Accessories Market Trends
Table 13. Gaming Accessories Market Drivers
Table 14. Gaming Accessories Market Challenges
Table 15. Gaming Accessories Market Restraints
Table 16. Global Gaming Accessories Revenue by Players (2018-2023) & (US$ Million)
Table 17. Global Gaming Accessories Revenue Share by Players (2018-2023)
Table 18. Global Top Gaming Accessories by Company Type (Tier 1, Tier 2, and Tier 3) & (based on the Revenue in Gaming Accessories as of 2022)
Table 19. Global Gaming Accessories Industry Ranking 2021 VS 2022 VS 2023
Table 20. Global 5 Largest Players Market Share by Gaming Accessories Revenue (CR5 and HHI) & (2018-2023)
Table 21. Global Key Players of Gaming Accessories, Headquarters and Area Served
Table 22. Global Key Players of Gaming Accessories, Product and Application
Table 23. Global Key Players of Gaming Accessories, Product and Application
Table 24. Mergers & Acquisitions, Expansion Plans
Table 25. Global Gaming Accessories Market Size by Type (2018-2023) & (US$ Million)
Table 26. Global Gaming Accessories Revenue Market Share by Type (2018-2023)
Table 27. Global Gaming Accessories Forecasted Market Size by Type (2024-2029) & (US$ Million)
Table 28. Global Gaming Accessories Revenue Market Share by Type (2024-2029)
Table 29. Global Gaming Accessories Market Size by Application (2018-2023) & (US$ Million)
Table 30. Global Gaming Accessories Revenue Share by Application (2018-2023)
Table 31. Global Gaming Accessories Forecasted Market Size by Application (2024-2029) & (US$ Million)
Table 32. Global Gaming Accessories Revenue Share by Application (2024-2029)
Table 33. North America Gaming Accessories Market Size by Type (2018-2023) & (US$ Million)
Table 34. North America Gaming Accessories Market Size by Type (2024-2029) & (US$ Million)
Table 35. North America Gaming Accessories Market Size by Application (2018-2023) & (US$ Million)
Table 36. North America Gaming Accessories Market Size by Application (2024-2029) & (US$ Million)
Table 37. North America Gaming Accessories Growth Rate (CAGR) by Country (US$ Million): 2018 VS 2022 VS 2029
Table 38. North America Gaming Accessories Market Size by Country (2018-2023) & (US$ Million)
Table 39. North America Gaming Accessories Market Size by Country (2024-2029) & (US$ Million)
Table 40. Europe Gaming Accessories Market Size by Type (2018-2023) & (US$ Million)
Table 41. Europe Gaming Accessories Market Size by Type (2024-2029) & (US$ Million)
Table 42. Europe Gaming Accessories Market Size by Application (2018-2023) & (US$ Million)
Table 43. Europe Gaming Accessories Market Size by Application (2024-2029) & (US$ Million)
Table 44. Europe Gaming Accessories Growth Rate (CAGR) by Country (US$ Million): 2018 VS 2022 VS 2029
Table 45. Europe Gaming Accessories Market Size by Country (2018-2023) & (US$ Million)
Table 46. Europe Gaming Accessories Market Size by Country (2024-2029) & (US$ Million)
Table 47. China Gaming Accessories Market Size by Type (2018-2023) & (US$ Million)
Table 48. China Gaming Accessories Market Size by Type (2024-2029) & (US$ Million)
Table 49. China Gaming Accessories Market Size by Application (2018-2023) & (US$ Million)
Table 50. China Gaming Accessories Market Size by Application (2024-2029) & (US$ Million)
Table 51. Asia Gaming Accessories Market Size by Type (2018-2023) & (US$ Million)
Table 52. Asia Gaming Accessories Market Size by Type (2024-2029) & (US$ Million)
Table 53. Asia Gaming Accessories Market Size by Application (2018-2023) & (US$ Million)
Table 54. Asia Gaming Accessories Market Size by Application (2024-2029) & (US$ Million)
Table 55. Asia Gaming Accessories Growth Rate (CAGR) by Region (US$ Million): 2018 VS 2022 VS 2029
Table 56. Asia Gaming Accessories Market Size by Region (2018-2023) & (US$ Million)
Table 57. Asia Gaming Accessories Market Size by Region (2024-2029) & (US$ Million)
Table 58. Middle East, Africa, and Latin America Gaming Accessories Market Size by Type (2018-2023) & (US$ Million)
Table 59. Middle East, Africa, and Latin America Gaming Accessories Market Size by Type (2024-2029) & (US$ Million)
Table 60. Middle East, Africa, and Latin America Gaming Accessories Market Size by Application (2018-2023) & (US$ Million)
Table 61. Middle East, Africa, and Latin America Gaming Accessories Market Size by Application (2024-2029) & (US$ Million)
Table 62. Middle East, Africa, and Latin America Gaming Accessories Growth Rate (CAGR) by Country (US$ Million): 2018 VS 2022 VS 2029
Table 63. Middle East, Africa, and Latin America Gaming Accessories Market Size by Country (2018-2023) & (US$ Million)
Table 64. Middle East, Africa, and Latin America Gaming Accessories Market Size by Country (2024-2029) & (US$ Million)
Table 65. Corsair Gaming Company Details
Table 66. Corsair Gaming Business Overview
Table 67. Corsair Gaming Gaming Accessories Product
Table 68. Corsair Gaming Revenue in Gaming Accessories Business (2018-2023) & (US$ Million)
Table 69. Corsair Gaming Recent Developments
Table 70. Sony Corporation Company Details
Table 71. Sony Corporation Business Overview
Table 72. Sony Corporation Gaming Accessories Product
Table 73. Sony Corporation Revenue in Gaming Accessories Business (2018-2023) & (US$ Million)
Table 74. Sony Corporation Recent Developments
Table 75. Turtle Beach Corporation Company Details
Table 76. Turtle Beach Corporation Business Overview
Table 77. Turtle Beach Corporation Gaming Accessories Product
Table 78. Turtle Beach Corporation Revenue in Gaming Accessories Business (2018-2023) & (US$ Million)
Table 79. Turtle Beach Corporation Recent Developments
Table 80. Samsung Electronics Company Details
Table 81. Samsung Electronics Business Overview
Table 82. Samsung Electronics Gaming Accessories Product
Table 83. Samsung Electronics Revenue in Gaming Accessories Business (2018-2023) & (US$ Million)
Table 84. Samsung Electronics Recent Developments
Table 85. Mad Catz Global Limited Company Details
Table 86. Mad Catz Global Limited Business Overview
Table 87. Mad Catz Global Limited Gaming Accessories Product
Table 88. Mad Catz Global Limited Revenue in Gaming Accessories Business (2018-2023) & (US$ Million)
Table 89. Mad Catz Global Limited Recent Developments
Table 90. Genius(KYE Systems Corp) Company Details
Table 91. Genius(KYE Systems Corp) Business Overview
Table 92. Genius(KYE Systems Corp) Gaming Accessories Product
Table 93. Genius(KYE Systems Corp) Revenue in Gaming Accessories Business (2018-2023) & (US$ Million)
Table 94. Genius(KYE Systems Corp) Recent Developments
Table 95. MADCATZ Company Details
Table 96. MADCATZ Business Overview
Table 97. MADCATZ Gaming Accessories Product
Table 98. MADCATZ Revenue in Gaming Accessories Business (2018-2023) & (US$ Million)
Table 99. MADCATZ Recent Developments
Table 100. Cooler Master Technology Company Details
Table 101. Cooler Master Technology Business Overview
Table 102. Cooler Master Technology Gaming Accessories Product
Table 103. Cooler Master Technology Revenue in Gaming Accessories Business (2018-2023) & (US$ Million)
Table 104. Cooler Master Technology Recent Developments
Table 105. HP Company Details
Table 106. HP Business Overview
Table 107. HP Gaming Accessories Product
Table 108. HP Revenue in Gaming Accessories Business (2018-2023) & (US$ Million)
Table 109. HP Recent Developments
Table 110. Logitech international Company Details
Table 111. Logitech international Business Overview
Table 112. Logitech international Gaming Accessories Product
Table 113. Logitech international Revenue in Gaming Accessories Business (2018-2023) & (US$ Million)
Table 114. Logitech international Recent Developments
Table 115. Razer Company Details
Table 116. Razer Business Overview
Table 117. Razer Gaming Accessories Product
Table 118. Razer Revenue in Gaming Accessories Business (2018-2023) & (US$ Million)
Table 119. Razer Recent Developments
Table 120. Sennheiser electronic Company Details
Table 121. Sennheiser electronic Business Overview
Table 122. Sennheiser electronic Gaming Accessories Product
Table 123. Sennheiser electronic Revenue in Gaming Accessories Business (2018-2023) & (US$ Million)
Table 124. Sennheiser electronic Recent Developments
Table 125. A4TECH Company Details
Table 126. A4TECH Business Overview
Table 127. A4TECH Gaming Accessories Product
Table 128. A4TECH Revenue in Gaming Accessories Business (2018-2023) & (US$ Million)
Table 129. A4TECH Recent Developments
Table 130. RAPOO Company Details
Table 131. RAPOO Business Overview
Table 132. RAPOO Gaming Accessories Product
Table 133. RAPOO Revenue in Gaming Accessories Business (2018-2023) & (US$ Million)
Table 134. RAPOO Recent Developments
Table 135. SteelSeries Company Details
Table 136. SteelSeries Business Overview
Table 137. SteelSeries Gaming Accessories Product
Table 138. SteelSeries Revenue in Gaming Accessories Business (2018-2023) & (US$ Million)
Table 139. SteelSeries Recent Developments
Table 140. Roccat Company Details
Table 141. Roccat Business Overview
Table 142. Roccat Gaming Accessories Product
Table 143. Roccat Revenue in Gaming Accessories Business (2018-2023) & (US$ Million)
Table 144. Roccat Recent Developments
Table 145. Mionix Company Details
Table 146. Mionix Business Overview
Table 147. Mionix Gaming Accessories Product
Table 148. Mionix Revenue in Gaming Accessories Business (2018-2023) & (US$ Million)
Table 149. Mionix Recent Developments
Table 150. COUGAR Company Details
Table 151. COUGAR Business Overview
Table 152. COUGAR Gaming Accessories Product
Table 153. COUGAR Revenue in Gaming Accessories Business (2018-2023) & (US$ Million)
Table 154. COUGAR Recent Developments
Table 155. AZio Company Details
Table 156. AZio Business Overview
Table 157. AZio Gaming Accessories Product
Table 158. AZio Revenue in Gaming Accessories Business (2018-2023) & (US$ Million)
Table 159. AZio Recent Developments
Table 160. Corsair Gaming Company Details
Table 161. Corsair Gaming Business Overview
Table 162. Corsair Gaming Gaming Accessories Product
Table 163. Corsair Gaming Revenue in Gaming Accessories Business (2018-2023) & (US$ Million)
Table 164. Corsair Gaming Recent Developments
Table 165. Plantronics Company Details
Table 166. Plantronics Business Overview
Table 167. Plantronics Gaming Accessories Product
Table 168. Plantronics Revenue in Gaming Accessories Business (2018-2023) & (US$ Million)
Table 169. Plantronics Recent Developments
Table 170. Audio-Technica Company Details
Table 171. Audio-Technica Business Overview
Table 172. Audio-Technica Gaming Accessories Product
Table 173. Audio-Technica Revenue in Gaming Accessories Business (2018-2023) & (US$ Million)
Table 174. Audio-Technica Recent Developments
Table 175. Guangdong Kotion Electroacoustic Technology Company Details
Table 176. Guangdong Kotion Electroacoustic Technology Business Overview
Table 177. Guangdong Kotion Electroacoustic Technology Gaming Accessories Product
Table 178. Guangdong Kotion Electroacoustic Technology Revenue in Gaming Accessories Business (2018-2023) & (US$ Million)
Table 179. Guangdong Kotion Electroacoustic Technology Recent Developments
Table 180. Trust International Company Details
Table 181. Trust International Business Overview
Table 182. Trust International Gaming Accessories Product
Table 183. Trust International Revenue in Gaming Accessories Business (2018-2023) & (US$ Million)
Table 184. Trust International Recent Developments
Table 185. Research Programs/Design for This Report
Table 186. Key Data Information from Secondary Sources
Table 187. Key Data Information from Primary Sources
List of Figures
Figure 1. Global Gaming Accessories Market Size Growth Rate by Type, 2018 VS 2022 VS 2029 (US$ Million)
Figure 2. Global Gaming Accessories Market Share by Type: 2022 VS 2029
Figure 3. Headset Features
Figure 4. Mouse Features
Figure 5. Keyboard Features
Figure 6. Others Features
Figure 7. Global Gaming Accessories Market Size Growth Rate by Application, 2018 VS 2022 VS 2029 (US$ Million)
Figure 8. Global Gaming Accessories Market Share by Application: 2022 VS 2029
Figure 9. Online Sales Case Studies
Figure 10. Offline Sales Case Studies
Figure 11. Gaming Accessories Report Years Considered
Figure 12. Global Gaming Accessories Market Size (US$ Million), Year-over-Year: 2018-2029
Figure 13. Global Gaming Accessories Market Size, (US$ Million), 2018 VS 2022 VS 2029
Figure 14. Global Gaming Accessories Market Share by Region: 2022 VS 2029
Figure 15. Global Gaming Accessories Market Share by Players in 2022
Figure 16. Global Top Gaming Accessories Players by Company Type (Tier 1, Tier 2, and Tier 3) & (based on the Revenue in Gaming Accessories as of 2022)
Figure 17. The Top 10 and 5 Players Market Share by Gaming Accessories Revenue in 2022
Figure 18. North America Gaming Accessories Market Size YoY Growth (2018-2029) & (US$ Million)
Figure 19. North America Gaming Accessories Market Share by Type (2018-2029)
Figure 20. North America Gaming Accessories Market Share by Application (2018-2029)
Figure 21. North America Gaming Accessories Market Share by Country (2018-2029)
Figure 22. United States Gaming Accessories Market Size YoY Growth (2018-2029) & (US$ Million)
Figure 23. Canada Gaming Accessories Market Size YoY Growth (2018-2029) & (US$ Million)
Figure 24. Europe Gaming Accessories Market Size YoY (2018-2029) & (US$ Million)
Figure 25. Europe Gaming Accessories Market Share by Type (2018-2029)
Figure 26. Europe Gaming Accessories Market Share by Application (2018-2029)
Figure 27. Europe Gaming Accessories Market Share by Country (2018-2029)
Figure 28. Germany Gaming Accessories Market Size YoY Growth (2018-2029) & (US$ Million)
Figure 29. France Gaming Accessories Market Size YoY Growth (2018-2029) & (US$ Million)
Figure 30. U.K. Gaming Accessories Market Size YoY Growth (2018-2029) & (US$ Million)
Figure 31. Italy Gaming Accessories Market Size YoY Growth (2018-2029) & (US$ Million)
Figure 32. Russia Gaming Accessories Market Size YoY Growth (2018-2029) & (US$ Million)
Figure 33. Nordic Countries Gaming Accessories Market Size YoY Growth (2018-2029) & (US$ Million)
Figure 34. China Gaming Accessories Market Size YoY (2018-2029) & (US$ Million)
Figure 35. China Gaming Accessories Market Share by Type (2018-2029)
Figure 36. China Gaming Accessories Market Share by Application (2018-2029)
Figure 37. Asia Gaming Accessories Market Size YoY (2018-2029) & (US$ Million)
Figure 38. Asia Gaming Accessories Market Share by Type (2018-2029)
Figure 39. Asia Gaming Accessories Market Share by Application (2018-2029)
Figure 40. Asia Gaming Accessories Market Share by Region (2018-2029)
Figure 41. Japan Gaming Accessories Market Size YoY Growth (2018-2029) & (US$ Million)
Figure 42. South Korea Gaming Accessories Market Size YoY Growth (2018-2029) & (US$ Million)
Figure 43. China Taiwan Gaming Accessories Market Size YoY Growth (2018-2029) & (US$ Million)
Figure 44. Southeast Asia Gaming Accessories Market Size YoY Growth (2018-2029) & (US$ Million)
Figure 45. India Gaming Accessories Market Size YoY Growth (2018-2029) & (US$ Million)
Figure 46. Australia Gaming Accessories Market Size YoY Growth (2018-2029) & (US$ Million)
Figure 47. Middle East, Africa, and Latin America Gaming Accessories Market Size YoY (2018-2029) & (US$ Million)
Figure 48. Middle East, Africa, and Latin America Gaming Accessories Market Share by Type (2018-2029)
Figure 49. Middle East, Africa, and Latin America Gaming Accessories Market Share by Application (2018-2029)
Figure 50. Middle East, Africa, and Latin America Gaming Accessories Market Share by Country (2018-2029)
Figure 51. Brazil Gaming Accessories Market Size YoY Growth (2018-2029) & (US$ Million)
Figure 52. Mexico Gaming Accessories Market Size YoY Growth (2018-2029) & (US$ Million)
Figure 53. Turkey Gaming Accessories Market Size YoY Growth (2018-2029) & (US$ Million)
Figure 54. Saudi Arabia Gaming Accessories Market Size YoY Growth (2018-2029) & (US$ Million)
Figure 55. Israel Gaming Accessories Market Size YoY Growth (2018-2029) & (US$ Million)
Figure 56. GCC Countries Gaming Accessories Market Size YoY Growth (2018-2029) & (US$ Million)
Figure 57. Corsair Gaming Revenue Growth Rate in Gaming Accessories Business (2018-2023)
Figure 58. Sony Corporation Revenue Growth Rate in Gaming Accessories Business (2018-2023)
Figure 59. Turtle Beach Corporation Revenue Growth Rate in Gaming Accessories Business (2018-2023)
Figure 60. Samsung Electronics Revenue Growth Rate in Gaming Accessories Business (2018-2023)
Figure 61. Mad Catz Global Limited Revenue Growth Rate in Gaming Accessories Business (2018-2023)
Figure 62. Genius(KYE Systems Corp) Revenue Growth Rate in Gaming Accessories Business (2018-2023)
Figure 63. MADCATZ Revenue Growth Rate in Gaming Accessories Business (2018-2023)
Figure 64. Cooler Master Technology Revenue Growth Rate in Gaming Accessories Business (2018-2023)
Figure 65. HP Revenue Growth Rate in Gaming Accessories Business (2018-2023)
Figure 66. Logitech international Revenue Growth Rate in Gaming Accessories Business (2018-2023)
Figure 67. Razer Revenue Growth Rate in Gaming Accessories Business (2018-2023)
Figure 68. Sennheiser electronic Revenue Growth Rate in Gaming Accessories Business (2018-2023)
Figure 69. A4TECH Revenue Growth Rate in Gaming Accessories Business (2018-2023)
Figure 70. RAPOO Revenue Growth Rate in Gaming Accessories Business (2018-2023)
Figure 71. SteelSeries Revenue Growth Rate in Gaming Accessories Business (2018-2023)
Figure 72. Roccat Revenue Growth Rate in Gaming Accessories Business (2018-2023)
Figure 73. Mionix Revenue Growth Rate in Gaming Accessories Business (2018-2023)
Figure 74. COUGAR Revenue Growth Rate in Gaming Accessories Business (2018-2023)
Figure 75. AZio Revenue Growth Rate in Gaming Accessories Business (2018-2023)
Figure 76. Corsair Gaming Revenue Growth Rate in Gaming Accessories Business (2018-2023)
Figure 77. Plantronics Revenue Growth Rate in Gaming Accessories Business (2018-2023)
Figure 78. Audio-Technica Revenue Growth Rate in Gaming Accessories Business (2018-2023)
Figure 79. Guangdong Kotion Electroacoustic Technology Revenue Growth Rate in Gaming Accessories Business (2018-2023)
Figure 80. Trust International Revenue Growth Rate in Gaming Accessories Business (2018-2023)
Figure 81. Bottom-up and Top-down Approaches for This Report
Figure 82. Data Triangulation
Figure 83. Key Executives Interviewed
$4900
$7350
$9800
HAVE A QUERY?
OUR CUSTOMER
