0
U.S. (TOLL FREE)
+1 (315) 215-3225
Automative

0
U.S. (TOLL FREE)
+1 (315) 215-3225
Global Laboratory Fully Automated Filtration Technology Market Research Report 2025
Published Date: November 2025
|
Report Code: QYRE-Auto-2J20256
Home | Market Reports | Science
Global Laboratory Fully Automated Filtration Technology Market Research Report 2025
BUY CHAPTERS

Global Laboratory Fully Automated Filtration Technology Market Research Report 2025

Code: QYRE-Auto-2J20256
Report
November 2025
Pages:87
QYResearch
Buy Now with 15% Discount
DESCRIPTION
TABLE OF CONTENT
TABLES & FIGURES

Laboratory Fully Automated Filtration Technology Market Size

The global market for Laboratory Fully Automated Filtration Technology was valued at US$ 1100 million in the year 2024 and is projected to reach a revised size of US$ 1861 million by 2031, growing at a CAGR of 7.8% during the forecast period.

Laboratory Fully Automated Filtration Technology Market

Laboratory Fully Automated Filtration Technology Market

Laboratory Fully Automated Filtration Technology encompasses integrated systems that automate the entire filtration process, including sample handling, filtration, washing, and disposal. These systems enhance reproducibility, throughput, and safety in applications such as sterility testing, sample preparation for HPLC, and microbial analysis within pharmaceutical, biotechnology, and food quality control laboratories.
North American market for Laboratory Fully Automated Filtration Technology is estimated to increase from $ million in 2024 to reach $ million by 2031, at a CAGR of % during the forecast period of 2025 through 2031.
Asia-Pacific market for Laboratory Fully Automated Filtration Technology is estimated to increase from $ million in 2024 to reach $ million by 2031, at a CAGR of % during the forecast period of 2025 through 2031.
The global market for Laboratory Fully Automated Filtration Technology in Pharmaceutical & Biopharmaceutical Companies is estimated to increase from $ million in 2024 to $ million by 2031, at a CAGR of % during the forecast period of 2025 through 2031.
The major global companies of Laboratory Fully Automated Filtration Technology include Merck Millipore, Pall Corporation, Sartorius Group, 3M Company, GE Healthcare, Cantel Medical, Thermo Fisher Scientific, Sigma-Aldrich, Veolia Water Technologies, Macherey–Nagel, etc. In 2024, the world's top three vendors accounted for approximately % of the revenue.
This report aims to provide a comprehensive presentation of the global market for Laboratory Fully Automated Filtration Technology, with both quantitative and qualitative analysis, to help readers develop business/growth strategies, assess the market competitive situation, analyze their position in the current marketplace, and make informed business decisions regarding Laboratory Fully Automated Filtration Technology.
The Laboratory Fully Automated Filtration Technology market size, estimations, and forecasts are provided in terms of and revenue ($ millions), considering 2024 as the base year, with history and forecast data for the period from 2020 to 2031. This report segments the global Laboratory Fully Automated Filtration Technology market comprehensively. Regional market sizes, concerning products by Type, by Application, by Automation Level and by players, are also provided.
For a more in-depth understanding of the market, the report provides profiles of the competitive landscape, key competitors, and their respective market ranks. The report also discusses technological trends and new product developments.
The report will help the Laboratory Fully Automated Filtration Technology companies, new entrants, and industry chain related companies in this market with information on the revenues for the overall market and the sub-segments across the different segments, by company, by Type, by Application, and by regions.
Market Segmentation

Scope of Laboratory Fully Automated Filtration Technology Market Report

Report Metric Details
Report Name Laboratory Fully Automated Filtration Technology Market
Accounted market size in year US$ 1100 million
Forecasted market size in 2031 US$ 1861 million
CAGR 7.8%
Base Year year
Forecasted years 2025 - 2031
Segment by Type
  • Microfiltration Technology
  • Reverse Osmosis Technology
  • Ultrafiltration Technology
  • Vacuum Filtration Technology
  • Nanofiltration Technology
Segment by Automation Level
  • Fully Automated Filtration System
  • Programmable Filtration Unit
  • Robotic Integrated Filtration Platform
Segment by Application
  • Pharmaceutical & Biopharmaceutical Companies
  • Academic & Research Institutes
  • Food & Beverage Companies
  • Hospital & Diagnostic Laboratories
By Region
  • North America (United States, Canada)
  • Europe (Germany, France, UK, Italy, Russia) Rest of Europe
  • Nordic Countries
  • Asia-Pacific (China, Japan, South Korea)
  • Southeast Asia (India, Australia)
  • Rest of Asia
  • Latin America (Mexico, Brazil)
  • Rest of Latin America
  • Middle East & Africa (Turkey, Saudi Arabia, UAE, Rest of MEA)
By Company Merck Millipore, Pall Corporation, Sartorius Group, 3M Company, GE Healthcare, Cantel Medical, Thermo Fisher Scientific, Sigma-Aldrich, Veolia Water Technologies, Macherey–Nagel, Ahlstrom, Sartorius, Coleparmer, Membrane Solutions, Rocker Scientific
Forecast units USD million in value
Report coverage Revenue and volume forecast, company share, competitive landscape, growth factors and trends

Chapter Outline

  • Chapter 1: Introduces the report scope of the report, executive summary of different market segments (by Type, by Application, by Automation Level etc), including the market size of each market segment, future development potential, and so on. It offers a high-level view of the current state of the market and its likely evolution in the short to mid-term, and long term.
  • Chapter 2: Introduces executive summary of global market size, regional market size, this section also introduces the market dynamics, latest developments of the market, the driving factors and restrictive factors of the market, the challenges and risks faced by companies in the industry, and the analysis of relevant policies in the industry.
  • Chapter 3: Detailed analysis of Laboratory Fully Automated Filtration Technology company competitive landscape, revenue market share, latest development plan, merger, and acquisition information, etc.
  • Chapter 4: Provides the analysis of various market segments by Type, covering the market size and development potential of each market segment, to help readers find the blue ocean market in different market segments.
  • Chapter 5: Provides the analysis of various market segments by Application, covering the market size and development potential of each market segment, to help readers find the blue ocean market in different downstream markets.
  • Chapter 6, 7, 8, 9, 10: North America, Europe, Asia Pacific, Latin America, Middle East and Africa segment by country. It provides a quantitative analysis of the market size and development potential of each region and its main countries and introduces the market development, future development prospects, market space, and capacity of each country in the world.
  • Chapter 11: Provides profiles of key players, introducing the basic situation of the main companies in the market in detail, including product sales, revenue, price, gross margin, product introduction, recent development, etc.
  • Chapter 12: The main points and conclusions of the report.

FAQ for this report

How fast is Laboratory Fully Automated Filtration Technology Market growing?

Ans: The Laboratory Fully Automated Filtration Technology Market witnessing a CAGR of 7.8% during the forecast period 2025-2031.

What is the Laboratory Fully Automated Filtration Technology Market size in 2031?

Ans: The Laboratory Fully Automated Filtration Technology Market size in 2031 will be US$ 1861 million.

Who are the main players in the Laboratory Fully Automated Filtration Technology Market report?

Ans: The main players in the Laboratory Fully Automated Filtration Technology Market are Merck Millipore, Pall Corporation, Sartorius Group, 3M Company, GE Healthcare, Cantel Medical, Thermo Fisher Scientific, Sigma-Aldrich, Veolia Water Technologies, Macherey–Nagel, Ahlstrom, Sartorius, Coleparmer, Membrane Solutions, Rocker Scientific

What are the Application segmentation covered in the Laboratory Fully Automated Filtration Technology Market report?

Ans: The Applications covered in the Laboratory Fully Automated Filtration Technology Market report are Pharmaceutical & Biopharmaceutical Companies, Academic & Research Institutes, Food & Beverage Companies, Hospital & Diagnostic Laboratories

What are the Type segmentation covered in the Laboratory Fully Automated Filtration Technology Market report?

Ans: The Types covered in the Laboratory Fully Automated Filtration Technology Market report are Microfiltration Technology, Reverse Osmosis Technology, Ultrafiltration Technology, Vacuum Filtration Technology, Nanofiltration Technology

1 Report Overview
1.1 Study Scope
1.2 Market Analysis by Type
1.2.1 Global Laboratory Fully Automated Filtration Technology Market Size Growth Rate by Type: 2020 VS 2024 VS 2031
1.2.2 Microfiltration Technology
1.2.3 Reverse Osmosis Technology
1.2.4 Ultrafiltration Technology
1.2.5 Vacuum Filtration Technology
1.2.6 Nanofiltration Technology
1.3 Market by Automation Level
1.3.1 Global Laboratory Fully Automated Filtration Technology Market Size Growth Rate by Automation Level: 2020 VS 2024 VS 2031
1.3.2 Fully Automated Filtration System
1.3.3 Programmable Filtration Unit
1.3.4 Robotic Integrated Filtration Platform
1.4 Market by Application
1.4.1 Global Laboratory Fully Automated Filtration Technology Market Growth by Application: 2020 VS 2024 VS 2031
1.4.2 Pharmaceutical & Biopharmaceutical Companies
1.4.3 Academic & Research Institutes
1.4.4 Food & Beverage Companies
1.4.5 Hospital & Diagnostic Laboratories
1.5 Assumptions and Limitations
1.6 Study Objectives
1.7 Years Considered
2 Global Growth Trends
2.1 Global Laboratory Fully Automated Filtration Technology Market Perspective (2020-2031)
2.2 Global Laboratory Fully Automated Filtration Technology Growth Trends by Region
2.2.1 Global Laboratory Fully Automated Filtration Technology Market Size by Region: 2020 VS 2024 VS 2031
2.2.2 Laboratory Fully Automated Filtration Technology Historic Market Size by Region (2020-2025)
2.2.3 Laboratory Fully Automated Filtration Technology Forecasted Market Size by Region (2026-2031)
2.3 Laboratory Fully Automated Filtration Technology Market Dynamics
2.3.1 Laboratory Fully Automated Filtration Technology Industry Trends
2.3.2 Laboratory Fully Automated Filtration Technology Market Drivers
2.3.3 Laboratory Fully Automated Filtration Technology Market Challenges
2.3.4 Laboratory Fully Automated Filtration Technology Market Restraints
3 Competition Landscape by Key Players
3.1 Global Top Laboratory Fully Automated Filtration Technology Players by Revenue
3.1.1 Global Top Laboratory Fully Automated Filtration Technology Players by Revenue (2020-2025)
3.1.2 Global Laboratory Fully Automated Filtration Technology Revenue Market Share by Players (2020-2025)
3.2 Global Top Laboratory Fully Automated Filtration Technology Players by Company Type and Market Share by Company Type (Tier 1, Tier 2, and Tier 3)
3.3 Global Key Players Ranking by Laboratory Fully Automated Filtration Technology Revenue
3.4 Global Laboratory Fully Automated Filtration Technology Market Concentration Ratio
3.4.1 Global Laboratory Fully Automated Filtration Technology Market Concentration Ratio (CR5 and HHI)
3.4.2 Global Top 10 and Top 5 Companies by Laboratory Fully Automated Filtration Technology Revenue in 2024
3.5 Global Key Players of Laboratory Fully Automated Filtration Technology Head office and Area Served
3.6 Global Key Players of Laboratory Fully Automated Filtration Technology, Product and Application
3.7 Global Key Players of Laboratory Fully Automated Filtration Technology, Date of Enter into This Industry
3.8 Mergers & Acquisitions, Expansion Plans
4 Laboratory Fully Automated Filtration Technology Breakdown Data by Type
4.1 Global Laboratory Fully Automated Filtration Technology Historic Market Size by Type (2020-2025)
4.2 Global Laboratory Fully Automated Filtration Technology Forecasted Market Size by Type (2026-2031)
5 Laboratory Fully Automated Filtration Technology Breakdown Data by Application
5.1 Global Laboratory Fully Automated Filtration Technology Historic Market Size by Application (2020-2025)
5.2 Global Laboratory Fully Automated Filtration Technology Forecasted Market Size by Application (2026-2031)
6 North America
6.1 North America Laboratory Fully Automated Filtration Technology Market Size (2020-2031)
6.2 North America Laboratory Fully Automated Filtration Technology Market Growth Rate by Country: 2020 VS 2024 VS 2031
6.3 North America Laboratory Fully Automated Filtration Technology Market Size by Country (2020-2025)
6.4 North America Laboratory Fully Automated Filtration Technology Market Size by Country (2026-2031)
6.5 United States
6.6 Canada
7 Europe
7.1 Europe Laboratory Fully Automated Filtration Technology Market Size (2020-2031)
7.2 Europe Laboratory Fully Automated Filtration Technology Market Growth Rate by Country: 2020 VS 2024 VS 2031
7.3 Europe Laboratory Fully Automated Filtration Technology Market Size by Country (2020-2025)
7.4 Europe Laboratory Fully Automated Filtration Technology Market Size by Country (2026-2031)
7.5 Germany
7.6 France
7.7 U.K.
7.8 Italy
7.9 Russia
7.10 Ireland
8 Asia-Pacific
8.1 Asia-Pacific Laboratory Fully Automated Filtration Technology Market Size (2020-2031)
8.2 Asia-Pacific Laboratory Fully Automated Filtration Technology Market Growth Rate by Region: 2020 VS 2024 VS 2031
8.3 Asia-Pacific Laboratory Fully Automated Filtration Technology Market Size by Region (2020-2025)
8.4 Asia-Pacific Laboratory Fully Automated Filtration Technology Market Size by Region (2026-2031)
8.5 China
8.6 Japan
8.7 South Korea
8.8 Southeast Asia
8.9 India
8.10 Australia & New Zealand
9 Latin America
9.1 Latin America Laboratory Fully Automated Filtration Technology Market Size (2020-2031)
9.2 Latin America Laboratory Fully Automated Filtration Technology Market Growth Rate by Country: 2020 VS 2024 VS 2031
9.3 Latin America Laboratory Fully Automated Filtration Technology Market Size by Country (2020-2025)
9.4 Latin America Laboratory Fully Automated Filtration Technology Market Size by Country (2026-2031)
9.5 Mexico
9.6 Brazil
10 Middle East & Africa
10.1 Middle East & Africa Laboratory Fully Automated Filtration Technology Market Size (2020-2031)
10.2 Middle East & Africa Laboratory Fully Automated Filtration Technology Market Growth Rate by Country: 2020 VS 2024 VS 2031
10.3 Middle East & Africa Laboratory Fully Automated Filtration Technology Market Size by Country (2020-2025)
10.4 Middle East & Africa Laboratory Fully Automated Filtration Technology Market Size by Country (2026-2031)
10.5 Israel
10.6 Saudi Arabia
10.7 UAE
11 Key Players Profiles
11.1 Merck Millipore
11.1.1 Merck Millipore Company Details
11.1.2 Merck Millipore Business Overview
11.1.3 Merck Millipore Laboratory Fully Automated Filtration Technology Introduction
11.1.4 Merck Millipore Revenue in Laboratory Fully Automated Filtration Technology Business (2020-2025)
11.1.5 Merck Millipore Recent Development
11.2 Pall Corporation
11.2.1 Pall Corporation Company Details
11.2.2 Pall Corporation Business Overview
11.2.3 Pall Corporation Laboratory Fully Automated Filtration Technology Introduction
11.2.4 Pall Corporation Revenue in Laboratory Fully Automated Filtration Technology Business (2020-2025)
11.2.5 Pall Corporation Recent Development
11.3 Sartorius Group
11.3.1 Sartorius Group Company Details
11.3.2 Sartorius Group Business Overview
11.3.3 Sartorius Group Laboratory Fully Automated Filtration Technology Introduction
11.3.4 Sartorius Group Revenue in Laboratory Fully Automated Filtration Technology Business (2020-2025)
11.3.5 Sartorius Group Recent Development
11.4 3M Company
11.4.1 3M Company Company Details
11.4.2 3M Company Business Overview
11.4.3 3M Company Laboratory Fully Automated Filtration Technology Introduction
11.4.4 3M Company Revenue in Laboratory Fully Automated Filtration Technology Business (2020-2025)
11.4.5 3M Company Recent Development
11.5 GE Healthcare
11.5.1 GE Healthcare Company Details
11.5.2 GE Healthcare Business Overview
11.5.3 GE Healthcare Laboratory Fully Automated Filtration Technology Introduction
11.5.4 GE Healthcare Revenue in Laboratory Fully Automated Filtration Technology Business (2020-2025)
11.5.5 GE Healthcare Recent Development
11.6 Cantel Medical
11.6.1 Cantel Medical Company Details
11.6.2 Cantel Medical Business Overview
11.6.3 Cantel Medical Laboratory Fully Automated Filtration Technology Introduction
11.6.4 Cantel Medical Revenue in Laboratory Fully Automated Filtration Technology Business (2020-2025)
11.6.5 Cantel Medical Recent Development
11.7 Thermo Fisher Scientific
11.7.1 Thermo Fisher Scientific Company Details
11.7.2 Thermo Fisher Scientific Business Overview
11.7.3 Thermo Fisher Scientific Laboratory Fully Automated Filtration Technology Introduction
11.7.4 Thermo Fisher Scientific Revenue in Laboratory Fully Automated Filtration Technology Business (2020-2025)
11.7.5 Thermo Fisher Scientific Recent Development
11.8 Sigma-Aldrich
11.8.1 Sigma-Aldrich Company Details
11.8.2 Sigma-Aldrich Business Overview
11.8.3 Sigma-Aldrich Laboratory Fully Automated Filtration Technology Introduction
11.8.4 Sigma-Aldrich Revenue in Laboratory Fully Automated Filtration Technology Business (2020-2025)
11.8.5 Sigma-Aldrich Recent Development
11.9 Veolia Water Technologies
11.9.1 Veolia Water Technologies Company Details
11.9.2 Veolia Water Technologies Business Overview
11.9.3 Veolia Water Technologies Laboratory Fully Automated Filtration Technology Introduction
11.9.4 Veolia Water Technologies Revenue in Laboratory Fully Automated Filtration Technology Business (2020-2025)
11.9.5 Veolia Water Technologies Recent Development
11.10 Macherey–Nagel
11.10.1 Macherey–Nagel Company Details
11.10.2 Macherey–Nagel Business Overview
11.10.3 Macherey–Nagel Laboratory Fully Automated Filtration Technology Introduction
11.10.4 Macherey–Nagel Revenue in Laboratory Fully Automated Filtration Technology Business (2020-2025)
11.10.5 Macherey–Nagel Recent Development
11.11 Ahlstrom
11.11.1 Ahlstrom Company Details
11.11.2 Ahlstrom Business Overview
11.11.3 Ahlstrom Laboratory Fully Automated Filtration Technology Introduction
11.11.4 Ahlstrom Revenue in Laboratory Fully Automated Filtration Technology Business (2020-2025)
11.11.5 Ahlstrom Recent Development
11.12 Sartorius
11.12.1 Sartorius Company Details
11.12.2 Sartorius Business Overview
11.12.3 Sartorius Laboratory Fully Automated Filtration Technology Introduction
11.12.4 Sartorius Revenue in Laboratory Fully Automated Filtration Technology Business (2020-2025)
11.12.5 Sartorius Recent Development
11.13 Coleparmer
11.13.1 Coleparmer Company Details
11.13.2 Coleparmer Business Overview
11.13.3 Coleparmer Laboratory Fully Automated Filtration Technology Introduction
11.13.4 Coleparmer Revenue in Laboratory Fully Automated Filtration Technology Business (2020-2025)
11.13.5 Coleparmer Recent Development
11.14 Membrane Solutions
11.14.1 Membrane Solutions Company Details
11.14.2 Membrane Solutions Business Overview
11.14.3 Membrane Solutions Laboratory Fully Automated Filtration Technology Introduction
11.14.4 Membrane Solutions Revenue in Laboratory Fully Automated Filtration Technology Business (2020-2025)
11.14.5 Membrane Solutions Recent Development
11.15 Rocker Scientific
11.15.1 Rocker Scientific Company Details
11.15.2 Rocker Scientific Business Overview
11.15.3 Rocker Scientific Laboratory Fully Automated Filtration Technology Introduction
11.15.4 Rocker Scientific Revenue in Laboratory Fully Automated Filtration Technology Business (2020-2025)
11.15.5 Rocker Scientific Recent Development
12 Analyst's Viewpoints/Conclusions
13 Appendix
13.1 Research Methodology
13.1.1 Methodology/Research Approach
13.1.1.1 Research Programs/Design
13.1.1.2 Market Size Estimation
13.1.1.3 Market Breakdown and Data Triangulation
13.1.2 Data Source
13.1.2.1 Secondary Sources
13.1.2.2 Primary Sources
13.2 Author Details
13.3 Disclaimer
List of Tables
 Table 1. Global Laboratory Fully Automated Filtration Technology Market Size Growth Rate by Type (US$ Million): 2020 VS 2024 VS 2031
 Table 2. Key Players of Microfiltration Technology
 Table 3. Key Players of Reverse Osmosis Technology
 Table 4. Key Players of Ultrafiltration Technology
 Table 5. Key Players of Vacuum Filtration Technology
 Table 6. Key Players of Nanofiltration Technology
 Table 7. Global Laboratory Fully Automated Filtration Technology Market Size Growth Rate by Automation Level (US$ Million): 2020 VS 2024 VS 2031
 Table 8. Key Players of Fully Automated Filtration System
 Table 9. Key Players of Programmable Filtration Unit
 Table 10. Key Players of Robotic Integrated Filtration Platform
 Table 11. Global Laboratory Fully Automated Filtration Technology Market Size Growth by Application (US$ Million): 2020 VS 2024 VS 2031
 Table 12. Global Laboratory Fully Automated Filtration Technology Market Size by Region (US$ Million): 2020 VS 2024 VS 2031
 Table 13. Global Laboratory Fully Automated Filtration Technology Market Size by Region (2020-2025) & (US$ Million)
 Table 14. Global Laboratory Fully Automated Filtration Technology Market Share by Region (2020-2025)
 Table 15. Global Laboratory Fully Automated Filtration Technology Forecasted Market Size by Region (2026-2031) & (US$ Million)
 Table 16. Global Laboratory Fully Automated Filtration Technology Market Share by Region (2026-2031)
 Table 17. Laboratory Fully Automated Filtration Technology Market Trends
 Table 18. Laboratory Fully Automated Filtration Technology Market Drivers
 Table 19. Laboratory Fully Automated Filtration Technology Market Challenges
 Table 20. Laboratory Fully Automated Filtration Technology Market Restraints
 Table 21. Global Laboratory Fully Automated Filtration Technology Revenue by Players (2020-2025) & (US$ Million)
 Table 22. Global Laboratory Fully Automated Filtration Technology Market Share by Players (2020-2025)
 Table 23. Global Top Laboratory Fully Automated Filtration Technology Players by Company Type (Tier 1, Tier 2, and Tier 3) & (based on the Revenue in Laboratory Fully Automated Filtration Technology as of 2024)
 Table 24. Ranking of Global Top Laboratory Fully Automated Filtration Technology Companies by Revenue (US$ Million) in 2024
 Table 25. Global 5 Largest Players Market Share by Laboratory Fully Automated Filtration Technology Revenue (CR5 and HHI) & (2020-2025)
 Table 26. Global Key Players of Laboratory Fully Automated Filtration Technology, Headquarters and Area Served
 Table 27. Global Key Players of Laboratory Fully Automated Filtration Technology, Product and Application
 Table 28. Global Key Players of Laboratory Fully Automated Filtration Technology, Date of Enter into This Industry
 Table 29. Mergers & Acquisitions, Expansion Plans
 Table 30. Global Laboratory Fully Automated Filtration Technology Market Size by Type (2020-2025) & (US$ Million)
 Table 31. Global Laboratory Fully Automated Filtration Technology Revenue Market Share by Type (2020-2025)
 Table 32. Global Laboratory Fully Automated Filtration Technology Forecasted Market Size by Type (2026-2031) & (US$ Million)
 Table 33. Global Laboratory Fully Automated Filtration Technology Revenue Market Share by Type (2026-2031)
 Table 34. Global Laboratory Fully Automated Filtration Technology Market Size by Application (2020-2025) & (US$ Million)
 Table 35. Global Laboratory Fully Automated Filtration Technology Revenue Market Share by Application (2020-2025)
 Table 36. Global Laboratory Fully Automated Filtration Technology Forecasted Market Size by Application (2026-2031) & (US$ Million)
 Table 37. Global Laboratory Fully Automated Filtration Technology Revenue Market Share by Application (2026-2031)
 Table 38. North America Laboratory Fully Automated Filtration Technology Market Size Growth Rate by Country (US$ Million): 2020 VS 2024 VS 2031
 Table 39. North America Laboratory Fully Automated Filtration Technology Market Size by Country (2020-2025) & (US$ Million)
 Table 40. North America Laboratory Fully Automated Filtration Technology Market Size by Country (2026-2031) & (US$ Million)
 Table 41. Europe Laboratory Fully Automated Filtration Technology Market Size Growth Rate by Country (US$ Million): 2020 VS 2024 VS 2031
 Table 42. Europe Laboratory Fully Automated Filtration Technology Market Size by Country (2020-2025) & (US$ Million)
 Table 43. Europe Laboratory Fully Automated Filtration Technology Market Size by Country (2026-2031) & (US$ Million)
 Table 44. Asia-Pacific Laboratory Fully Automated Filtration Technology Market Size Growth Rate by Region (US$ Million): 2020 VS 2024 VS 2031
 Table 45. Asia-Pacific Laboratory Fully Automated Filtration Technology Market Size by Region (2020-2025) & (US$ Million)
 Table 46. Asia-Pacific Laboratory Fully Automated Filtration Technology Market Size by Region (2026-2031) & (US$ Million)
 Table 47. Latin America Laboratory Fully Automated Filtration Technology Market Size Growth Rate by Country (US$ Million): 2020 VS 2024 VS 2031
 Table 48. Latin America Laboratory Fully Automated Filtration Technology Market Size by Country (2020-2025) & (US$ Million)
 Table 49. Latin America Laboratory Fully Automated Filtration Technology Market Size by Country (2026-2031) & (US$ Million)
 Table 50. Middle East & Africa Laboratory Fully Automated Filtration Technology Market Size Growth Rate by Country (US$ Million): 2020 VS 2024 VS 2031
 Table 51. Middle East & Africa Laboratory Fully Automated Filtration Technology Market Size by Country (2020-2025) & (US$ Million)
 Table 52. Middle East & Africa Laboratory Fully Automated Filtration Technology Market Size by Country (2026-2031) & (US$ Million)
 Table 53. Merck Millipore Company Details
 Table 54. Merck Millipore Business Overview
 Table 55. Merck Millipore Laboratory Fully Automated Filtration Technology Product
 Table 56. Merck Millipore Revenue in Laboratory Fully Automated Filtration Technology Business (2020-2025) & (US$ Million)
 Table 57. Merck Millipore Recent Development
 Table 58. Pall Corporation Company Details
 Table 59. Pall Corporation Business Overview
 Table 60. Pall Corporation Laboratory Fully Automated Filtration Technology Product
 Table 61. Pall Corporation Revenue in Laboratory Fully Automated Filtration Technology Business (2020-2025) & (US$ Million)
 Table 62. Pall Corporation Recent Development
 Table 63. Sartorius Group Company Details
 Table 64. Sartorius Group Business Overview
 Table 65. Sartorius Group Laboratory Fully Automated Filtration Technology Product
 Table 66. Sartorius Group Revenue in Laboratory Fully Automated Filtration Technology Business (2020-2025) & (US$ Million)
 Table 67. Sartorius Group Recent Development
 Table 68. 3M Company Company Details
 Table 69. 3M Company Business Overview
 Table 70. 3M Company Laboratory Fully Automated Filtration Technology Product
 Table 71. 3M Company Revenue in Laboratory Fully Automated Filtration Technology Business (2020-2025) & (US$ Million)
 Table 72. 3M Company Recent Development
 Table 73. GE Healthcare Company Details
 Table 74. GE Healthcare Business Overview
 Table 75. GE Healthcare Laboratory Fully Automated Filtration Technology Product
 Table 76. GE Healthcare Revenue in Laboratory Fully Automated Filtration Technology Business (2020-2025) & (US$ Million)
 Table 77. GE Healthcare Recent Development
 Table 78. Cantel Medical Company Details
 Table 79. Cantel Medical Business Overview
 Table 80. Cantel Medical Laboratory Fully Automated Filtration Technology Product
 Table 81. Cantel Medical Revenue in Laboratory Fully Automated Filtration Technology Business (2020-2025) & (US$ Million)
 Table 82. Cantel Medical Recent Development
 Table 83. Thermo Fisher Scientific Company Details
 Table 84. Thermo Fisher Scientific Business Overview
 Table 85. Thermo Fisher Scientific Laboratory Fully Automated Filtration Technology Product
 Table 86. Thermo Fisher Scientific Revenue in Laboratory Fully Automated Filtration Technology Business (2020-2025) & (US$ Million)
 Table 87. Thermo Fisher Scientific Recent Development
 Table 88. Sigma-Aldrich Company Details
 Table 89. Sigma-Aldrich Business Overview
 Table 90. Sigma-Aldrich Laboratory Fully Automated Filtration Technology Product
 Table 91. Sigma-Aldrich Revenue in Laboratory Fully Automated Filtration Technology Business (2020-2025) & (US$ Million)
 Table 92. Sigma-Aldrich Recent Development
 Table 93. Veolia Water Technologies Company Details
 Table 94. Veolia Water Technologies Business Overview
 Table 95. Veolia Water Technologies Laboratory Fully Automated Filtration Technology Product
 Table 96. Veolia Water Technologies Revenue in Laboratory Fully Automated Filtration Technology Business (2020-2025) & (US$ Million)
 Table 97. Veolia Water Technologies Recent Development
 Table 98. Macherey–Nagel Company Details
 Table 99. Macherey–Nagel Business Overview
 Table 100. Macherey–Nagel Laboratory Fully Automated Filtration Technology Product
 Table 101. Macherey–Nagel Revenue in Laboratory Fully Automated Filtration Technology Business (2020-2025) & (US$ Million)
 Table 102. Macherey–Nagel Recent Development
 Table 103. Ahlstrom Company Details
 Table 104. Ahlstrom Business Overview
 Table 105. Ahlstrom Laboratory Fully Automated Filtration Technology Product
 Table 106. Ahlstrom Revenue in Laboratory Fully Automated Filtration Technology Business (2020-2025) & (US$ Million)
 Table 107. Ahlstrom Recent Development
 Table 108. Sartorius Company Details
 Table 109. Sartorius Business Overview
 Table 110. Sartorius Laboratory Fully Automated Filtration Technology Product
 Table 111. Sartorius Revenue in Laboratory Fully Automated Filtration Technology Business (2020-2025) & (US$ Million)
 Table 112. Sartorius Recent Development
 Table 113. Coleparmer Company Details
 Table 114. Coleparmer Business Overview
 Table 115. Coleparmer Laboratory Fully Automated Filtration Technology Product
 Table 116. Coleparmer Revenue in Laboratory Fully Automated Filtration Technology Business (2020-2025) & (US$ Million)
 Table 117. Coleparmer Recent Development
 Table 118. Membrane Solutions Company Details
 Table 119. Membrane Solutions Business Overview
 Table 120. Membrane Solutions Laboratory Fully Automated Filtration Technology Product
 Table 121. Membrane Solutions Revenue in Laboratory Fully Automated Filtration Technology Business (2020-2025) & (US$ Million)
 Table 122. Membrane Solutions Recent Development
 Table 123. Rocker Scientific Company Details
 Table 124. Rocker Scientific Business Overview
 Table 125. Rocker Scientific Laboratory Fully Automated Filtration Technology Product
 Table 126. Rocker Scientific Revenue in Laboratory Fully Automated Filtration Technology Business (2020-2025) & (US$ Million)
 Table 127. Rocker Scientific Recent Development
 Table 128. Research Programs/Design for This Report
 Table 129. Key Data Information from Secondary Sources
 Table 130. Key Data Information from Primary Sources
 Table 131. Authors List of This Report


List of Figures
 Figure 1. Laboratory Fully Automated Filtration Technology Picture
 Figure 2. Global Laboratory Fully Automated Filtration Technology Market Size Comparison by Type (2020-2031) & (US$ Million)
 Figure 3. Global Laboratory Fully Automated Filtration Technology Market Share by Type: 2024 VS 2031
 Figure 4. Microfiltration Technology Features
 Figure 5. Reverse Osmosis Technology Features
 Figure 6. Ultrafiltration Technology Features
 Figure 7. Vacuum Filtration Technology Features
 Figure 8. Nanofiltration Technology Features
 Figure 9. Global Laboratory Fully Automated Filtration Technology Market Size Comparison by Automation Level (2020-2031) & (US$ Million)
 Figure 10. Fully Automated Filtration System Features
 Figure 11. Programmable Filtration Unit Features
 Figure 12. Robotic Integrated Filtration Platform Features
 Figure 13. Global Laboratory Fully Automated Filtration Technology Market Size by Application (2020-2031) & (US$ Million)
 Figure 14. Global Laboratory Fully Automated Filtration Technology Market Share by Application: 2024 VS 2031
 Figure 15. Pharmaceutical & Biopharmaceutical Companies Case Studies
 Figure 16. Academic & Research Institutes Case Studies
 Figure 17. Food & Beverage Companies Case Studies
 Figure 18. Hospital & Diagnostic Laboratories Case Studies
 Figure 19. Laboratory Fully Automated Filtration Technology Report Years Considered
 Figure 20. Global Laboratory Fully Automated Filtration Technology Market Size (US$ Million), Year-over-Year: 2020-2031
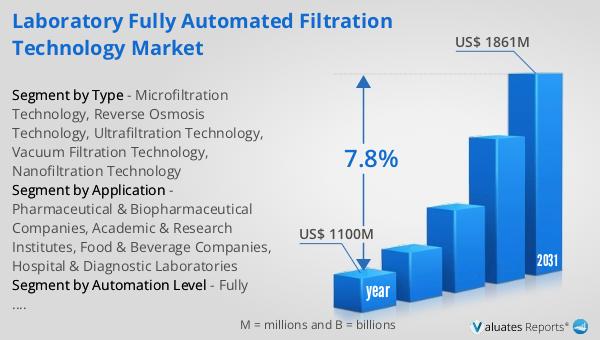
 Figure 21. Global Laboratory Fully Automated Filtration Technology Market Size, (US$ Million), 2020 VS 2024 VS 2031
 Figure 22. Global Laboratory Fully Automated Filtration Technology Market Share by Region: 2024 VS 2031
 Figure 23. Global Laboratory Fully Automated Filtration Technology Market Share by Players in 2024
 Figure 24. Global Laboratory Fully Automated Filtration Technology Market Share by Company Type (Tier 1, Tier 2, and Tier 3)
 Figure 25. The Top 10 and 5 Players Market Share by Laboratory Fully Automated Filtration Technology Revenue in 2024
 Figure 26. North America Laboratory Fully Automated Filtration Technology Market Size YoY Growth (2020-2031) & (US$ Million)
 Figure 27. North America Laboratory Fully Automated Filtration Technology Market Share by Country (2020-2031)
 Figure 28. United States Laboratory Fully Automated Filtration Technology Market Size YoY Growth (2020-2031) & (US$ Million)
 Figure 29. Canada Laboratory Fully Automated Filtration Technology Market Size YoY Growth (2020-2031) & (US$ Million)
 Figure 30. Europe Laboratory Fully Automated Filtration Technology Market Size YoY Growth (2020-2031) & (US$ Million)
 Figure 31. Europe Laboratory Fully Automated Filtration Technology Market Share by Country (2020-2031)
 Figure 32. Germany Laboratory Fully Automated Filtration Technology Market Size YoY Growth (2020-2031) & (US$ Million)
 Figure 33. France Laboratory Fully Automated Filtration Technology Market Size YoY Growth (2020-2031) & (US$ Million)
 Figure 34. U.K. Laboratory Fully Automated Filtration Technology Market Size YoY Growth (2020-2031) & (US$ Million)
 Figure 35. Italy Laboratory Fully Automated Filtration Technology Market Size YoY Growth (2020-2031) & (US$ Million)
 Figure 36. Russia Laboratory Fully Automated Filtration Technology Market Size YoY Growth (2020-2031) & (US$ Million)
 Figure 37. Ireland Laboratory Fully Automated Filtration Technology Market Size YoY Growth (2020-2031) & (US$ Million)
 Figure 38. Asia-Pacific Laboratory Fully Automated Filtration Technology Market Size YoY Growth (2020-2031) & (US$ Million)
 Figure 39. Asia-Pacific Laboratory Fully Automated Filtration Technology Market Share by Region (2020-2031)
 Figure 40. China Laboratory Fully Automated Filtration Technology Market Size YoY Growth (2020-2031) & (US$ Million)
 Figure 41. Japan Laboratory Fully Automated Filtration Technology Market Size YoY Growth (2020-2031) & (US$ Million)
 Figure 42. South Korea Laboratory Fully Automated Filtration Technology Market Size YoY Growth (2020-2031) & (US$ Million)
 Figure 43. Southeast Asia Laboratory Fully Automated Filtration Technology Market Size YoY Growth (2020-2031) & (US$ Million)
 Figure 44. India Laboratory Fully Automated Filtration Technology Market Size YoY Growth (2020-2031) & (US$ Million)
 Figure 45. Australia & New Zealand Laboratory Fully Automated Filtration Technology Market Size YoY Growth (2020-2031) & (US$ Million)
 Figure 46. Latin America Laboratory Fully Automated Filtration Technology Market Size YoY Growth (2020-2031) & (US$ Million)
 Figure 47. Latin America Laboratory Fully Automated Filtration Technology Market Share by Country (2020-2031)
 Figure 48. Mexico Laboratory Fully Automated Filtration Technology Market Size YoY Growth (2020-2031) & (US$ Million)
 Figure 49. Brazil Laboratory Fully Automated Filtration Technology Market Size YoY Growth (2020-2031) & (US$ Million)
 Figure 50. Middle East & Africa Laboratory Fully Automated Filtration Technology Market Size YoY Growth (2020-2031) & (US$ Million)
 Figure 51. Middle East & Africa Laboratory Fully Automated Filtration Technology Market Share by Country (2020-2031)
 Figure 52. Israel Laboratory Fully Automated Filtration Technology Market Size YoY Growth (2020-2031) & (US$ Million)
 Figure 53. Saudi Arabia Laboratory Fully Automated Filtration Technology Market Size YoY Growth (2020-2031) & (US$ Million)
 Figure 54. UAE Laboratory Fully Automated Filtration Technology Market Size YoY Growth (2020-2031) & (US$ Million)
 Figure 55. Merck Millipore Revenue Growth Rate in Laboratory Fully Automated Filtration Technology Business (2020-2025)
 Figure 56. Pall Corporation Revenue Growth Rate in Laboratory Fully Automated Filtration Technology Business (2020-2025)
 Figure 57. Sartorius Group Revenue Growth Rate in Laboratory Fully Automated Filtration Technology Business (2020-2025)
 Figure 58. 3M Company Revenue Growth Rate in Laboratory Fully Automated Filtration Technology Business (2020-2025)
 Figure 59. GE Healthcare Revenue Growth Rate in Laboratory Fully Automated Filtration Technology Business (2020-2025)
 Figure 60. Cantel Medical Revenue Growth Rate in Laboratory Fully Automated Filtration Technology Business (2020-2025)
 Figure 61. Thermo Fisher Scientific Revenue Growth Rate in Laboratory Fully Automated Filtration Technology Business (2020-2025)
 Figure 62. Sigma-Aldrich Revenue Growth Rate in Laboratory Fully Automated Filtration Technology Business (2020-2025)
 Figure 63. Veolia Water Technologies Revenue Growth Rate in Laboratory Fully Automated Filtration Technology Business (2020-2025)
 Figure 64. Macherey–Nagel Revenue Growth Rate in Laboratory Fully Automated Filtration Technology Business (2020-2025)
 Figure 65. Ahlstrom Revenue Growth Rate in Laboratory Fully Automated Filtration Technology Business (2020-2025)
 Figure 66. Sartorius Revenue Growth Rate in Laboratory Fully Automated Filtration Technology Business (2020-2025)
 Figure 67. Coleparmer Revenue Growth Rate in Laboratory Fully Automated Filtration Technology Business (2020-2025)
 Figure 68. Membrane Solutions Revenue Growth Rate in Laboratory Fully Automated Filtration Technology Business (2020-2025)
 Figure 69. Rocker Scientific Revenue Growth Rate in Laboratory Fully Automated Filtration Technology Business (2020-2025)
 Figure 70. Bottom-up and Top-down Approaches for This Report
 Figure 71. Data Triangulation
 Figure 72. Key Executives Interviewed
SELECT A FORMAT
Added to Cart
Electronic (PDF)

$2900

This license allows only one user to access the PDF.
Electronic (PDF)

$4350

This license allows 1 - 5 user to access the PDF, license is suitable for small groups of 5 users working together
Electronic (PDF)

$5800

This license allows users/teams in a same Enterprise to use this report, various departments within an enterpise can use this report
Add to Cart
Buy Now (15% Discount)

OUR CUSTOMER

Nano Dimension

SIMILAR REPORTS


RELATED REPORTS

Global Aquafeed Enzyme Market Research Report 2025

120 Pages
Type: Report
Code: QYRE-Auto-8Y18437
Thu Nov 27 00:00:00 UTC 2025

Add to Cart

Global Strong Cation Exchange Agarose Gel Market Research Report 2025

120 Pages
Type: Report
Code: QYRE-Auto-7C20305
Thu Nov 27 00:00:00 UTC 2025

Add to Cart

Global Deoxyadenosine Triphosphate Solution Market Research Report 2025

120 Pages
Type: Report
Code: QYRE-Auto-13N20234
Thu Nov 27 00:00:00 UTC 2025

Add to Cart

Global Artificial Intelligence Gait Monitoring System Market Research Report 2025

120 Pages
Type: Report
Code: QYRE-Auto-22E19966
Thu Nov 27 00:00:00 UTC 2025

Add to Cart