FEATURED COMPANIES
VTI
Kistler
Zeiss
Seichter
CFM Schiller
Hofmann
DUFOURNIER
Link Engineering
KOKUSAI.
Tire Test System Market Size
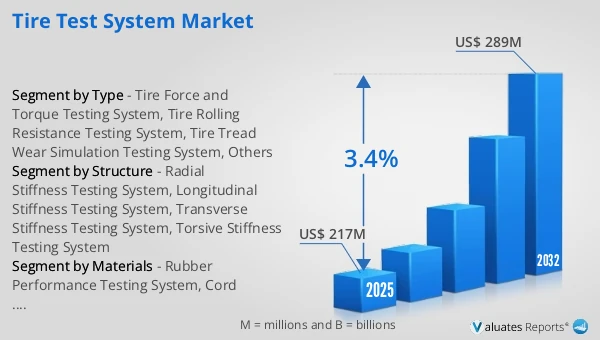
The global Tire Test System market was valued at US$ 217 million in 2025 and is anticipated to reach US$ 289 million by 2032, at a CAGR of 3.4% from 2026 to 2032.
Tire Test System Market
The 2025 U.S. tariff policies introduce profound uncertainty into the global economic landscape. This report critically examines the implications of recent tariff adjustments and international strategic countermeasures on Tire Test System competitive dynamics, regional economic interdependencies, and supply chain reconfigurations.
In 2025, the global production of tire testing systems reached 17,380 units, with an average selling price of US$12,500 per unit. The global annual production capacity of tire testing systems is approximately 25,000 units, with a gross profit margin of approximately 27.2%. A tire testing system is a comprehensive system of equipment and software used to evaluate tire performance, durability, and safety. It typically includes mechanical structure, sensing and control hardware, and software for data acquisition, analysis, and reporting. By conducting multi-dimensional tests on tires at different stages in laboratories, proving grounds, or production lines, the system can measure and analyze indicators such as temperature, wet grip, wear, rolling resistance, traction, noise, vibration, load-deformation response, and performance under extreme conditions. The upstream of the tire testing system industry chain includes semiconductors and sensor components, precision electromechanical and actuators, and software and data analysis platforms; the midstream consists of tire testing system manufacturers; and the downstream mainly comprises industries such as automotive, aerospace, and railway.
The tire testing system market is currently in a phase of rapid development, covering the entire lifecycle from laboratory R&D to production line quality control. Core drivers include the stringent testing requirements for tire performance and durability, increasingly stringent regulations and standards, and the widespread adoption of automated and data-driven testing methods, such as high-precision and high-repeatability requirements for multi-dimensional evaluations of temperature, wet grip, wear, noise, and rolling resistance. The market landscape is gradually shifting towards integrated solutions, with manufacturers emphasizing hardware and software integration, automated testing processes, and data-driven predictive analytics and lifespan assessments to improve testing efficiency, reduce costs, and shorten time-to-market for new products, while simultaneously seeking a balance between customization and cross-model compatibility.
This report delivers a comprehensive overview of the global Tire Test System market, with both quantitative and qualitative analyses, to help readers develop growth strategies, assess the competitive landscape, evaluate their position in the current market, and make informed business decisions regarding Tire Test System. The Tire Test System market size, estimates, and forecasts are provided in terms of output/shipments (K Units) and revenue (US$ millions), with 2025 as the base year and historical and forecast data for 2021–2032.
The report segments the global Tire Test System market comprehensively. Regional market sizes by Type, by Application, by Structure, and by company are also provided. For deeper insight, the report profiles the competitive landscape, key competitors, and their respective market rankings, and discusses technological trends and new product developments.
This report will assist Tire Test System manufacturers, new entrants, and companies across the industry value chain with information on revenues, production, and average prices for the overall market and its sub-segments, by company, by Type, by Application, and by region.
Market Segmentation
Scope of Tire Test System Market Report
| Report Metric |
Details |
| Report Name |
Tire Test System Market |
| Accounted market size in 2025 |
US$ 217 million |
| Forecasted market size in 2032 |
US$ 289 million |
| CAGR |
3.4% |
| Base Year |
2025 |
| Forecasted years |
2026 - 2032 |
| Segment by Type |
- Tire Force and Torque Testing System
- Tire Rolling Resistance Testing System
- Tire Tread Wear Simulation Testing System
- Others
|
| Segment by Structure |
- Radial Stiffness Testing System
- Longitudinal Stiffness Testing System
- Transverse Stiffness Testing System
- Torsive Stiffness Testing System
|
| Segment by Materials |
- Rubber Performance Testing System
- Cord Performance Testing System
- Material Aging Testing System
|
| by Application |
- Automotive
- Aerospace
- Railway
- Others
|
| Production by Region |
- North America
- Europe
- China
- Japan
|
| Consumption by Region |
- North America (United States, Canada)
- Europe (Germany, France, UK, Italy, Russia)
- Asia-Pacific (China, Japan, South Korea, Taiwan)
- Southeast Asia (India)
- Latin America (Mexico, Brazil)
|
| By Company |
MTS Systems, Micro-Poise, TMSI, Ono Sokki, VTI, Kistler, Zeiss, Seichter, CFM Schiller, Hofmann, DUFOURNIER, Link Engineering, Kokusai, Shantou Haoda Tires Testing Equipment |
| Forecast units |
USD million in value |
| Report coverage |
Revenue and volume forecast, company share, competitive landscape, growth factors and trends |
Chapter Outline
- Chapter 1: Defines the scope of the report and presents an executive summary of market segments (by Type, by Application, by Structure, etc.), including the size of each segment and its future growth potential. It offers a high-level view of the current market and its likely evolution in the short, medium, and long term.
- Chapter 2: Provides a detailed analysis of the competitive landscape for Tire Test System manufacturers, including prices, production, value-based market shares, latest development plans, and information on mergers and acquisitions.
- Chapter 3: Examines Tire Test System production/output and value by region and country, providing a quantitative assessment of market size and growth potential for each region over the next six years.
- Chapter 4: Analyzes Tire Test System consumption at the regional and country levels. It quantifies market size and growth potential for each region and its key countries, and outlines market development, outlook, addressable space, and national production.
- Chapter 5: Analyzes market segments by Type, covering the size and growth potential of each segment to help readers identify “blue ocean” opportunities.
- Chapter 6: Analyzes market segments by Application, covering the size and growth potential of each segment to help readers identify “blue ocean” opportunities in downstream markets.
- Chapter 7: Profiles key players, detailing the fundamentals of major companies, including product production/output, value, price, gross margin, product portfolio/introductions, and recent developments.
- Chapter 8: Reviews the industry value chain, including upstream and downstream segments.
- Chapter 9: Discusses market dynamics and recent developments, including drivers, restraints, challenges and risks for manufacturers, U.S. Tariffs and relevant policy analysis.
- Chapter 10: Summarizes the key findings and conclusions of the report.
FAQ for this report
How fast is Tire Test System Market growing?
Ans: The Tire Test System Market witnessing a CAGR of 3.4% during the forecast period 2026-2032.
What is the Tire Test System Market size in 2032?
Ans: The Tire Test System Market size in 2032 will be US$ 289 million.
Who are the main players in the Tire Test System Market report?
Ans: The main players in the Tire Test System Market are MTS Systems, Micro-Poise, TMSI, Ono Sokki, VTI, Kistler, Zeiss, Seichter, CFM Schiller, Hofmann, DUFOURNIER, Link Engineering, Kokusai, Shantou Haoda Tires Testing Equipment
What are the Application segmentation covered in the Tire Test System Market report?
Ans: The Applications covered in the Tire Test System Market report are Automotive, Aerospace, Railway, Others
What are the Type segmentation covered in the Tire Test System Market report?
Ans: The Types covered in the Tire Test System Market report are Tire Force and Torque Testing System, Tire Rolling Resistance Testing System, Tire Tread Wear Simulation Testing System, Others

