
The global Carbon Capture and Storage market size is projected to reach US$ 5951.3 million by 2028, from US$ 3939 million in 2021, at a CAGR of 6.0% during 2022-2028.
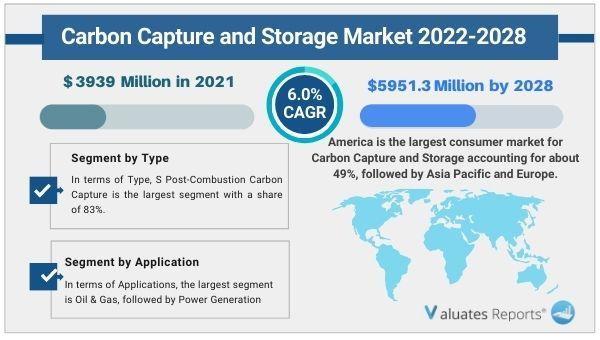
Carbon capture and storage (CCS) (or carbon capture and sequestration or carbon control and sequestration) is the process of capturing waste carbon dioxide (CO2) from large point sources, such as fossil fuel power plants, transporting it to a storage site, and depositing it where it will not enter the atmosphere, normally an underground geological formation. The aim is to prevent the release of large quantities of CO2 into the atmosphere (from fossil fuel use in power generation and other industries). It is a potential means of mitigating the contribution of fossil fuel emissions to global warming and ocean acidification. Although CO2 has been injected into geological formations for several decades for various purposes, including enhanced oil recovery, the long term storage of CO2 is a relatively new concept. The main Carbon Capture and Storage players include Exxonmobil Corporation, Schlumberger, Linde AG, Halliburton, etc. The top four Carbon Capture and Storage players account for approximately 35% of the total global market. America is the largest consumer market for Carbon Capture and Storage accounting for about 49%, followed by Asia Pacific and Europe. In terms of Type, S Post-Combustion Carbon Capture is the largest segment with a share of 83%. And in terms of Applications, the largest segment is Oil & Gas, followed by Power Generation. With industry-standard accuracy in analysis and high data integrity, the report makes a brilliant attempt to unveil key opportunities available in the global Carbon Capture and Storage market to help players in achieving a strong market position. Buyers of the report can access verified and reliable market forecasts, including those for the overall size of the global Carbon Capture and Storage market in terms of revenue. Overall, the report proves to be an effective tool that players can use to gain a competitive edge over their competitors and ensure lasting success in the global Carbon Capture and Storage market. All of the findings, data, and information provided in the report are validated and revalidated with the help of trustworthy sources. The analysts who have authored the report took a unique and industry-best research and analysis approach for an in-depth study of the global Carbon Capture and Storage market.
This section of the report has explored the overall status of the Covid scenario and has offered valuable insights into the changes in supply chain disruption, fluctuations in demand, etc. The analysts have also focused on the key measures that the companies are opting to withstand the harsh scenario.
The report has been segmented into product and application segments. The researchers have documented all the products present today in the Carbon Capture and Storage market. They have also shed light on the new product innovations and launches by the key players. In the segmental analysis, the analysts have provided revenue forecast figures based on type and application for the period 2017-2028. They have also discussed about the growth rate and potential of each segment for the period 2017-2028.
This segment focuses on the key players operating in the industry. It underlines all the current and future activities by the prominent manufacturers. By understanding various initiatives being taken up by different players, readers will gain the ability to settle on the correct business choices. The authors of the report have provided accurate revenue figures for the companies for the period 2017-2022. The clients are sure to gain the upper hand once they get hold of this report.
|
Report Metric |
Details |
|
Report Name |
Carbon Capture and Storage Market |
|
The market size in 2021 |
USD 3939 Million |
|
The revenue forecast in 2028 |
USD 5951.3 Million |
|
Growth Rate |
Compound Annual Growth Rate (CAGR) of 6.0% from 2022 to 2028 |
|
Market size available for years |
2022-2028 |
|
Forecast units |
Value (USD) |
|
Segments covered |
By Type, Application, and Region |
|
Report coverage |
Revenue & volume forecast, company share, competitive landscape, growth factors, and trends |
|
Geographic regions covered |
North America, Europe, Asia Pacific, Latin America, Middle East & Africa |
Ans. The global Carbon Capture and Storage market size is projected to reach US$ 5951.3 million by 2028, from US$ 3939 million in 2021.
Ans. The global Carbon Capture and Storage market is expected to grow at a compound annual growth rate of 6.0% from 2022 to 2028.
Ans. The main Carbon Capture and Storage players include ExxonMobil Corporation, Schlumberger, Linde AG, Halliburton, etc.
Table of Contents
1 Report Business Overview
1.1 Study Scope
1.2 Market Analysis by Type
1.2.1 Global Carbon Capture and Storage Market Size Growth Rate by Type, 2017 VS 2021 VS 2028
1.2.2 Pre-Combustion Carbon Capture
1.2.3 Oxy-Combustion Carbon Capture
1.2.4 Post-Combustion Carbon Capture
1.3 Market by Application
1.3.1 Global Carbon Capture and Storage Market Size Growth Rate by Application, 2017 VS 2021 VS 2028
1.3.2 Oil & Gas
1.3.3 Power Generation
1.3.4 Others
1.4 Study Objectives
1.5 Years Considered
2 Global Growth Trends
2.1 Global Carbon Capture and Storage Market Perspective (2017-2028)
2.2 Carbon Capture and Storage Growth Trends by Region
2.2.1 Carbon Capture and Storage Market Size by Region: 2017 VS 2021 VS 2028
2.2.2 Carbon Capture and Storage Historic Market Size by Region (2017-2022)
2.2.3 Carbon Capture and Storage Forecasted Market Size by Region (2023-2028)
2.3 Carbon Capture and Storage Market Dynamics
2.3.1 Carbon Capture and Storage Industry Trends
2.3.2 Carbon Capture and Storage Market Drivers
2.3.3 Carbon Capture and Storage Market Challenges
2.3.4 Carbon Capture and Storage Market Restraints
3 Competition Landscape by Key Players
3.1 Global Top Carbon Capture and Storage Players by Revenue
3.1.1 Global Top Carbon Capture and Storage Players by Revenue (2017-2022)
3.1.2 Global Carbon Capture and Storage Revenue Market Share by Players (2017-2022)
3.2 Global Carbon Capture and Storage Market Share by Company Type (Tier 1, Tier 2, and Tier 3)
3.3 Players Covered: Ranking by Carbon Capture and Storage Revenue
3.4 Global Carbon Capture and Storage Market Concentration Ratio
3.4.1 Global Carbon Capture and Storage Market Concentration Ratio (CR5 and HHI)
3.4.2 Global Top 10 and Top 5 Companies by Carbon Capture and Storage Revenue in 2021
3.5 Carbon Capture and Storage Key Players Head office and Area Served
3.6 Key Players Carbon Capture and Storage Product Solution and Service
3.7 Date of Enter into Carbon Capture and Storage Market
3.8 Mergers & Acquisitions, Expansion Plans
4 Carbon Capture and Storage Breakdown Data by Type
4.1 Global Carbon Capture and Storage Historic Market Size by Type (2017-2022)
4.2 Global Carbon Capture and Storage Forecasted Market Size by Type (2023-2028)
5 Carbon Capture and Storage Breakdown Data by Application
5.1 Global Carbon Capture and Storage Historic Market Size by Application (2017-2022)
5.2 Global Carbon Capture and Storage Forecasted Market Size by Application (2023-2028)
6 North America
6.1 North America Carbon Capture and Storage Market Size (2017-2028)
6.2 North America Carbon Capture and Storage Market Size by Type
6.2.1 North America Carbon Capture and Storage Market Size by Type (2017-2022)
6.2.2 North America Carbon Capture and Storage Market Size by Type (2023-2028)
6.2.3 North America Carbon Capture and Storage Market Share by Type (2017-2028)
6.3 North America Carbon Capture and Storage Market Size by Application
6.3.1 North America Carbon Capture and Storage Market Size by Application (2017-2022)
6.3.2 North America Carbon Capture and Storage Market Size by Application (2023-2028)
6.3.3 North America Carbon Capture and Storage Market Share by Application (2017-2028)
6.4 North America Carbon Capture and Storage Market Size by Country
6.4.1 North America Carbon Capture and Storage Market Size by Country (2017-2022)
6.4.2 North America Carbon Capture and Storage Market Size by Country (2023-2028)
6.4.3 U.S.
6.4.4 Canada
7 Europe
7.1 Europe Carbon Capture and Storage Market Size (2017-2028)
7.2 Europe Carbon Capture and Storage Market Size by Type
7.2.1 Europe Carbon Capture and Storage Market Size by Type (2017-2022)
7.2.2 Europe Carbon Capture and Storage Market Size by Type (2023-2028)
7.2.3 Europe Carbon Capture and Storage Market Share by Type (2017-2028)
7.3 Europe Carbon Capture and Storage Market Size by Application
7.3.1 Europe Carbon Capture and Storage Market Size by Application (2017-2022)
7.3.2 Europe Carbon Capture and Storage Market Size by Application (2023-2028)
7.3.3 Europe Carbon Capture and Storage Market Share by Application (2017-2028)
7.4 Europe Carbon Capture and Storage Market Size by Country
7.4.1 Europe Carbon Capture and Storage Market Size by Country (2017-2022)
7.4.2 Europe Carbon Capture and Storage Market Size by Country (2023-2028)
7.4.3 Germany
7.4.4 France
7.4.5 U.K.
7.4.6 Italy
7.4.7 Russia
7.4.8 Nordic Countries
8 Asia-Pacific
8.1 Asia-Pacific Carbon Capture and Storage Market Size (2017-2028)
8.2 Asia-Pacific Carbon Capture and Storage Market Size by Type
8.2.1 Asia-Pacific Carbon Capture and Storage Market Size by Type (2017-2022)
8.2.2 Asia-Pacific Carbon Capture and Storage Market Size by Type (2023-2028)
8.2.3 Asia-Pacific Carbon Capture and Storage Market Share by Type (2017-2028)
8.3 Asia-Pacific Carbon Capture and Storage Market Size by Application
8.3.1 Asia-Pacific Carbon Capture and Storage Market Size by Application (2017-2022)
8.3.2 Asia-Pacific Carbon Capture and Storage Market Size by Application (2023-2028)
8.3.3 Asia-Pacific Carbon Capture and Storage Market Share by Application (2017-2028)
8.4 Asia-Pacific Carbon Capture and Storage Market Size by Region
8.4.1 Asia-Pacific Carbon Capture and Storage Market Size by Region (2017-2022)
8.4.2 Asia-Pacific Carbon Capture and Storage Market Size by Region (2023-2028)
8.4.3 China
8.4.4 Japan
8.4.5 South Korea
8.4.6 Southeast Asia
8.4.7 India
8.4.8 Australia
9 Latin America
9.1 Latin America Carbon Capture and Storage Market Size (2017-2028)
9.2 Latin America Carbon Capture and Storage Market Size by Type
9.2.1 Latin America Carbon Capture and Storage Market Size by Type (2017-2022)
9.2.2 Latin America Carbon Capture and Storage Market Size by Type (2023-2028)
9.2.3 Latin America Carbon Capture and Storage Market Share by Type (2017-2028)
9.3 Latin America Carbon Capture and Storage Market Size by Application
9.3.1 Latin America Carbon Capture and Storage Market Size by Application (2017-2022)
9.3.2 Latin America Carbon Capture and Storage Market Size by Application (2023-2028)
9.3.3 Latin America Carbon Capture and Storage Market Share by Application (2017-2028)
9.4 Latin America Carbon Capture and Storage Market Size by Country
9.4.1 Latin America Carbon Capture and Storage Market Size by Country (2017-2022)
9.4.2 Latin America Carbon Capture and Storage Market Size by Country (2023-2028)
9.4.3 Mexico
9.4.4 Brazil
10 Middle East & Africa
10.1 Middle East & Africa Carbon Capture and Storage Market Size (2017-2028)
10.2 Middle East & Africa Carbon Capture and Storage Market Size by Type
10.2.1 Middle East & Africa Carbon Capture and Storage Market Size by Type (2017-2022)
10.2.2 Middle East & Africa Carbon Capture and Storage Market Size by Type (2023-2028)
10.2.3 Middle East & Africa Carbon Capture and Storage Market Share by Type (2017-2028)
10.3 Middle East & Africa Carbon Capture and Storage Market Size by Application
10.3.1 Middle East & Africa Carbon Capture and Storage Market Size by Application (2017-2022)
10.3.2 Middle East & Africa Carbon Capture and Storage Market Size by Application (2023-2028)
10.3.3 Middle East & Africa Carbon Capture and Storage Market Share by Application (2017-2028)
10.4 Middle East & Africa Carbon Capture and Storage Market Size by Country
10.4.1 Middle East & Africa Carbon Capture and Storage Market Size by Country (2017-2022)
10.4.2 Middle East & Africa Carbon Capture and Storage Market Size by Country (2023-2028)
10.4.3 Turkey
10.4.4 Saudi Arabia
10.4.5 UAE
11 Key Players Profiles
11.1 Exxonmobil Corporation
11.1.1 Exxonmobil Corporation Company Details
11.1.2 Exxonmobil Corporation Business Overview
11.1.3 Exxonmobil Corporation Carbon Capture and Storage Introduction
11.1.4 Exxonmobil Corporation Revenue in Carbon Capture and Storage Business (2017-2022)
11.1.5 Exxonmobil Corporation Recent Developments
11.2 Schlumberger
11.2.1 Schlumberger Company Details
11.2.2 Schlumberger Business Overview
11.2.3 Schlumberger Carbon Capture and Storage Introduction
11.2.4 Schlumberger Revenue in Carbon Capture and Storage Business (2017-2022)
11.2.5 Schlumberger Recent Developments
11.3 Huaneng
11.3.1 Huaneng Company Details
11.3.2 Huaneng Business Overview
11.3.3 Huaneng Carbon Capture and Storage Introduction
11.3.4 Huaneng Revenue in Carbon Capture and Storage Business (2017-2022)
11.3.5 Huaneng Recent Developments
11.4 Linde AG
11.4.1 Linde AG Company Details
11.4.2 Linde AG Business Overview
11.4.3 Linde AG Carbon Capture and Storage Introduction
11.4.4 Linde AG Revenue in Carbon Capture and Storage Business (2017-2022)
11.4.5 Linde AG Recent Developments
11.5 Halliburton
11.5.1 Halliburton Company Details
11.5.2 Halliburton Business Overview
11.5.3 Halliburton Carbon Capture and Storage Introduction
11.5.4 Halliburton Revenue in Carbon Capture and Storage Business (2017-2022)
11.5.5 Halliburton Recent Developments
11.6 BASF
11.6.1 BASF Company Details
11.6.2 BASF Business Overview
11.6.3 BASF Carbon Capture and Storage Introduction
11.6.4 BASF Revenue in Carbon Capture and Storage Business (2017-2022)
11.6.5 BASF Recent Developments
11.7 General Electric
11.7.1 General Electric Company Details
11.7.2 General Electric Business Overview
11.7.3 General Electric Carbon Capture and Storage Introduction
11.7.4 General Electric Revenue in Carbon Capture and Storage Business (2017-2022)
11.7.5 General Electric Recent Developments
11.8 Siemens
11.8.1 Siemens Company Details
11.8.2 Siemens Business Overview
11.8.3 Siemens Carbon Capture and Storage Introduction
11.8.4 Siemens Revenue in Carbon Capture and Storage Business (2017-2022)
11.8.5 Siemens Recent Developments
11.9 Honeywell UOP
11.9.1 Honeywell UOP Company Details
11.9.2 Honeywell UOP Business Overview
11.9.3 Honeywell UOP Carbon Capture and Storage Introduction
11.9.4 Honeywell UOP Revenue in Carbon Capture and Storage Business (2017-2022)
11.9.5 Honeywell UOP Recent Developments
11.10 Sulzer
11.10.1 Sulzer Company Details
11.10.2 Sulzer Business Overview
11.10.3 Sulzer Carbon Capture and Storage Introduction
11.10.4 Sulzer Revenue in Carbon Capture and Storage Business (2017-2022)
11.10.5 Sulzer Recent Developments
11.11 Equinor
11.11.1 Equinor Company Details
11.11.2 Equinor Business Overview
11.11.3 Equinor Carbon Capture and Storage Introduction
11.11.4 Equinor Revenue in Carbon Capture and Storage Business (2017-2022)
11.11.5 Equinor Recent Developments
11.12 NRG
11.12.1 NRG Company Details
11.12.2 NRG Business Overview
11.12.3 NRG Carbon Capture and Storage Introduction
11.12.4 NRG Revenue in Carbon Capture and Storage Business (2017-2022)
11.12.5 NRG Recent Developments
11.13 AkerSolutions
11.13.1 AkerSolutions Company Details
11.13.2 AkerSolutions Business Overview
11.13.3 AkerSolutions Carbon Capture and Storage Introduction
11.13.4 AkerSolutions Revenue in Carbon Capture and Storage Business (2017-2022)
11.13.5 AkerSolutions Recent Developments
11.14 Shell
11.14.1 Shell Company Details
11.14.2 Shell Business Overview
11.14.3 Shell Carbon Capture and Storage Introduction
11.14.4 Shell Revenue in Carbon Capture and Storage Business (2017-2022)
11.14.5 Shell Recent Developments
11.15 Skyonic Corp.
11.15.1 Skyonic Corp. Company Details
11.15.2 Skyonic Corp. Business Overview
11.15.3 Skyonic Corp. Carbon Capture and Storage Introduction
11.15.4 Skyonic Corp. Revenue in Carbon Capture and Storage Business (2017-2022)
11.15.5 Skyonic Corp. Recent Developments
11.16 Mitsubishi Hitachi
11.16.1 Mitsubishi Hitachi Company Details
11.16.2 Mitsubishi Hitachi Business Overview
11.16.3 Mitsubishi Hitachi Carbon Capture and Storage Introduction
11.16.4 Mitsubishi Hitachi Revenue in Carbon Capture and Storage Business (2017-2022)
11.16.5 Mitsubishi Hitachi Recent Developments
11.17 Fluor
11.17.1 Fluor Company Details
11.17.2 Fluor Business Overview
11.17.3 Fluor Carbon Capture and Storage Introduction
11.17.4 Fluor Revenue in Carbon Capture and Storage Business (2017-2022)
11.17.5 Fluor Recent Developments
11.18 Sinopec
11.18.1 Sinopec Company Details
11.18.2 Sinopec Business Overview
11.18.3 Sinopec Carbon Capture and Storage Introduction
11.18.4 Sinopec Revenue in Carbon Capture and Storage Business (2017-2022)
11.18.5 Sinopec Recent Developments
12 Analyst's Viewpoints/Conclusions
13 Appendix
13.1 Research Methodology
13.1.1 Methodology/Research Approach
13.1.2 Data Source
13.2 Author Details
13.3 Disclaimer
List of Tables
Table 1. Global Carbon Capture and Storage Market Size Growth Rate by Type (US$ Million), 2017 VS 2021 VS 2028
Table 2. Key Players of Pre-Combustion Carbon Capture
Table 3. Key Players of Oxy-Combustion Carbon Capture
Table 4. Key Players of Post-Combustion Carbon Capture
Table 5. Global Carbon Capture and Storage Market Size Growth Rate by Application (US$ Million), 2017 VS 2021 VS 2028
Table 6. Global Carbon Capture and Storage Market Size by Region (US$ Million): 2017 VS 2021 VS 2028
Table 7. Global Carbon Capture and Storage Market Size by Region (2017-2022) & (US$ Million)
Table 8. Global Carbon Capture and Storage Market Share by Region (2017-2022)
Table 9. Global Carbon Capture and Storage Forecasted Market Size by Region (2023-2028) & (US$ Million)
Table 10. Global Carbon Capture and Storage Market Share by Region (2023-2028)
Table 11. Carbon Capture and Storage Market Trends
Table 12. Carbon Capture and Storage Market Drivers
Table 13. Carbon Capture and Storage Market Challenges
Table 14. Carbon Capture and Storage Market Restraints
Table 15. Global Carbon Capture and Storage Revenue by Players (2017-2022) & (US$ Million)
Table 16. Global Carbon Capture and Storage Revenue Share by Players (2017-2022)
Table 17. Global Top Carbon Capture and Storage by Company Type (Tier 1, Tier 2, and Tier 3) & (based on the Revenue in Carbon Capture and Storage as of 2021)
Table 18. Ranking of Global Top Carbon Capture and Storage Companies by Revenue (US$ Million) in 2021
Table 19. Global 5 Largest Players Market Share by Carbon Capture and Storage Revenue (CR5 and HHI) & (2017-2022)
Table 20. Key Players Headquarters and Area Served
Table 21. Key Players Carbon Capture and Storage Product Solution and Service
Table 22. Date of Enter into Carbon Capture and Storage Market
Table 23. Mergers & Acquisitions, Expansion Plans
Table 24. Global Carbon Capture and Storage Market Size by Type (2017-2022) & (US$ Million)
Table 25. Global Carbon Capture and Storage Revenue Market Share by Type (2017-2022)
Table 26. Global Carbon Capture and Storage Forecasted Market Size by Type (2023-2028) & (US$ Million)
Table 27. Global Carbon Capture and Storage Revenue Market Share by Type (2023-2028)
Table 28. Global Carbon Capture and Storage Market Size by Application (2017-2022) & (US$ Million)
Table 29. Global Carbon Capture and Storage Revenue Share by Application (2017-2022)
Table 30. Global Carbon Capture and Storage Forecasted Market Size by Application (2023-2028) & (US$ Million)
Table 31. Global Carbon Capture and Storage Revenue Share by Application (2023-2028)
Table 32. North America Carbon Capture and Storage Market Size by Type (2017-2022) & (US$ Million)
Table 33. North America Carbon Capture and Storage Market Size by Type (2023-2028) & (US$ Million)
Table 34. North America Carbon Capture and Storage Market Size by Application (2017-2022) & (US$ Million)
Table 35. North America Carbon Capture and Storage Market Size by Application (2023-2028) & (US$ Million)
Table 36. North America Carbon Capture and Storage Market Size by Country (2017-2022) & (US$ Million)
Table 37. North America Carbon Capture and Storage Market Size by Country (2023-2028) & (US$ Million)
Table 38. Europe Carbon Capture and Storage Market Size by Type (2017-2022) & (US$ Million)
Table 39. Europe Carbon Capture and Storage Market Size by Type (2023-2028) & (US$ Million)
Table 40. Europe Carbon Capture and Storage Market Size by Application (2017-2022) & (US$ Million)
Table 41. Europe Carbon Capture and Storage Market Size by Application (2023-2028) & (US$ Million)
Table 42. Europe Carbon Capture and Storage Market Size by Country (2017-2022) & (US$ Million)
Table 43. Europe Carbon Capture and Storage Market Size by Country (2023-2028) & (US$ Million)
Table 44. Asia Pacific Carbon Capture and Storage Market Size by Type (2017-2022) & (US$ Million)
Table 45. Asia Pacific Carbon Capture and Storage Market Size by Type (2023-2028) & (US$ Million)
Table 46. Asia Pacific Carbon Capture and Storage Market Size by Application (2017-2022) & (US$ Million)
Table 47. Asia Pacific Carbon Capture and Storage Market Size by Application (2023-2028) & (US$ Million)
Table 48. Asia Pacific Carbon Capture and Storage Market Size by Region (2017-2022) & (US$ Million)
Table 49. Asia Pacific Carbon Capture and Storage Market Size by Region (2023-2028) & (US$ Million)
Table 50. Latin America Carbon Capture and Storage Market Size by Type (2017-2022) & (US$ Million)
Table 51. Latin America Carbon Capture and Storage Market Size by Type (2023-2028) & (US$ Million)
Table 52. Latin America Carbon Capture and Storage Market Size by Application (2017-2022) & (US$ Million)
Table 53. Latin America Carbon Capture and Storage Market Size by Application (2023-2028) & (US$ Million)
Table 54. Latin America Carbon Capture and Storage Market Size by Country (2017-2022) & (US$ Million)
Table 55. Latin America Carbon Capture and Storage Market Size by Country (2023-2028) & (US$ Million)
Table 56. Middle East and Africa Carbon Capture and Storage Market Size by Type (2017-2022) & (US$ Million)
Table 57. Middle East and Africa Carbon Capture and Storage Market Size by Type (2023-2028) & (US$ Million)
Table 58. Middle East and Africa Carbon Capture and Storage Market Size by Application (2017-2022) & (US$ Million)
Table 59. Middle East and Africa Carbon Capture and Storage Market Size by Application (2023-2028) & (US$ Million)
Table 60. Middle East and Africa Carbon Capture and Storage Market Size by Country (2017-2022) & (US$ Million)
Table 61. Middle East and Africa Carbon Capture and Storage Market Size by Country (2023-2028) & (US$ Million)
Table 62. Exxonmobil Corporation Company Details
Table 63. Exxonmobil Corporation Business Overview
Table 64. Exxonmobil Corporation Carbon Capture and Storage Product
Table 65. Exxonmobil Corporation Revenue in Carbon Capture and Storage Business (2017-2022) & (US$ Million)
Table 66. Exxonmobil Corporation Recent Developments
Table 67. Schlumberger Company Details
Table 68. Schlumberger Business Overview
Table 69. Schlumberger Carbon Capture and Storage Product
Table 70. Schlumberger Revenue in Carbon Capture and Storage Business (2017-2022) & (US$ Million)
Table 71. Schlumberger Recent Developments
Table 72. Huaneng Company Details
Table 73. Huaneng Business Overview
Table 74. Huaneng Carbon Capture and Storage Product
Table 75. Huaneng Revenue in Carbon Capture and Storage Business (2017-2022) & (US$ Million)
Table 76. Huaneng Recent Developments
Table 77. Linde AG Company Details
Table 78. Linde AG Business Overview
Table 79. Linde AG Carbon Capture and Storage Product
Table 80. Linde AG Revenue in Carbon Capture and Storage Business (2017-2022) & (US$ Million)
Table 81. Linde AG Recent Developments
Table 82. Halliburton Company Details
Table 83. Halliburton Business Overview
Table 84. Halliburton Carbon Capture and Storage Product
Table 85. Halliburton Revenue in Carbon Capture and Storage Business (2017-2022) & (US$ Million)
Table 86. Halliburton Recent Developments
Table 87. BASF Company Details
Table 88. BASF Business Overview
Table 89. BASF Carbon Capture and Storage Product
Table 90. BASF Revenue in Carbon Capture and Storage Business (2017-2022) & (US$ Million)
Table 91. BASF Recent Developments
Table 92. General Electric Company Details
Table 93. General Electric Business Overview
Table 94. General Electric Carbon Capture and Storage Product
Table 95. General Electric Revenue in Carbon Capture and Storage Business (2017-2022) & (US$ Million)
Table 96. General Electric Recent Developments
Table 97. Siemens Company Details
Table 98. Siemens Business Overview
Table 99. Siemens Carbon Capture and Storage Product
Table 100. Siemens Revenue in Carbon Capture and Storage Business (2017-2022) & (US$ Million)
Table 101. Siemens Recent Developments
Table 102. Honeywell UOP Company Details
Table 103. Honeywell UOP Business Overview
Table 104. Honeywell UOP Carbon Capture and Storage Product
Table 105. Honeywell UOP Revenue in Carbon Capture and Storage Business (2017-2022) & (US$ Million)
Table 106. Honeywell UOP Recent Developments
Table 107. Sulzer Company Details
Table 108. Sulzer Business Overview
Table 109. Sulzer Carbon Capture and Storage Product
Table 110. Sulzer Revenue in Carbon Capture and Storage Business (2017-2022) & (US$ Million)
Table 111. Sulzer Recent Developments
Table 112. Equinor Company Details
Table 113. Equinor Business Overview
Table 114. Equinor Carbon Capture and Storage Product
Table 115. Equinor Revenue in Carbon Capture and Storage Business (2017-2022) & (US$ Million)
Table 116. Equinor Recent Developments
Table 117. NRG Company Details
Table 118. NRG Business Overview
Table 119. NRG Carbon Capture and Storage Product
Table 120. NRG Revenue in Carbon Capture and Storage Business (2017-2022) & (US$ Million)
Table 121. NRG Recent Developments
Table 122. AkerSolutions Company Details
Table 123. AkerSolutions Business Overview
Table 124. AkerSolutions Carbon Capture and Storage Product
Table 125. AkerSolutions Revenue in Carbon Capture and Storage Business (2017-2022) & (US$ Million)
Table 126. AkerSolutions Recent Developments
Table 127. Shell Company Details
Table 128. Shell Business Overview
Table 129. Shell Carbon Capture and Storage Product
Table 130. Shell Revenue in Carbon Capture and Storage Business (2017-2022) & (US$ Million)
Table 131. Shell Recent Developments
Table 132. Skyonic Corp. Company Details
Table 133. Skyonic Corp. Business Overview
Table 134. Skyonic Corp. Carbon Capture and Storage Product
Table 135. Skyonic Corp. Revenue in Carbon Capture and Storage Business (2017-2022) & (US$ Million)
Table 136. Skyonic Corp. Recent Developments
Table 137. Mitsubishi Hitachi Company Details
Table 138. Mitsubishi Hitachi Business Overview
Table 139. Mitsubishi Hitachi Carbon Capture and Storage Product
Table 140. Mitsubishi Hitachi Revenue in Carbon Capture and Storage Business (2017-2022) & (US$ Million)
Table 141. Mitsubishi Hitachi Recent Developments
Table 142. Fluor Company Details
Table 143. Fluor Business Overview
Table 144. Fluor Carbon Capture and Storage Product
Table 145. Fluor Revenue in Carbon Capture and Storage Business (2017-2022) & (US$ Million)
Table 146. Fluor Recent Developments
Table 147. Sinopec Company Details
Table 148. Sinopec Business Overview
Table 149. Sinopec Carbon Capture and Storage Product
Table 150. Sinopec Revenue in Carbon Capture and Storage Business (2017-2022) & (US$ Million)
Table 151. Sinopec Recent Developments
Table 152. Research Programs/Design for This Report
Table 153. Key Data Information from Secondary Sources
Table 154. Key Data Information from Primary Sources
List of Figures
Figure 1. Global Carbon Capture and Storage Market Share by Type: 2021 VS 2028
Figure 2. Pre-Combustion Carbon Capture Features
Figure 3. Oxy-Combustion Carbon Capture Features
Figure 4. Post-Combustion Carbon Capture Features
Figure 5. Global Carbon Capture and Storage Market Share by Application: 2021 VS 2028
Figure 6. Oil & Gas Case Studies
Figure 7. Power Generation Case Studies
Figure 8. Others Case Studies
Figure 9. Carbon Capture and Storage Report Years Considered
Figure 10. Global Carbon Capture and Storage Market Size (US$ Million), Year-over-Year: 2017-2028
Figure 11. Global Carbon Capture and Storage Market Size, (US$ Million), 2017 VS 2021 VS 2028
Figure 12. Global Carbon Capture and Storage Market Share by Region: 2021 VS 2028
Figure 13. Global Carbon Capture and Storage Market Share by Players in 2021
Figure 14. Global Top Carbon Capture and Storage Players by Company Type (Tier 1, Tier 2, and Tier 3) & (based on the Revenue in Carbon Capture and Storage as of 2021)
Figure 15. The Top 10 and 5 Players Market Share by Carbon Capture and Storage Revenue in 2021
Figure 16. North America Carbon Capture and Storage Market Size YoY (2017-2028) & (US$ Million)
Figure 17. North America Carbon Capture and Storage Market Size Market Share by Type (2017-2028)
Figure 18. North America Carbon Capture and Storage Market Size Market Share by Application (2017-2028)
Figure 19. North America Carbon Capture and Storage Market Size Share by Country (2017-2028)
Figure 20. United States Carbon Capture and Storage Market Size YoY Growth (2017-2028) & (US$ Million)
Figure 21. Canada Carbon Capture and Storage Market Size YoY Growth (2017-2028) & (US$ Million)
Figure 22. Europe Carbon Capture and Storage Market Size YoY (2017-2028) & (US$ Million)
Figure 23. Europe Carbon Capture and Storage Market Size Market Share by Type (2017-2028)
Figure 24. Europe Carbon Capture and Storage Market Size Market Share by Application (2017-2028)
Figure 25. Europe Carbon Capture and Storage Market Size Share by Country (2017-2028)
Figure 26. Germany Carbon Capture and Storage Market Size YoY Growth (2017-2028) & (US$ Million)
Figure 27. France Carbon Capture and Storage Market Size YoY Growth (2017-2028) & (US$ Million)
Figure 28. U.K. Carbon Capture and Storage Market Size YoY Growth (2017-2028) & (US$ Million)
Figure 29. Italy Carbon Capture and Storage Market Size YoY Growth (2017-2028) & (US$ Million)
Figure 30. Russia Carbon Capture and Storage Market Size YoY Growth (2017-2028) & (US$ Million)
Figure 31. Nordic Countries Carbon Capture and Storage Market Size YoY Growth (2017-2028) & (US$ Million)
Figure 32. Asia-Pacific Carbon Capture and Storage Market Size YoY (2017-2028) & (US$ Million)
Figure 33. Asia Pacific Carbon Capture and Storage Market Size Market Share by Type (2017-2028)
Figure 34. Asia Pacific Carbon Capture and Storage Market Size Market Share by Application (2017-2028)
Figure 35. Asia Pacific Carbon Capture and Storage Market Size Share by Region (2017-2028)
Figure 36. China Carbon Capture and Storage Market Size YoY Growth (2017-2028) & (US$ Million)
Figure 37. Japan Carbon Capture and Storage Market Size YoY Growth (2017-2028) & (US$ Million)
Figure 38. South Korea Carbon Capture and Storage Market Size YoY Growth (2017-2028) & (US$ Million)
Figure 39. Southeast Asia Carbon Capture and Storage Market Size YoY Growth (2017-2028) & (US$ Million)
Figure 40. India Carbon Capture and Storage Market Size YoY Growth (2017-2028) & (US$ Million)
Figure 41. Australia Carbon Capture and Storage Market Size YoY Growth (2017-2028) & (US$ Million)
Figure 42. Latin America Carbon Capture and Storage Market Size YoY (2017-2028) & (US$ Million)
Figure 43. Latin America Carbon Capture and Storage Market Size Market Share by Type (2017-2028)
Figure 44. Latin America Carbon Capture and Storage Market Size Market Share by Application (2017-2028)
Figure 45. Latin America Carbon Capture and Storage Market Size Share by Country (2017-2028)
Figure 46. Mexico Carbon Capture and Storage Market Size YoY Growth (2017-2028) & (US$ Million)
Figure 47. Brazil Carbon Capture and Storage Market Size YoY Growth (2017-2028) & (US$ Million)
Figure 48. Middle East & Africa Carbon Capture and Storage Market Size YoY (2017-2028) & (US$ Million)
Figure 49. Middle East and Africa Carbon Capture and Storage Market Size Market Share by Type (2017-2028)
Figure 50. Middle East and Africa Carbon Capture and Storage Market Size Market Share by Application (2017-2028)
Figure 51. Middle East and Africa Carbon Capture and Storage Market Size Share by Country (2017-2028)
Figure 52. Turkey Carbon Capture and Storage Market Size YoY Growth (2017-2028) & (US$ Million)
Figure 53. Saudi Arabia Carbon Capture and Storage Market Size YoY Growth (2017-2028) & (US$ Million)
Figure 54. UAE Carbon Capture and Storage Market Size YoY Growth (2017-2028) & (US$ Million)
Figure 55. Exxonmobil Corporation Revenue Growth Rate in Carbon Capture and Storage Business (2017-2022)
Figure 56. Schlumberger Revenue Growth Rate in Carbon Capture and Storage Business (2017-2022)
Figure 57. Huaneng Revenue Growth Rate in Carbon Capture and Storage Business (2017-2022)
Figure 58. Linde AG Revenue Growth Rate in Carbon Capture and Storage Business (2017-2022)
Figure 59. Halliburton Revenue Growth Rate in Carbon Capture and Storage Business (2017-2022)
Figure 60. BASF Revenue Growth Rate in Carbon Capture and Storage Business (2017-2022)
Figure 61. General Electric Revenue Growth Rate in Carbon Capture and Storage Business (2017-2022)
Figure 62. Siemens Revenue Growth Rate in Carbon Capture and Storage Business (2017-2022)
Figure 63. Honeywell UOP Revenue Growth Rate in Carbon Capture and Storage Business (2017-2022)
Figure 64. Sulzer Revenue Growth Rate in Carbon Capture and Storage Business (2017-2022)
Figure 65. Equinor Revenue Growth Rate in Carbon Capture and Storage Business (2017-2022)
Figure 66. NRG Revenue Growth Rate in Carbon Capture and Storage Business (2017-2022)
Figure 67. AkerSolutions Revenue Growth Rate in Carbon Capture and Storage Business (2017-2022)
Figure 68. Shell Revenue Growth Rate in Carbon Capture and Storage Business (2017-2022)
Figure 69. Skyonic Corp. Revenue Growth Rate in Carbon Capture and Storage Business (2017-2022)
Figure 70. Mitsubishi Hitachi Revenue Growth Rate in Carbon Capture and Storage Business (2017-2022)
Figure 71. Fluor Revenue Growth Rate in Carbon Capture and Storage Business (2017-2022)
Figure 72. Sinopec Revenue Growth Rate in Carbon Capture and Storage Business (2017-2022)
Figure 73. Bottom-up and Top-down Approaches for This Report
Figure 74. Data Triangulation
Figure 75. Key Executives Interviewed
$4900
$9800
HAVE A QUERY?
OUR CUSTOMER

SIMILAR REPORTS