1 Market Overview
1.1 Vertical Rotary Steerable System Product Introduction
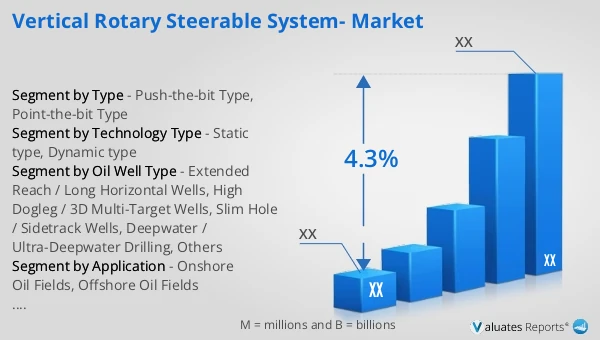
1.2 Global Vertical Rotary Steerable System Market Size Forecast
1.2.1 Global Vertical Rotary Steerable System Sales Value (2021–2032)
1.2.2 Global Vertical Rotary Steerable System Sales Volume (2021–2032)
1.2.3 Global Vertical Rotary Steerable System Sales Price (2021–2032)
1.3 Vertical Rotary Steerable System Market Trends & Drivers
1.3.1 Vertical Rotary Steerable System Industry Trends
1.3.2 Vertical Rotary Steerable System Market Drivers & Opportunities
1.3.3 Vertical Rotary Steerable System Market Challenges
1.3.4 Vertical Rotary Steerable System Market Restraints
1.3.5 Impact of U.S. Tariffs
1.4 Assumptions and Limitations
1.5 Study Objectives
1.6 Years Considered
2 Competitive Analysis by Company
2.1 Global Vertical Rotary Steerable System Players Revenue Ranking (2025)
2.2 Global Vertical Rotary Steerable System Revenue by Company (2021–2026)
2.3 Global Vertical Rotary Steerable System Sales Volume Ranking of Players (2025)
2.4 Global Vertical Rotary Steerable System Sales Volume by Company (2021–2026)
2.5 Global Vertical Rotary Steerable System Average Price by Company (2021–2026)
2.6 Key Manufacturers Vertical Rotary Steerable System Manufacturing Base and Headquarters
2.7 Key Manufacturers Vertical Rotary Steerable System Product Offerings
2.8 Key Manufacturers Start of Mass Production of Vertical Rotary Steerable System
2.9 Vertical Rotary Steerable System Market Competitive Analysis
2.9.1 Vertical Rotary Steerable System Market Concentration Rate (2021–2026)
2.9.2 Global 5 and 10 Largest Manufacturers by Vertical Rotary Steerable System Revenue in 2025
2.9.3 Global Companies by Tier (Tier 1, Tier 2, Tier 3), based on Vertical Rotary Steerable System revenue, 2025
2.10 Mergers & Acquisitions and Expansion
3 Segmentation Vertical Rotary Steerable System Market Classification
3.1 Introduction by Type
3.1.1 Push-the-bit Type
3.1.2 Point-the-bit Type
3.1.3 Global Vertical Rotary Steerable System Sales Value by Type
3.1.3.1 Global Vertical Rotary Steerable System Sales Value by Type (2021 vs 2025 vs 2032)
3.1.3.2 Global Vertical Rotary Steerable System Sales Value, by Type (2021–2032)
3.1.3.3 Global Vertical Rotary Steerable System Sales Value, by Type (%), 2021–2032
3.1.4 Global Vertical Rotary Steerable System Sales Volume by Type
3.1.4.1 Global Vertical Rotary Steerable System Sales Volume by Type (2021 vs 2025 vs 2032)
3.1.4.2 Global Vertical Rotary Steerable System Sales Volume, by Type (2021–2032)
3.1.4.3 Global Vertical Rotary Steerable System Sales Volume, by Type (%), 2021–2032
3.1.5 Global Vertical Rotary Steerable System Average Price by Type (2021–2032)
3.2 Introduction by Technology Type
3.2.1 Static type
3.2.2 Dynamic type
3.2.3 Global Vertical Rotary Steerable System Sales Value by Technology Type
3.2.3.1 Global Vertical Rotary Steerable System Sales Value by Technology Type (2021 vs 2025 vs 2032)
3.2.3.2 Global Vertical Rotary Steerable System Sales Value, by Technology Type (2021–2032)
3.2.3.3 Global Vertical Rotary Steerable System Sales Value, by Technology Type (%), 2021–2032
3.2.4 Global Vertical Rotary Steerable System Sales Volume by Technology Type
3.2.4.1 Global Vertical Rotary Steerable System Sales Volume by Technology Type (2021 vs 2025 vs 2032)
3.2.4.2 Global Vertical Rotary Steerable System Sales Volume, by Technology Type (2021–2032)
3.2.4.3 Global Vertical Rotary Steerable System Sales Volume, by Technology Type (%), 2021–2032
3.2.5 Global Vertical Rotary Steerable System Average Price by Technology Type (2021–2032)
3.3 Introduction by Oil Well Type
3.3.1 Extended Reach / Long Horizontal Wells
3.3.2 High Dogleg / 3D Multi-Target Wells
3.3.3 Slim Hole / Sidetrack Wells
3.3.4 Deepwater / Ultra-Deepwater Drilling
3.3.5 Others
3.3.6 Global Vertical Rotary Steerable System Sales Value by Oil Well Type
3.3.6.1 Global Vertical Rotary Steerable System Sales Value by Oil Well Type (2021 vs 2025 vs 2032)
3.3.6.2 Global Vertical Rotary Steerable System Sales Value, by Oil Well Type (2021–2032)
3.3.6.3 Global Vertical Rotary Steerable System Sales Value, by Oil Well Type (%), 2021–2032
3.3.7 Global Vertical Rotary Steerable System Sales Volume by Oil Well Type
3.3.7.1 Global Vertical Rotary Steerable System Sales Volume by Oil Well Type (2021 vs 2025 vs 2032)
3.3.7.2 Global Vertical Rotary Steerable System Sales Volume, by Oil Well Type (2021–2032)
3.3.7.3 Global Vertical Rotary Steerable System Sales Volume, by Oil Well Type (%), 2021–2032
3.3.8 Global Vertical Rotary Steerable System Average Price by Oil Well Type (2021–2032)
4 Segmentation by Application
4.1 Introduction by Application
4.1.1 Onshore Oil Fields
4.1.2 Offshore Oil Fields
4.2 Global Vertical Rotary Steerable System Sales Value by Application
4.2.1 Global Vertical Rotary Steerable System Sales Value by Application (2021 vs 2025 vs 2032)
4.2.2 Global Vertical Rotary Steerable System Sales Value, by Application (2021–2032)
4.2.3 Global Vertical Rotary Steerable System Sales Value, by Application (%), 2021–2032
4.3 Global Vertical Rotary Steerable System Sales Volume by Application
4.3.1 Global Vertical Rotary Steerable System Sales Volume by Application (2021 vs 2025 vs 2032)
4.3.2 Global Vertical Rotary Steerable System Sales Volume, by Application (2021–2032)
4.3.3 Global Vertical Rotary Steerable System Sales Volume, by Application (%), 2021–2032
4.4 Global Vertical Rotary Steerable System Average Price by Application (2021–2032)
5 Segmentation by Region
5.1 Global Vertical Rotary Steerable System Sales Value by Region
5.1.1 Global Vertical Rotary Steerable System Sales Value by Region: 2021 vs 2025 vs 2032
5.1.2 Global Vertical Rotary Steerable System Sales Value by Region (2021–2026)
5.1.3 Global Vertical Rotary Steerable System Sales Value by Region (2027–2032)
5.1.4 Global Vertical Rotary Steerable System Sales Value by Region (%), 2021–2032
5.2 Global Vertical Rotary Steerable System Sales Volume by Region
5.2.1 Global Vertical Rotary Steerable System Sales Volume by Region: 2021 vs 2025 vs 2032
5.2.2 Global Vertical Rotary Steerable System Sales Volume by Region (2021–2026)
5.2.3 Global Vertical Rotary Steerable System Sales Volume by Region (2027–2032)
5.2.4 Global Vertical Rotary Steerable System Sales Volume by Region (%), 2021–2032
5.3 Global Vertical Rotary Steerable System Average Price by Region (2021–2032)
5.4 North America
5.4.1 North America Vertical Rotary Steerable System Sales Value, 2021–2032
5.4.2 North America Vertical Rotary Steerable System Sales Value by Country (%), 2025 vs 2032
5.5 Europe
5.5.1 Europe Vertical Rotary Steerable System Sales Value, 2021–2032
5.5.2 Europe Vertical Rotary Steerable System Sales Value by Country (%), 2025 vs 2032
5.6 Asia Pacific
5.6.1 Asia Pacific Vertical Rotary Steerable System Sales Value, 2021–2032
5.6.2 Asia Pacific Vertical Rotary Steerable System Sales Value by Region (%), 2025 vs 2032
5.7 South America
5.7.1 South America Vertical Rotary Steerable System Sales Value, 2021–2032
5.7.2 South America Vertical Rotary Steerable System Sales Value by Country (%), 2025 vs 2032
5.8 Middle East & Africa
5.8.1 Middle East & Africa Vertical Rotary Steerable System Sales Value, 2021–2032
5.8.2 Middle East & Africa Vertical Rotary Steerable System Sales Value by Country (%), 2025 vs 2032
6 Segmentation by Key Countries/Regions
6.1 Key Countries/Regions Vertical Rotary Steerable System Sales Value Growth Trends, 2021 vs 2025 vs 2032
6.2 Key Countries/Regions Vertical Rotary Steerable System Sales Value and Sales Volume
6.2.1 Key Countries/Regions Vertical Rotary Steerable System Sales Value, 2021–2032
6.2.2 Key Countries/Regions Vertical Rotary Steerable System Sales Volume, 2021–2032
6.3 United States
6.3.1 United States Vertical Rotary Steerable System Sales Value, 2021–2032
6.3.2 United States Vertical Rotary Steerable System Sales Value by Type (%), 2025 vs 2032
6.3.3 United States Vertical Rotary Steerable System Sales Value by Application, 2025 vs 2032
6.4 Europe
6.4.1 Europe Vertical Rotary Steerable System Sales Value, 2021–2032
6.4.2 Europe Vertical Rotary Steerable System Sales Value by Type (%), 2025 vs 2032
6.4.3 Europe Vertical Rotary Steerable System Sales Value by Application, 2025 vs 2032
6.5 China
6.5.1 China Vertical Rotary Steerable System Sales Value, 2021–2032
6.5.2 China Vertical Rotary Steerable System Sales Value by Type (%), 2025 vs 2032
6.5.3 China Vertical Rotary Steerable System Sales Value by Application, 2025 vs 2032
6.6 Japan
6.6.1 Japan Vertical Rotary Steerable System Sales Value, 2021–2032
6.6.2 Japan Vertical Rotary Steerable System Sales Value by Type (%), 2025 vs 2032
6.6.3 Japan Vertical Rotary Steerable System Sales Value by Application, 2025 vs 2032
6.7 South Korea
6.7.1 South Korea Vertical Rotary Steerable System Sales Value, 2021–2032
6.7.2 South Korea Vertical Rotary Steerable System Sales Value by Type (%), 2025 vs 2032
6.7.3 South Korea Vertical Rotary Steerable System Sales Value by Application, 2025 vs 2032
6.8 Southeast Asia
6.8.1 Southeast Asia Vertical Rotary Steerable System Sales Value, 2021–2032
6.8.2 Southeast Asia Vertical Rotary Steerable System Sales Value by Type (%), 2025 vs 2032
6.8.3 Southeast Asia Vertical Rotary Steerable System Sales Value by Application, 2025 vs 2032
6.9 India
6.9.1 India Vertical Rotary Steerable System Sales Value, 2021–2032
6.9.2 India Vertical Rotary Steerable System Sales Value by Type (%), 2025 vs 2032
6.9.3 India Vertical Rotary Steerable System Sales Value by Application, 2025 vs 2032
7 Company Profiles
7.1 Schlumberger
7.1.1 Schlumberger Company Information
7.1.2 Schlumberger Introduction and Business Overview
7.1.3 Schlumberger Vertical Rotary Steerable System Sales, Revenue, Price and Gross Margin (2021–2026)
7.1.4 Schlumberger Vertical Rotary Steerable System Product Offerings
7.1.5 Schlumberger Recent Developments
7.2 Baker Hughes
7.2.1 Baker Hughes Company Information
7.2.2 Baker Hughes Introduction and Business Overview
7.2.3 Baker Hughes Vertical Rotary Steerable System Sales, Revenue, Price and Gross Margin (2021–2026)
7.2.4 Baker Hughes Vertical Rotary Steerable System Product Offerings
7.2.5 Baker Hughes Recent Developments
7.3 Halliburton
7.3.1 Halliburton Company Information
7.3.2 Halliburton Introduction and Business Overview
7.3.3 Halliburton Vertical Rotary Steerable System Sales, Revenue, Price and Gross Margin (2021–2026)
7.3.4 Halliburton Vertical Rotary Steerable System Product Offerings
7.3.5 Halliburton Recent Developments
7.4 Weatherford
7.4.1 Weatherford Company Information
7.4.2 Weatherford Introduction and Business Overview
7.4.3 Weatherford Vertical Rotary Steerable System Sales, Revenue, Price and Gross Margin (2021–2026)
7.4.4 Weatherford Vertical Rotary Steerable System Product Offerings
7.4.5 Weatherford Recent Developments
7.5 National Oilwell Varco
7.5.1 National Oilwell Varco Company Information
7.5.2 National Oilwell Varco Introduction and Business Overview
7.5.3 National Oilwell Varco Vertical Rotary Steerable System Sales, Revenue, Price and Gross Margin (2021–2026)
7.5.4 National Oilwell Varco Vertical Rotary Steerable System Product Offerings
7.5.5 National Oilwell Varco Recent Developments
7.6 China Oilfield Services
7.6.1 China Oilfield Services Company Information
7.6.2 China Oilfield Services Introduction and Business Overview
7.6.3 China Oilfield Services Vertical Rotary Steerable System Sales, Revenue, Price and Gross Margin (2021–2026)
7.6.4 China Oilfield Services Vertical Rotary Steerable System Product Offerings
7.6.5 China Oilfield Services Recent Developments
7.7 Beijing Htwb Petroleum Technology
7.7.1 Beijing Htwb Petroleum Technology Company Information
7.7.2 Beijing Htwb Petroleum Technology Introduction and Business Overview
7.7.3 Beijing Htwb Petroleum Technology Vertical Rotary Steerable System Sales, Revenue, Price and Gross Margin (2021–2026)
7.7.4 Beijing Htwb Petroleum Technology Vertical Rotary Steerable System Product Offerings
7.7.5 Beijing Htwb Petroleum Technology Recent Developments
7.8 APS Technology
7.8.1 APS Technology Company Information
7.8.2 APS Technology Introduction and Business Overview
7.8.3 APS Technology Vertical Rotary Steerable System Sales, Revenue, Price and Gross Margin (2021–2026)
7.8.4 APS Technology Vertical Rotary Steerable System Product Offerings
7.8.5 APS Technology Recent Developments
7.9 Intrepid
7.9.1 Intrepid Company Information
7.9.2 Intrepid Introduction and Business Overview
7.9.3 Intrepid Vertical Rotary Steerable System Sales, Revenue, Price and Gross Margin (2021–2026)
7.9.4 Intrepid Vertical Rotary Steerable System Product Offerings
7.9.5 Intrepid Recent Developments
7.10 Scout Drilling Technologies
7.10.1 Scout Drilling Technologies Company Information
7.10.2 Scout Drilling Technologies Introduction and Business Overview
7.10.3 Scout Drilling Technologies Vertical Rotary Steerable System Sales, Revenue, Price and Gross Margin (2021–2026)
7.10.4 Scout Drilling Technologies Vertical Rotary Steerable System Product Offerings
7.10.5 Scout Drilling Technologies Recent Developments
7.11 Enteq Technologies
7.11.1 Enteq Technologies Company Information
7.11.2 Enteq Technologies Introduction and Business Overview
7.11.3 Enteq Technologies Vertical Rotary Steerable System Sales, Revenue, Price and Gross Margin (2021–2026)
7.11.4 Enteq Technologies Vertical Rotary Steerable System Product Offerings
7.11.5 Enteq Technologies Recent Developments
7.12 Turbo Drill Industries
7.12.1 Turbo Drill Industries Company Information
7.12.2 Turbo Drill Industries Introduction and Business Overview
7.12.3 Turbo Drill Industries Vertical Rotary Steerable System Sales, Revenue, Price and Gross Margin (2021–2026)
7.12.4 Turbo Drill Industries Vertical Rotary Steerable System Product Offerings
7.12.5 Turbo Drill Industries Recent Developments
7.13 Tartan Ecergy Tech
7.13.1 Tartan Ecergy Tech Company Information
7.13.2 Tartan Ecergy Tech Introduction and Business Overview
7.13.3 Tartan Ecergy Tech Vertical Rotary Steerable System Sales, Revenue, Price and Gross Margin (2021–2026)
7.13.4 Tartan Ecergy Tech Vertical Rotary Steerable System Product Offerings
7.13.5 Tartan Ecergy Tech Recent Developments
7.14 Kinetic Upstream Technologies
7.14.1 Kinetic Upstream Technologies Company Information
7.14.2 Kinetic Upstream Technologies Introduction and Business Overview
7.14.3 Kinetic Upstream Technologies Vertical Rotary Steerable System Sales, Revenue, Price and Gross Margin (2021–2026)
7.14.4 Kinetic Upstream Technologies Vertical Rotary Steerable System Product Offerings
7.14.5 Kinetic Upstream Technologies Recent Developments
7.15 Shandong Dingsheng Electromechanical Equipment
7.15.1 Shandong Dingsheng Electromechanical Equipment Company Information
7.15.2 Shandong Dingsheng Electromechanical Equipment Introduction and Business Overview
7.15.3 Shandong Dingsheng Electromechanical Equipment Vertical Rotary Steerable System Sales, Revenue, Price and Gross Margin (2021–2026)
7.15.4 Shandong Dingsheng Electromechanical Equipment Vertical Rotary Steerable System Product Offerings
7.15.5 Shandong Dingsheng Electromechanical Equipment Recent Developments
8 Industry Chain Analysis
8.1 Vertical Rotary Steerable System Industrial Chain
8.2 Vertical Rotary Steerable System Upstream Analysis
8.2.1 Key Raw Materials
8.2.2 Key Suppliers of Raw Materials
8.2.3 Manufacturing Cost Structure
8.3 Midstream Analysis
8.4 Downstream Analysis (Customer Analysis)
8.5 Sales Model and Sales Channelss
8.5.1 Vertical Rotary Steerable System Sales Model
8.5.2 Sales Channels
8.5.3 Vertical Rotary Steerable System Distributors
9 Research Findings and Conclusion
10 Appendix
10.1 Research Methodology
10.1.1 Methodology/Research Approach
10.1.1.1 Research Programs/Design
10.1.1.2 Market Size Estimation
10.1.1.3 Market Breakdown and Data Triangulation
10.1.2 Data Source
10.1.2.1 Secondary Sources
10.1.2.2 Primary Sources
10.2 Author Details
10.3 Disclaimer