List of Tables
Table 1. Global Silicone Sticky Bras Market Value by Type (US$ Million), 2025 vs 2032
Table 2. Global Silicone Sticky Bras Market Value by Bras Structural Design (US$ Million), 2025 vs 2032
Table 3. Global Silicone Sticky Bras Market Value by Silicone Bras Thickness (US$ Million), 2025 vs 2032
Table 4. Global Silicone Sticky Bras Market Value by Application (US$ Million), 2025 vs 2032
Table 5. Global Silicone Sticky Bras Market Competitive Situation by Manufacturers in 2025
Table 6. Global Silicone Sticky Bras Sales (K Units) of Key Manufacturers (2021–2026)
Table 7. Global Silicone Sticky Bras Sales Market Share by Manufacturers (2021–2026)
Table 8. Global Silicone Sticky Bras Revenue (US$ Million) by Manufacturers (2021–2026)
Table 9. Global Silicone Sticky Bras Revenue Share by Manufacturers (2021–2026)
Table 10. Global Market Silicone Sticky Bras Average Price (US$/Unit) of Key Manufacturers (2021–2026)
Table 11. Global Key Players of Silicone Sticky Bras, Industry Ranking, 2023 vs 2024 vs 2025
Table 12. Global Key Manufacturers of Silicone Sticky Bras, Manufacturing Sites and Headquarters
Table 13. Global Key Manufacturers of Silicone Sticky Bras, Product Types and Applications
Table 14. Global Key Manufacturers of Silicone Sticky Bras, Date of Entry into the Industry
Table 15. Global Manufacturers Market Concentration Ratio (CR5 and HHI)
Table 16. Global Silicone Sticky Bras Companies by Tier (Tier 1, Tier 2, Tier 3), based on Silicone Sticky Bras Revenue, 2025
Table 17. Manufacturers Mergers & Acquisitions, Expansion Plans
Table 18. Global Silicone Sticky Bras Market Size by Region (US$ Million): 2021 vs 2025 vs 2032
Table 19. Global Silicone Sticky Bras Sales by Region (K Units), 2021–2026
Table 20. Global Silicone Sticky Bras Sales Market Share by Region (2021–2026)
Table 21. Global Silicone Sticky Bras Sales by Region (K Units), 2027–2032
Table 22. Global Silicone Sticky Bras Sales Market Share by Region (2027–2032)
Table 23. Global Silicone Sticky Bras Revenue by Region (US$ Million), 2021–2026
Table 24. Global Silicone Sticky Bras Revenue Market Share by Region (2021–2026)
Table 25. Global Silicone Sticky Bras Revenue by Region (US$ Million), 2027–2032
Table 26. Global Silicone Sticky Bras Revenue Market Share by Region (2027–2032)
Table 27. North America Silicone Sticky Bras Revenue by Country: 2021 vs 2025 vs 2032 (US$ Million)
Table 28. North America Silicone Sticky Bras Sales by Country (K Units), 2021–2026
Table 29. North America Silicone Sticky Bras Sales by Country (K Units), 2027–2032
Table 30. North America Silicone Sticky Bras Revenue by Country (US$ Million), 2021–2026
Table 31. North America Silicone Sticky Bras Revenue by Country (US$ Million), 2027–2032
Table 32. Europe Silicone Sticky Bras Revenue by Country: 2021 vs 2025 vs 2032 (US$ Million)
Table 33. Europe Silicone Sticky Bras Sales by Country (K Units), 2021–2026
Table 34. Europe Silicone Sticky Bras Sales by Country (K Units), 2027–2032
Table 35. Europe Silicone Sticky Bras Revenue by Country (US$ Million), 2021–2026
Table 36. Europe Silicone Sticky Bras Revenue by Country (US$ Million), 2027–2032
Table 37. Asia Pacific Silicone Sticky Bras Revenue by Region: 2021 vs 2025 vs 2032 (US$ Million)
Table 38. Asia Pacific Silicone Sticky Bras Sales by Region (K Units), 2021–2026
Table 39. Asia Pacific Silicone Sticky Bras Sales by Region (K Units), 2027–2032
Table 40. Asia Pacific Silicone Sticky Bras Revenue by Region (US$ Million), 2021–2026
Table 41. Asia Pacific Silicone Sticky Bras Revenue by Region (US$ Million), 2027–2032
Table 42. Latin America Silicone Sticky Bras Revenue by Country: 2021 vs 2025 vs 2032 (US$ Million)
Table 43. Latin America Silicone Sticky Bras Sales by Country (K Units), 2021–2026
Table 44. Latin America Silicone Sticky Bras Sales by Country (K Units), 2027–2032
Table 45. Latin America Silicone Sticky Bras Revenue by Country (US$ Million), 2021–2026
Table 46. Latin America Silicone Sticky Bras Revenue by Country (US$ Million), 2027–2032
Table 47. Middle East and Africa Silicone Sticky Bras Revenue by Country: 2021 vs 2025 vs 2032 (US$ Million)
Table 48. Middle East and Africa Silicone Sticky Bras Sales by Country (K Units), 2021–2026
Table 49. Middle East and Africa Silicone Sticky Bras Sales by Country (K Units), 2027–2032
Table 50. Middle East and Africa Silicone Sticky Bras Revenue by Country (US$ Million), 2021–2026
Table 51. Middle East and Africa Silicone Sticky Bras Revenue by Country (US$ Million), 2027–2032
Table 52. Global Silicone Sticky Bras Sales (K Units) by Type (2021–2026)
Table 53. Global Silicone Sticky Bras Sales (K Units) by Type (2027–2032)
Table 54. Global Silicone Sticky Bras Sales Market Share by Type (2021–2026)
Table 55. Global Silicone Sticky Bras Sales Market Share by Type (2027–2032)
Table 56. Global Silicone Sticky Bras Revenue (US$ Million) by Type (2021–2026)
Table 57. Global Silicone Sticky Bras Revenue (US$ Million) by Type (2027–2032)
Table 58. Global Silicone Sticky Bras Revenue Market Share by Type (2021–2026)
Table 59. Global Silicone Sticky Bras Revenue Market Share by Type (2027–2032)
Table 60. Global Silicone Sticky Bras Price (US$/Unit) by Type (2021–2026)
Table 61. Global Silicone Sticky Bras Price (US$/Unit) by Type (2027–2032)
Table 62. Global Silicone Sticky Bras Sales (K Units) by Application (2021–2026)
Table 63. Global Silicone Sticky Bras Sales (K Units) by Application (2027–2032)
Table 64. Global Silicone Sticky Bras Sales Market Share by Application (2021–2026)
Table 65. Global Silicone Sticky Bras Sales Market Share by Application (2027–2032)
Table 66. Global Silicone Sticky Bras Revenue (US$ Million) by Application (2021–2026)
Table 67. Global Silicone Sticky Bras Revenue (US$ Million) by Application (2027–2032)
Table 68. Global Silicone Sticky Bras Revenue Market Share by Application (2021–2026)
Table 69. Global Silicone Sticky Bras Revenue Market Share by Application (2027–2032)
Table 70. Global Silicone Sticky Bras Price (US$/Unit) by Application (2021–2026)
Table 71. Global Silicone Sticky Bras Price (US$/Unit) by Application (2027–2032)
Table 72. BYE BRA BV Company Information
Table 73. BYE BRA BV Description and Business Overview
Table 74. BYE BRA BV Silicone Sticky Bras Sales (K Units), Revenue (US$ Million), Price (US$/Unit), and Gross Margin (2021–2026)
Table 75. BYE BRA BV Silicone Sticky Bras Product
Table 76. BYE BRA BV Recent Developments/Updates
Table 77. nubra Company Information
Table 78. nubra Description and Business Overview
Table 79. nubra Silicone Sticky Bras Sales (K Units), Revenue (US$ Million), Price (US$/Unit), and Gross Margin (2021–2026)
Table 80. nubra Silicone Sticky Bras Product
Table 81. nubra Recent Developments/Updates
Table 82. ubras Company Information
Table 83. ubras Description and Business Overview
Table 84. ubras Silicone Sticky Bras Sales (K Units), Revenue (US$ Million), Price (US$/Unit), and Gross Margin (2021–2026)
Table 85. ubras Silicone Sticky Bras Product
Table 86. ubras Recent Developments/Updates
Table 87. Cosmo Lady (China) Holdings Company Limited Company Information
Table 88. Cosmo Lady (China) Holdings Company Limited Description and Business Overview
Table 89. Cosmo Lady (China) Holdings Company Limited Silicone Sticky Bras Sales (K Units), Revenue (US$ Million), Price (US$/Unit), and Gross Margin (2021–2026)
Table 90. Cosmo Lady (China) Holdings Company Limited Silicone Sticky Bras Product
Table 91. Cosmo Lady (China) Holdings Company Limited Recent Developments/Updates
Table 92. Aimer Company Information
Table 93. Aimer Description and Business Overview
Table 94. Aimer Silicone Sticky Bras Sales (K Units), Revenue (US$ Million), Price (US$/Unit), and Gross Margin (2021–2026)
Table 95. Aimer Silicone Sticky Bras Product
Table 96. Aimer Recent Developments/Updates
Table 97. 6IXTY8IGHT Company Information
Table 98. 6IXTY8IGHT Description and Business Overview
Table 99. 6IXTY8IGHT Silicone Sticky Bras Sales (K Units), Revenue (US$ Million), Price (US$/Unit), and Gross Margin (2021–2026)
Table 100. 6IXTY8IGHT Silicone Sticky Bras Product
Table 101. 6IXTY8IGHT Recent Developments/Updates
Table 102. youkeshu Company Information
Table 103. youkeshu Description and Business Overview
Table 104. youkeshu Silicone Sticky Bras Sales (K Units), Revenue (US$ Million), Price (US$/Unit), and Gross Margin (2021–2026)
Table 105. youkeshu Silicone Sticky Bras Product
Table 106. youkeshu Recent Developments/Updates
Table 107. LUCKMEEY Company Information
Table 108. LUCKMEEY Description and Business Overview
Table 109. LUCKMEEY Silicone Sticky Bras Sales (K Units), Revenue (US$ Million), Price (US$/Unit), and Gross Margin (2021–2026)
Table 110. LUCKMEEY Silicone Sticky Bras Product
Table 111. LUCKMEEY Recent Developments/Updates
Table 112. Boux Avenue Company Information
Table 113. Boux Avenue Description and Business Overview
Table 114. Boux Avenue Silicone Sticky Bras Sales (K Units), Revenue (US$ Million), Price (US$/Unit), and Gross Margin (2021–2026)
Table 115. Boux Avenue Silicone Sticky Bras Product
Table 116. Boux Avenue Recent Developments/Updates
Table 117. New Look Company Information
Table 118. New Look Description and Business Overview
Table 119. New Look Silicone Sticky Bras Sales (K Units), Revenue (US$ Million), Price (US$/Unit), and Gross Margin (2021–2026)
Table 120. New Look Silicone Sticky Bras Product
Table 121. New Look Recent Developments/Updates
Table 122. Victoria's Secret Company Information
Table 123. Victoria's Secret Description and Business Overview
Table 124. Victoria's Secret Silicone Sticky Bras Sales (K Units), Revenue (US$ Million), Price (US$/Unit), and Gross Margin (2021–2026)
Table 125. Victoria's Secret Silicone Sticky Bras Product
Table 126. Victoria's Secret Recent Developments/Updates
Table 127. Amorlady Company Information
Table 128. Amorlady Description and Business Overview
Table 129. Amorlady Silicone Sticky Bras Sales (K Units), Revenue (US$ Million), Price (US$/Unit), and Gross Margin (2021–2026)
Table 130. Amorlady Silicone Sticky Bras Product
Table 131. Amorlady Recent Developments/Updates
Table 132. Vanztina Company Information
Table 133. Vanztina Description and Business Overview
Table 134. Vanztina Silicone Sticky Bras Sales (K Units), Revenue (US$ Million), Price (US$/Unit), and Gross Margin (2021–2026)
Table 135. Vanztina Silicone Sticky Bras Product
Table 136. Vanztina Recent Developments/Updates
Table 137. Guangzhou Xinke Silicone Products Co., Ltd., Company Information
Table 138. Guangzhou Xinke Silicone Products Co., Ltd., Description and Business Overview
Table 139. Guangzhou Xinke Silicone Products Co., Ltd., Silicone Sticky Bras Sales (K Units), Revenue (US$ Million), Price (US$/Unit), and Gross Margin (2021–2026)
Table 140. Guangzhou Xinke Silicone Products Co., Ltd., Silicone Sticky Bras Product
Table 141. Guangzhou Xinke Silicone Products Co., Ltd., Recent Developments/Updates
Table 142. EmbryForm Company Information
Table 143. EmbryForm Description and Business Overview
Table 144. EmbryForm Silicone Sticky Bras Sales (K Units), Revenue (US$ Million), Price (US$/Unit), and Gross Margin (2021–2026)
Table 145. EmbryForm Silicone Sticky Bras Product
Table 146. EmbryForm Recent Developments/Updates
Table 147. Wacoal Company Information
Table 148. Wacoal Description and Business Overview
Table 149. Wacoal Silicone Sticky Bras Sales (K Units), Revenue (US$ Million), Price (US$/Unit), and Gross Margin (2021–2026)
Table 150. Wacoal Silicone Sticky Bras Product
Table 151. Wacoal Recent Developments/Updates
Table 152. Intimissimi Company Information
Table 153. Intimissimi Description and Business Overview
Table 154. Intimissimi Silicone Sticky Bras Sales (K Units), Revenue (US$ Million), Price (US$/Unit), and Gross Margin (2021–2026)
Table 155. Intimissimi Silicone Sticky Bras Product
Table 156. Intimissimi Recent Developments/Updates
Table 157. EVE'S TEMPTATION Company Information
Table 158. EVE'S TEMPTATION Description and Business Overview
Table 159. EVE'S TEMPTATION Silicone Sticky Bras Sales (K Units), Revenue (US$ Million), Price (US$/Unit), and Gross Margin (2021–2026)
Table 160. EVE'S TEMPTATION Silicone Sticky Bras Product
Table 161. EVE'S TEMPTATION Recent Developments/Updates
Table 162. Miiow Company Information
Table 163. Miiow Description and Business Overview
Table 164. Miiow Silicone Sticky Bras Sales (K Units), Revenue (US$ Million), Price (US$/Unit), and Gross Margin (2021–2026)
Table 165. Miiow Silicone Sticky Bras Product
Table 166. Miiow Recent Developments/Updates
Table 167. Niibor Company Information
Table 168. Niibor Description and Business Overview
Table 169. Niibor Silicone Sticky Bras Sales (K Units), Revenue (US$ Million), Price (US$/Unit), and Gross Margin (2021–2026)
Table 170. Niibor Silicone Sticky Bras Product
Table 171. Niibor Recent Developments/Updates
Table 172. NOOD Company Information
Table 173. NOOD Description and Business Overview
Table 174. NOOD Silicone Sticky Bras Sales (K Units), Revenue (US$ Million), Price (US$/Unit), and Gross Margin (2021–2026)
Table 175. NOOD Silicone Sticky Bras Product
Table 176. NOOD Recent Developments/Updates
Table 177. GORTEKS Company Information
Table 178. GORTEKS Description and Business Overview
Table 179. GORTEKS Silicone Sticky Bras Sales (K Units), Revenue (US$ Million), Price (US$/Unit), and Gross Margin (2021–2026)
Table 180. GORTEKS Silicone Sticky Bras Product
Table 181. GORTEKS Recent Developments/Updates
Table 182. LangSha Company Information
Table 183. LangSha Description and Business Overview
Table 184. LangSha Silicone Sticky Bras Sales (K Units), Revenue (US$ Million), Price (US$/Unit), and Gross Margin (2021–2026)
Table 185. LangSha Silicone Sticky Bras Product
Table 186. LangSha Recent Developments/Updates
Table 187. Vstylebra Company Information
Table 188. Vstylebra Description and Business Overview
Table 189. Vstylebra Silicone Sticky Bras Sales (K Units), Revenue (US$ Million), Price (US$/Unit), and Gross Margin (2021–2026)
Table 190. Vstylebra Silicone Sticky Bras Product
Table 191. Vstylebra Recent Developments/Updates
Table 192. Niidor Company Information
Table 193. Niidor Description and Business Overview
Table 194. Niidor Silicone Sticky Bras Sales (K Units), Revenue (US$ Million), Price (US$/Unit), and Gross Margin (2021–2026)
Table 195. Niidor Silicone Sticky Bras Product
Table 196. Niidor Recent Developments/Updates
Table 197. Key Raw Materials Lists
Table 198. Raw Materials Key Suppliers Lists
Table 199. Silicone Sticky Bras Distributors List
Table 200. Silicone Sticky Bras Customers List
Table 201. Silicone Sticky Bras Market Trends
Table 202. Silicone Sticky Bras Market Drivers
Table 203. Silicone Sticky Bras Market Challenges
Table 204. Silicone Sticky Bras Market Restraints
Table 205. Research Programs/Design for This Report
Table 206. Key Data Information from Secondary Sources
Table 207. Key Data Information from Primary Sources
Table 208. Authors List of This Report
List of Figures
Figure 1. Product Picture of Silicone Sticky Bras
Figure 2. Global Silicone Sticky Bras Market Value by Type (US$ Million), 2021–2032
Figure 3. Global Silicone Sticky Bras Market Share by Type: 2025 & 2032
Figure 4. Reusable Product Picture
Figure 5. Single-use Product Picture
Figure 6. Global Silicone Sticky Bras Market Value by Bras Structural Design (US$ Million), 2021–2032
Figure 7. Global Silicone Sticky Bras Market Share by Bras Structural Design: 2025 vs 2032
Figure 8. Split Cup Style Product Picture
Figure 9. One-piece Cup Style Product Picture
Figure 10. Global Silicone Sticky Bras Market Value by Silicone Bras Thickness (US$ Million), 2021–2032
Figure 11. Global Silicone Sticky Bras Market Share by Silicone Bras Thickness: 2025 vs 2032
Figure 12. Thin Style (≤2mm) Product Picture
Figure 13. Medium Thickness Style (2–5mm) Product Picture
Figure 14. Thick Style (≥5mm) Product Picture
Figure 15. Global Silicone Sticky Bras Market Value by Application (US$ Million), 2021–2032
Figure 16. Global Silicone Sticky Bras Market Share by Application: 2025 & 2032
Figure 17. Online Sales
Figure 18. Offline Sales
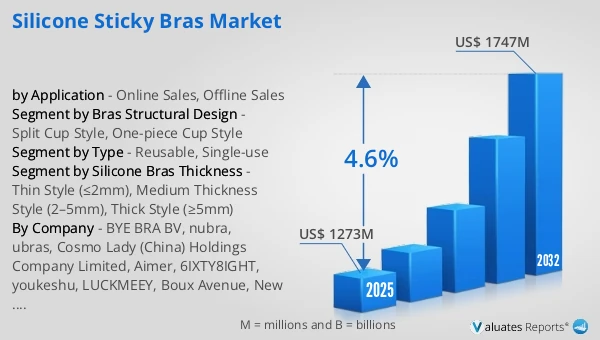
Figure 19. Global Silicone Sticky Bras Revenue, (US$ Million), 2021 vs 2025 vs 2032
Figure 20. Global Silicone Sticky Bras Market Size (US$ Million), 2021–2032
Figure 21. Global Silicone Sticky Bras Sales (K Units), 2021–2032
Figure 22. Global Silicone Sticky Bras Average Price (US$/Unit), 2021–2032
Figure 23. Silicone Sticky Bras Report Years Considered
Figure 24. Silicone Sticky Bras Sales Share by Manufacturers in 2025
Figure 25. Global Silicone Sticky Bras Revenue Share by Manufacturers in 2025
Figure 26. Top 5 and Top 10 Global Silicone Sticky Bras Players: Market Share by Revenue in Silicone Sticky Bras in 2025
Figure 27. Silicone Sticky Bras Market Share by Company Type (Tier 1, Tier 2, and Tier 3): 2021 vs 2025
Figure 28. Global Silicone Sticky Bras Market Size by Region (US$ Million): 2021 vs 2025 vs 2032
Figure 29. North America Silicone Sticky Bras Sales Market Share by Country (2021–2032)
Figure 30. North America Silicone Sticky Bras Revenue Market Share by Country (2021–2032)
Figure 31. United States Silicone Sticky Bras Revenue Growth Rate (US$ Million), 2021–2032
Figure 32. Canada Silicone Sticky Bras Revenue Growth Rate (US$ Million), 2021–2032
Figure 33. Europe Silicone Sticky Bras Sales Market Share by Country (2021–2032)
Figure 34. Europe Silicone Sticky Bras Revenue Market Share by Country (2021–2032)
Figure 35. Germany Silicone Sticky Bras Revenue Growth Rate (US$ Million), 2021–2032
Figure 36. France Silicone Sticky Bras Revenue Growth Rate (US$ Million), 2021–2032
Figure 37. U.K. Silicone Sticky Bras Revenue Growth Rate (US$ Million), 2021–2032
Figure 38. Italy Silicone Sticky Bras Revenue Growth Rate (US$ Million), 2021–2032
Figure 39. Russia Silicone Sticky Bras Revenue Growth Rate (US$ Million), 2021–2032
Figure 40. Asia Pacific Silicone Sticky Bras Sales Market Share by Region (2021–2032)
Figure 41. Asia Pacific Silicone Sticky Bras Revenue Market Share by Region (2021–2032)
Figure 42. China Silicone Sticky Bras Revenue Growth Rate (US$ Million), 2021–2032
Figure 43. Japan Silicone Sticky Bras Revenue Growth Rate (US$ Million), 2021–2032
Figure 44. South Korea Silicone Sticky Bras Revenue Growth Rate (US$ Million), 2021–2032
Figure 45. India Silicone Sticky Bras Revenue Growth Rate (US$ Million), 2021–2032
Figure 46. Australia Silicone Sticky Bras Revenue Growth Rate (US$ Million), 2021–2032
Figure 47. China Taiwan Silicone Sticky Bras Revenue Growth Rate (US$ Million), 2021–2032
Figure 48. Southeast Asia Silicone Sticky Bras Revenue Growth Rate (US$ Million), 2021–2032
Figure 49. Latin America Silicone Sticky Bras Sales Market Share by Country (2021–2032)
Figure 50. Latin America Silicone Sticky Bras Revenue Market Share by Country (2021–2032)
Figure 51. Mexico Silicone Sticky Bras Revenue Growth Rate (US$ Million), 2021–2032
Figure 52. Brazil Silicone Sticky Bras Revenue Growth Rate (US$ Million), 2021–2032
Figure 53. Argentina Silicone Sticky Bras Revenue Growth Rate (US$ Million), 2021–2032
Figure 54. Colombia Silicone Sticky Bras Revenue Growth Rate (US$ Million), 2021–2032
Figure 55. Middle East and Africa Silicone Sticky Bras Sales Market Share by Country (2021–2032)
Figure 56. Middle East and Africa Silicone Sticky Bras Revenue Market Share by Country (2021–2032)
Figure 57. Turkey Silicone Sticky Bras Revenue Growth Rate (US$ Million), 2021–2032
Figure 58. Saudi Arabia Silicone Sticky Bras Revenue Growth Rate (US$ Million), 2021–2032
Figure 59. UAE Silicone Sticky Bras Revenue Growth Rate (US$ Million), 2021–2032
Figure 60. Global Sales Market Share of Silicone Sticky Bras by Type (2021–2032)
Figure 61. Global Revenue Market Share of Silicone Sticky Bras by Type (2021–2032)
Figure 62. Global Silicone Sticky Bras Price (US$/Unit) by Type (2021–2032)
Figure 63. Global Sales Market Share of Silicone Sticky Bras by Application (2021–2032)
Figure 64. Global Revenue Market Share of Silicone Sticky Bras by Application (2021–2032)
Figure 65. Global Silicone Sticky Bras Price (US$/Unit) by Application (2021–2032)
Figure 66. Silicone Sticky Bras Value Chain
Figure 67. Channels of Distribution (Direct Vs Distribution)
Figure 68. Bottom-up and Top-down Approaches for This Report
Figure 69. Data Triangulation
Figure 70. Key Executives Interviewed