List of Tables
Table 1. Global Computer-aided Facility Management (CAFM) Market Size Growth Rate by Type (US$ Million): 2021 vs 2025 vs 2032
Table 2. Key Players of Cloud Based
Table 3. Key Players of On-Premises
Table 4. Global Computer-aided Facility Management (CAFM) Market Size Growth Rate by Primary Workflow Focus (US$ Million): 2021 vs 2025 vs 2032
Table 5. Key Players of Space And Workplace Management
Table 6. Key Players of Maintenance Work Order Management
Table 7. Key Players of Asset Registry And Lifecycle Management
Table 8. Key Players of Others
Table 9. Global Computer-aided Facility Management (CAFM) Market Size Growth Rate by Target Facility Complexity (US$ Million): 2021 vs 2025 vs 2032
Table 10. Key Players of Multi Site Campus
Table 11. Key Players of Single Site Large Facility
Table 12. Key Players of Small And Medium Facility
Table 13. Key Players of Others
Table 14. Global Computer-aided Facility Management (CAFM) Market Size Growth Rate by Buyer Organization Size (US$ Million): 2021 vs 2025 vs 2032
Table 15. Key Players of Upper Mid Market
Table 16. Key Players of Small And Medium Business
Table 17. Global Computer-aided Facility Management (CAFM) Market Size Growth by Application (US$ Million): 2021 vs 2025 vs 2032
Table 18. Global Computer-aided Facility Management (CAFM) Market Size by Region (US$ Million): 2021 vs 2025 vs 2032
Table 19. Global Computer-aided Facility Management (CAFM) Market Size by Region (US$ Million), 2021–2026
Table 20. Global Computer-aided Facility Management (CAFM) Market Share by Region (2021–2026)
Table 21. Global Computer-aided Facility Management (CAFM) Forecasted Market Size by Region (US$ Million), 2027–2032
Table 22. Global Computer-aided Facility Management (CAFM) Market Share by Region (2027–2032)
Table 23. Computer-aided Facility Management (CAFM) Market Trends
Table 24. Computer-aided Facility Management (CAFM) Market Drivers
Table 25. Computer-aided Facility Management (CAFM) Market Challenges
Table 26. Computer-aided Facility Management (CAFM) Market Restraints
Table 27. Global Computer-aided Facility Management (CAFM) Revenue by Players (US$ Million), 2021–2026
Table 28. Global Computer-aided Facility Management (CAFM) Market Share by Players (2021–2026)
Table 29. Global Top Computer-aided Facility Management (CAFM) Players by Tier (Tier 1, Tier 2, and Tier 3), based on Computer-aided Facility Management (CAFM) Revenue, 2025
Table 30. Ranking of Global Top Computer-aided Facility Management (CAFM) Companies by Revenue (US$ Million) in 2025
Table 31. Global 5 Largest Players Market Share by Computer-aided Facility Management (CAFM) Revenue (CR5 and HHI), 2021–2026
Table 32. Global Key Players of Computer-aided Facility Management (CAFM), Headquarters and Area Served
Table 33. Global Key Players of Computer-aided Facility Management (CAFM), Products and Applications
Table 34. Global Key Players of Computer-aided Facility Management (CAFM), Date of General Availability (GA)
Table 35. Mergers and Acquisitions, Expansion Plans
Table 36. Global Computer-aided Facility Management (CAFM) Market Size by Type (US$ Million), 2021–2026
Table 37. Global Computer-aided Facility Management (CAFM) Revenue Market Share by Type (2021–2026)
Table 38. Global Computer-aided Facility Management (CAFM) Forecasted Market Size by Type (US$ Million), 2027–2032
Table 39. Global Computer-aided Facility Management (CAFM) Revenue Market Share by Type (2027–2032)
Table 40. Global Computer-aided Facility Management (CAFM) Market Size by Application (US$ Million), 2021–2026
Table 41. Global Computer-aided Facility Management (CAFM) Revenue Market Share by Application (2021–2026)
Table 42. Global Computer-aided Facility Management (CAFM) Forecasted Market Size by Application (US$ Million), 2027–2032
Table 43. Global Computer-aided Facility Management (CAFM) Revenue Market Share by Application (2027–2032)
Table 44. North America Computer-aided Facility Management (CAFM) Market Size Growth Rate by Country (US$ Million): 2021 vs 2025 vs 2032
Table 45. North America Computer-aided Facility Management (CAFM) Market Size by Country (US$ Million), 2021–2026
Table 46. North America Computer-aided Facility Management (CAFM) Market Size by Country (US$ Million), 2027–2032
Table 47. Europe Computer-aided Facility Management (CAFM) Market Size Growth Rate by Country (US$ Million): 2021 vs 2025 vs 2032
Table 48. Europe Computer-aided Facility Management (CAFM) Market Size by Country (US$ Million), 2021–2026
Table 49. Europe Computer-aided Facility Management (CAFM) Market Size by Country (US$ Million), 2027–2032
Table 50. Asia-Pacific Computer-aided Facility Management (CAFM) Market Size Growth Rate by Region (US$ Million): 2021 vs 2025 vs 2032
Table 51. Asia-Pacific Computer-aided Facility Management (CAFM) Market Size by Region (US$ Million), 2021–2026
Table 52. Asia-Pacific Computer-aided Facility Management (CAFM) Market Size by Region (US$ Million), 2027–2032
Table 53. Latin America Computer-aided Facility Management (CAFM) Market Size Growth Rate by Country (US$ Million): 2021 vs 2025 vs 2032
Table 54. Latin America Computer-aided Facility Management (CAFM) Market Size by Country (US$ Million), 2021–2026
Table 55. Latin America Computer-aided Facility Management (CAFM) Market Size by Country (US$ Million), 2027–2032
Table 56. Middle East & Africa Computer-aided Facility Management (CAFM) Market Size Growth Rate by Country (US$ Million): 2021 vs 2025 vs 2032
Table 57. Middle East & Africa Computer-aided Facility Management (CAFM) Market Size by Country (US$ Million), 2021–2026
Table 58. Middle East & Africa Computer-aided Facility Management (CAFM) Market Size by Country (US$ Million), 2027–2032
Table 59. Planon Company Details
Table 60. Planon Business Overview
Table 61. Planon Computer-aided Facility Management (CAFM) Product
Table 62. Planon Revenue in Computer-aided Facility Management (CAFM) Business (US$ Million), 2021–2026
Table 63. Planon Recent Development
Table 64. MRI Software LLC Company Details
Table 65. MRI Software LLC Business Overview
Table 66. MRI Software LLC Computer-aided Facility Management (CAFM) Product
Table 67. MRI Software LLC Revenue in Computer-aided Facility Management (CAFM) Business (US$ Million), 2021–2026
Table 68. MRI Software LLC Recent Development
Table 69. IBM Company Details
Table 70. IBM Business Overview
Table 71. IBM Computer-aided Facility Management (CAFM) Product
Table 72. IBM Revenue in Computer-aided Facility Management (CAFM) Business (US$ Million), 2021–2026
Table 73. IBM Recent Development
Table 74. Eptura, Inc. Company Details
Table 75. Eptura, Inc. Business Overview
Table 76. Eptura, Inc. Computer-aided Facility Management (CAFM) Product
Table 77. Eptura, Inc. Revenue in Computer-aided Facility Management (CAFM) Business (US$ Million), 2021–2026
Table 78. Eptura, Inc. Recent Development
Table 79. Fortive Corporation (Accruent) Company Details
Table 80. Fortive Corporation (Accruent) Business Overview
Table 81. Fortive Corporation (Accruent) Computer-aided Facility Management (CAFM) Product
Table 82. Fortive Corporation (Accruent) Revenue in Computer-aided Facility Management (CAFM) Business (US$ Million), 2021–2026
Table 83. Fortive Corporation (Accruent) Recent Development
Table 84. Johnson Controls International plc (FM:Systems) Company Details
Table 85. Johnson Controls International plc (FM:Systems) Business Overview
Table 86. Johnson Controls International plc (FM:Systems) Computer-aided Facility Management (CAFM) Product
Table 87. Johnson Controls International plc (FM:Systems) Revenue in Computer-aided Facility Management (CAFM) Business (US$ Million), 2021–2026
Table 88. Johnson Controls International plc (FM:Systems) Recent Development
Table 89. Nemetschek Group (Spacewell) Company Details
Table 90. Nemetschek Group (Spacewell) Business Overview
Table 91. Nemetschek Group (Spacewell) Computer-aided Facility Management (CAFM) Product
Table 92. Nemetschek Group (Spacewell) Revenue in Computer-aided Facility Management (CAFM) Business (US$ Million), 2021–2026
Table 93. Nemetschek Group (Spacewell) Recent Development
Table 94. SAP SE Company Details
Table 95. SAP SE Business Overview
Table 96. SAP SE Computer-aided Facility Management (CAFM) Product
Table 97. SAP SE Revenue in Computer-aided Facility Management (CAFM) Business (US$ Million), 2021–2026
Table 98. SAP SE Recent Development
Table 99. Yardi Systems, Inc. Company Details
Table 100. Yardi Systems, Inc. Business Overview
Table 101. Yardi Systems, Inc. Computer-aided Facility Management (CAFM) Product
Table 102. Yardi Systems, Inc. Revenue in Computer-aided Facility Management (CAFM) Business (US$ Million), 2021–2026
Table 103. Yardi Systems, Inc. Recent Development
Table 104. FSI (FM Solutions) Limited Company Details
Table 105. FSI (FM Solutions) Limited Business Overview
Table 106. FSI (FM Solutions) Limited Computer-aided Facility Management (CAFM) Product
Table 107. FSI (FM Solutions) Limited Revenue in Computer-aided Facility Management (CAFM) Business (US$ Million), 2021–2026
Table 108. FSI (FM Solutions) Limited Recent Development
Table 109. Service Works Global Ltd Company Details
Table 110. Service Works Global Ltd Business Overview
Table 111. Service Works Global Ltd Computer-aided Facility Management (CAFM) Product
Table 112. Service Works Global Ltd Revenue in Computer-aided Facility Management (CAFM) Business (US$ Million), 2021–2026
Table 113. Service Works Global Ltd Recent Development
Table 114. JLL (Building Engines) Company Details
Table 115. JLL (Building Engines) Business Overview
Table 116. JLL (Building Engines) Computer-aided Facility Management (CAFM) Product
Table 117. JLL (Building Engines) Revenue in Computer-aided Facility Management (CAFM) Business (US$ Million), 2021–2026
Table 118. JLL (Building Engines) Recent Development
Table 119. Siemens Smart Infrastructure (Brightly Software) Company Details
Table 120. Siemens Smart Infrastructure (Brightly Software) Business Overview
Table 121. Siemens Smart Infrastructure (Brightly Software) Computer-aided Facility Management (CAFM) Product
Table 122. Siemens Smart Infrastructure (Brightly Software) Revenue in Computer-aided Facility Management (CAFM) Business (US$ Million), 2021–2026
Table 123. Siemens Smart Infrastructure (Brightly Software) Recent Development
Table 124. Valsoft Corporation (DPSI) Company Details
Table 125. Valsoft Corporation (DPSI) Business Overview
Table 126. Valsoft Corporation (DPSI) Computer-aided Facility Management (CAFM) Product
Table 127. Valsoft Corporation (DPSI) Revenue in Computer-aided Facility Management (CAFM) Business (US$ Million), 2021–2026
Table 128. Valsoft Corporation (DPSI) Recent Development
Table 129. Fluke Reliability (eMaint) Company Details
Table 130. Fluke Reliability (eMaint) Business Overview
Table 131. Fluke Reliability (eMaint) Computer-aided Facility Management (CAFM) Product
Table 132. Fluke Reliability (eMaint) Revenue in Computer-aided Facility Management (CAFM) Business (US$ Million), 2021–2026
Table 133. Fluke Reliability (eMaint) Recent Development
Table 134. IFS Company Details
Table 135. IFS Business Overview
Table 136. IFS Computer-aided Facility Management (CAFM) Product
Table 137. IFS Revenue in Computer-aided Facility Management (CAFM) Business (US$ Million), 2021–2026
Table 138. IFS Recent Development
Table 139. Rockwell Automation (Fiix) Company Details
Table 140. Rockwell Automation (Fiix) Business Overview
Table 141. Rockwell Automation (Fiix) Computer-aided Facility Management (CAFM) Product
Table 142. Rockwell Automation (Fiix) Revenue in Computer-aided Facility Management (CAFM) Business (US$ Million), 2021–2026
Table 143. Rockwell Automation (Fiix) Recent Development
Table 144. FMX Company Details
Table 145. FMX Business Overview
Table 146. FMX Computer-aided Facility Management (CAFM) Product
Table 147. FMX Revenue in Computer-aided Facility Management (CAFM) Business (US$ Million), 2021–2026
Table 148. FMX Recent Development
Table 149. UpKeep Company Details
Table 150. UpKeep Business Overview
Table 151. UpKeep Computer-aided Facility Management (CAFM) Product
Table 152. UpKeep Revenue in Computer-aided Facility Management (CAFM) Business (US$ Million), 2021–2026
Table 153. UpKeep Recent Development
Table 154. MVP One Company Details
Table 155. MVP One Business Overview
Table 156. MVP One Computer-aided Facility Management (CAFM) Product
Table 157. MVP One Revenue in Computer-aided Facility Management (CAFM) Business (US$ Million), 2021–2026
Table 158. MVP One Recent Development
Table 159. FasTrak SoftWorks, Inc. (FTMaintenance) Company Details
Table 160. FasTrak SoftWorks, Inc. (FTMaintenance) Business Overview
Table 161. FasTrak SoftWorks, Inc. (FTMaintenance) Computer-aided Facility Management (CAFM) Product
Table 162. FasTrak SoftWorks, Inc. (FTMaintenance) Revenue in Computer-aided Facility Management (CAFM) Business (US$ Million), 2021–2026
Table 163. FasTrak SoftWorks, Inc. (FTMaintenance) Recent Development
Table 164. JDM Technology Group (MPulse / MicroMain) Company Details
Table 165. JDM Technology Group (MPulse / MicroMain) Business Overview
Table 166. JDM Technology Group (MPulse / MicroMain) Computer-aided Facility Management (CAFM) Product
Table 167. JDM Technology Group (MPulse / MicroMain) Revenue in Computer-aided Facility Management (CAFM) Business (US$ Million), 2021–2026
Table 168. JDM Technology Group (MPulse / MicroMain) Recent Development
Table 169. Glodon Company Limited Company Details
Table 170. Glodon Company Limited Business Overview
Table 171. Glodon Company Limited Computer-aided Facility Management (CAFM) Product
Table 172. Glodon Company Limited Revenue in Computer-aided Facility Management (CAFM) Business (US$ Million), 2021–2026
Table 173. Glodon Company Limited Recent Development
Table 174. Hangzhou Hikvision Digital Technology Co., Ltd. Company Details
Table 175. Hangzhou Hikvision Digital Technology Co., Ltd. Business Overview
Table 176. Hangzhou Hikvision Digital Technology Co., Ltd. Computer-aided Facility Management (CAFM) Product
Table 177. Hangzhou Hikvision Digital Technology Co., Ltd. Revenue in Computer-aided Facility Management (CAFM) Business (US$ Million), 2021–2026
Table 178. Hangzhou Hikvision Digital Technology Co., Ltd. Recent Development
Table 179. Huawei Technologies Co., Ltd. Company Details
Table 180. Huawei Technologies Co., Ltd. Business Overview
Table 181. Huawei Technologies Co., Ltd. Computer-aided Facility Management (CAFM) Product
Table 182. Huawei Technologies Co., Ltd. Revenue in Computer-aided Facility Management (CAFM) Business (US$ Million), 2021–2026
Table 183. Huawei Technologies Co., Ltd. Recent Development
Table 184. Nanjing DeepControl Technology Co., Ltd. Company Details
Table 185. Nanjing DeepControl Technology Co., Ltd. Business Overview
Table 186. Nanjing DeepControl Technology Co., Ltd. Computer-aided Facility Management (CAFM) Product
Table 187. Nanjing DeepControl Technology Co., Ltd. Revenue in Computer-aided Facility Management (CAFM) Business (US$ Million), 2021–2026
Table 188. Nanjing DeepControl Technology Co., Ltd. Recent Development
Table 189. Vanjian (FBIM) Company Details
Table 190. Vanjian (FBIM) Business Overview
Table 191. Vanjian (FBIM) Computer-aided Facility Management (CAFM) Product
Table 192. Vanjian (FBIM) Revenue in Computer-aided Facility Management (CAFM) Business (US$ Million), 2021–2026
Table 193. Vanjian (FBIM) Recent Development
Table 194. DBEST Facility Management Co., Ltd. Company Details
Table 195. DBEST Facility Management Co., Ltd. Business Overview
Table 196. DBEST Facility Management Co., Ltd. Computer-aided Facility Management (CAFM) Product
Table 197. DBEST Facility Management Co., Ltd. Revenue in Computer-aided Facility Management (CAFM) Business (US$ Million), 2021–2026
Table 198. DBEST Facility Management Co., Ltd. Recent Development
Table 199. DataMesh Company Details
Table 200. DataMesh Business Overview
Table 201. DataMesh Computer-aided Facility Management (CAFM) Product
Table 202. DataMesh Revenue in Computer-aided Facility Management (CAFM) Business (US$ Million), 2021–2026
Table 203. DataMesh Recent Development
Table 204. Xiamen Hightopo Software Technology Co., Ltd. Company Details
Table 205. Xiamen Hightopo Software Technology Co., Ltd. Business Overview
Table 206. Xiamen Hightopo Software Technology Co., Ltd. Computer-aided Facility Management (CAFM) Product
Table 207. Xiamen Hightopo Software Technology Co., Ltd. Revenue in Computer-aided Facility Management (CAFM) Business (US$ Million), 2021–2026
Table 208. Xiamen Hightopo Software Technology Co., Ltd. Recent Development
Table 209. Research Programs/Design for This Report
Table 210. Key Data Information from Secondary Sources
Table 211. Key Data Information from Primary Sources
Table 212. Authors List of This Report
List of Figures
Figure 1. Computer-aided Facility Management (CAFM) Picture
Figure 2. Global Computer-aided Facility Management (CAFM) Market Size Comparison by Type (US$ Million), 2021–2032
Figure 3. Global Computer-aided Facility Management (CAFM) Market Share by Type: 2025 vs 2032
Figure 4. Cloud Based Features
Figure 5. On-Premises Features
Figure 6. Global Computer-aided Facility Management (CAFM) Market Size Comparison by Primary Workflow Focus (US$ Million), 2021–2032
Figure 7. Space And Workplace Management Features
Figure 8. Maintenance Work Order Management Features
Figure 9. Asset Registry And Lifecycle Management Features
Figure 10. Others Features
Figure 11. Global Computer-aided Facility Management (CAFM) Market Size Comparison by Target Facility Complexity (US$ Million), 2021–2032
Figure 12. Multi Site Campus Features
Figure 13. Single Site Large Facility Features
Figure 14. Small And Medium Facility Features
Figure 15. Others Features
Figure 16. Global Computer-aided Facility Management (CAFM) Market Size Comparison by Buyer Organization Size (US$ Million), 2021–2032
Figure 17. Upper Mid Market Features
Figure 18. Small And Medium Business Features
Figure 19. Global Computer-aided Facility Management (CAFM) Market Size by Application (US$ Million), 2021–2032
Figure 20. Global Computer-aided Facility Management (CAFM) Market Share by Application: 2025 vs 2032
Figure 21. Commercial Real Estate And Corporate Case Studies
Figure 22. Healthcare Case Studies
Figure 23. Education Case Studies
Figure 24. Others Case Studies
Figure 25. Computer-aided Facility Management (CAFM) Report Years Considered
Figure 26. Global Computer-aided Facility Management (CAFM) Market Size (US$ Million), Year-over-Year: 2021–2032
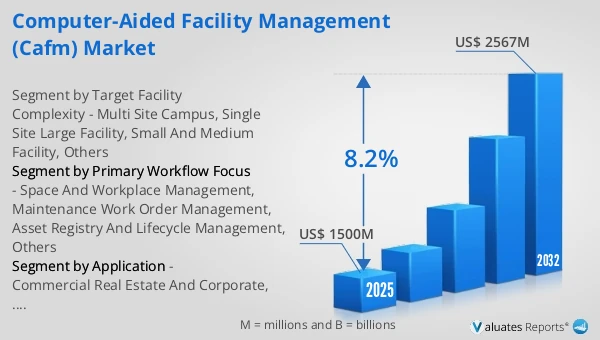
Figure 27. Global Computer-aided Facility Management (CAFM) Market Size, (US$ Million), 2021 vs 2025 vs 2032
Figure 28. Global Computer-aided Facility Management (CAFM) Market Share by Region: 2025 vs 2032
Figure 29. Global Computer-aided Facility Management (CAFM) Market Share by Players in 2025
Figure 30. Global Computer-aided Facility Management (CAFM) Market Share by Company Type (Tier 1, Tier 2, and Tier 3)
Figure 31. The Top 10 and 5 Players Market Share by Computer-aided Facility Management (CAFM) Revenue in 2025
Figure 32. North America Computer-aided Facility Management (CAFM) Market Size YoY Growth (US$ Million), 2021–2032
Figure 33. North America Computer-aided Facility Management (CAFM) Market Share by Country (2021–2032)
Figure 34. United States Computer-aided Facility Management (CAFM) Market Size YoY Growth (US$ Million), 2021–2032
Figure 35. Canada Computer-aided Facility Management (CAFM) Market Size YoY Growth (US$ Million), 2021–2032
Figure 36. Europe Computer-aided Facility Management (CAFM) Market Size YoY Growth (US$ Million), 2021–2032
Figure 37. Europe Computer-aided Facility Management (CAFM) Market Share by Country (2021–2032)
Figure 38. Germany Computer-aided Facility Management (CAFM) Market Size YoY Growth (US$ Million), 2021–2032
Figure 39. France Computer-aided Facility Management (CAFM) Market Size YoY Growth (US$ Million), 2021–2032
Figure 40. U.K. Computer-aided Facility Management (CAFM) Market Size YoY Growth (US$ Million), 2021–2032
Figure 41. Italy Computer-aided Facility Management (CAFM) Market Size YoY Growth (US$ Million), 2021–2032
Figure 42. Russia Computer-aided Facility Management (CAFM) Market Size YoY Growth (US$ Million), 2021–2032
Figure 43. Ireland Computer-aided Facility Management (CAFM) Market Size YoY Growth (US$ Million), 2021–2032
Figure 44. Asia-Pacific Computer-aided Facility Management (CAFM) Market Size YoY Growth (US$ Million), 2021–2032
Figure 45. Asia-Pacific Computer-aided Facility Management (CAFM) Market Share by Region (2021–2032)
Figure 46. China Computer-aided Facility Management (CAFM) Market Size YoY Growth (US$ Million), 2021–2032
Figure 47. Japan Computer-aided Facility Management (CAFM) Market Size YoY Growth (US$ Million), 2021–2032
Figure 48. South Korea Computer-aided Facility Management (CAFM) Market Size YoY Growth (US$ Million), 2021–2032
Figure 49. Southeast Asia Computer-aided Facility Management (CAFM) Market Size YoY Growth (US$ Million), 2021–2032
Figure 50. India Computer-aided Facility Management (CAFM) Market Size YoY Growth (US$ Million), 2021–2032
Figure 51. Australia & New Zealand Computer-aided Facility Management (CAFM) Market Size YoY Growth (US$ Million), 2021–2032
Figure 52. Latin America Computer-aided Facility Management (CAFM) Market Size YoY Growth (US$ Million), 2021–2032
Figure 53. Latin America Computer-aided Facility Management (CAFM) Market Share by Country (2021–2032)
Figure 54. Mexico Computer-aided Facility Management (CAFM) Market Size YoY Growth (US$ Million), 2021–2032
Figure 55. Brazil Computer-aided Facility Management (CAFM) Market Size YoY Growth (US$ Million), 2021–2032
Figure 56. Middle East & Africa Computer-aided Facility Management (CAFM) Market Size YoY Growth (US$ Million), 2021–2032
Figure 57. Middle East & Africa Computer-aided Facility Management (CAFM) Market Share by Country (2021–2032)
Figure 58. Israel Computer-aided Facility Management (CAFM) Market Size YoY Growth (US$ Million), 2021–2032
Figure 59. Saudi Arabia Computer-aided Facility Management (CAFM) Market Size YoY Growth (US$ Million), 2021–2032
Figure 60. UAE Computer-aided Facility Management (CAFM) Market Size YoY Growth (US$ Million), 2021–2032
Figure 61. Planon Revenue Growth Rate in Computer-aided Facility Management (CAFM) Business (2021–2026)
Figure 62. MRI Software LLC Revenue Growth Rate in Computer-aided Facility Management (CAFM) Business (2021–2026)
Figure 63. IBM Revenue Growth Rate in Computer-aided Facility Management (CAFM) Business (2021–2026)
Figure 64. Eptura, Inc. Revenue Growth Rate in Computer-aided Facility Management (CAFM) Business (2021–2026)
Figure 65. Fortive Corporation (Accruent) Revenue Growth Rate in Computer-aided Facility Management (CAFM) Business (2021–2026)
Figure 66. Johnson Controls International plc (FM:Systems) Revenue Growth Rate in Computer-aided Facility Management (CAFM) Business (2021–2026)
Figure 67. Nemetschek Group (Spacewell) Revenue Growth Rate in Computer-aided Facility Management (CAFM) Business (2021–2026)
Figure 68. SAP SE Revenue Growth Rate in Computer-aided Facility Management (CAFM) Business (2021–2026)
Figure 69. Yardi Systems, Inc. Revenue Growth Rate in Computer-aided Facility Management (CAFM) Business (2021–2026)
Figure 70. FSI (FM Solutions) Limited Revenue Growth Rate in Computer-aided Facility Management (CAFM) Business (2021–2026)
Figure 71. Service Works Global Ltd Revenue Growth Rate in Computer-aided Facility Management (CAFM) Business (2021–2026)
Figure 72. JLL (Building Engines) Revenue Growth Rate in Computer-aided Facility Management (CAFM) Business (2021–2026)
Figure 73. Siemens Smart Infrastructure (Brightly Software) Revenue Growth Rate in Computer-aided Facility Management (CAFM) Business (2021–2026)
Figure 74. Valsoft Corporation (DPSI) Revenue Growth Rate in Computer-aided Facility Management (CAFM) Business (2021–2026)
Figure 75. Fluke Reliability (eMaint) Revenue Growth Rate in Computer-aided Facility Management (CAFM) Business (2021–2026)
Figure 76. IFS Revenue Growth Rate in Computer-aided Facility Management (CAFM) Business (2021–2026)
Figure 77. Rockwell Automation (Fiix) Revenue Growth Rate in Computer-aided Facility Management (CAFM) Business (2021–2026)
Figure 78. FMX Revenue Growth Rate in Computer-aided Facility Management (CAFM) Business (2021–2026)
Figure 79. UpKeep Revenue Growth Rate in Computer-aided Facility Management (CAFM) Business (2021–2026)
Figure 80. MVP One Revenue Growth Rate in Computer-aided Facility Management (CAFM) Business (2021–2026)
Figure 81. FasTrak SoftWorks, Inc. (FTMaintenance) Revenue Growth Rate in Computer-aided Facility Management (CAFM) Business (2021–2026)
Figure 82. JDM Technology Group (MPulse / MicroMain) Revenue Growth Rate in Computer-aided Facility Management (CAFM) Business (2021–2026)
Figure 83. Glodon Company Limited Revenue Growth Rate in Computer-aided Facility Management (CAFM) Business (2021–2026)
Figure 84. Hangzhou Hikvision Digital Technology Co., Ltd. Revenue Growth Rate in Computer-aided Facility Management (CAFM) Business (2021–2026)
Figure 85. Huawei Technologies Co., Ltd. Revenue Growth Rate in Computer-aided Facility Management (CAFM) Business (2021–2026)
Figure 86. Nanjing DeepControl Technology Co., Ltd. Revenue Growth Rate in Computer-aided Facility Management (CAFM) Business (2021–2026)
Figure 87. Vanjian (FBIM) Revenue Growth Rate in Computer-aided Facility Management (CAFM) Business (2021–2026)
Figure 88. DBEST Facility Management Co., Ltd. Revenue Growth Rate in Computer-aided Facility Management (CAFM) Business (2021–2026)
Figure 89. DataMesh Revenue Growth Rate in Computer-aided Facility Management (CAFM) Business (2021–2026)
Figure 90. Xiamen Hightopo Software Technology Co., Ltd. Revenue Growth Rate in Computer-aided Facility Management (CAFM) Business (2021–2026)
Figure 91. Bottom-up and Top-down Approaches for This Report
Figure 92. Data Triangulation
Figure 93. Key Executives Interviewed