0
U.S. (TOLL FREE)
+1 (315) 215-3225
Automative

0
U.S. (TOLL FREE)
+1 (315) 215-3225
Global Metal Can Manufacturing Market Research Report 2026
Published Date: 2026-01-07
|
Report Code: QYRE-Auto-30K19930
Home | Market Reports | Business & Industrial| Metals & Mining
Global Metal Can Manufacturing Market Research Report 2026
BUY CHAPTERS

Global Metal Can Manufacturing Market Research Report 2026

Code: QYRE-Auto-30K19930
Report
2026-01-07
Pages:163
QYResearch
Buy Now with 15% Discount
DESCRIPTION
TABLE OF CONTENT
TABLES & FIGURES

Metal Can Manufacturing Market Size

The global Metal Can Manufacturing market was valued at US$ 74688 million in 2025 and is anticipated to reach US$ 87659 million by 2032, at a CAGR of 2.2% from 2026 to 2032.

Metal Can Manufacturing Market

Metal Can Manufacturing Market

The 2025 U.S. tariff policies introduce profound uncertainty into the global economic landscape. This report critically examines the implications of recent tariff adjustments and international strategic countermeasures on Metal Can Manufacturing competitive dynamics, regional economic interdependencies, and supply chain reconfigurations.
Metal Can Manufacturing (two-piece cans, three-piece cans, etc.) refers to the manufacture of metal containers for food, beverages, dairy products, seafood, coatings, chemicals, aerosols, etc., using aluminum or steel strips (such as tinplate, chrome-coated steel, etc.) as the main base material, through processes such as stamping/deep drawing for thinning or shearing, rolling and welding. End caps/easy-open caps are also manufactured to achieve sealing and opening functions.
In 2025, the price difference between two-piece and three-piece cans was significant, with the global average ex-factory price of metal can manufacturing at US$0.15 per can, and sales volume at 497.92 billion cans.
The North American market for Metal Can Manufacturing is projected to increase from US$ million in 2025 to US$ million by 2032, at a CAGR of % over 2026–2032.
The Asia-Pacific market for Metal Can Manufacturing is projected to rise from US$ million in 2025 to US$ million by 2032, at a CAGR of % over 2026–2032.
Major global manufacturers of Metal Can Manufacturing include Ball Corporation, Crown, Ardagh group, Toyo Seikan, Can Pack Group, Silgan Holdings Inc, Daiwa Can Company, Baosteel Packaging, ORG Technology, ShengXing Group, etc. In 2025, the world's top three vendors accounted for approximately % of revenue.
This report delivers a comprehensive overview of the global Metal Can Manufacturing market, with both quantitative and qualitative analyses, to help readers develop growth strategies, assess the competitive landscape, evaluate their position in the current market, and make informed business decisions regarding Metal Can Manufacturing. The Metal Can Manufacturing market size, estimates, and forecasts are provided in terms of sales volume (M Units) and revenue (US$ millions), with 2025 as the base year and historical and forecast data for 2021–2032.
The report segments the global Metal Can Manufacturing market comprehensively. Regional market sizes by Type, by Application, by Size, and by company are also provided. For deeper insight, the report profiles the competitive landscape, key competitors, and their respective market rankings, and discusses technological trends and new product developments.
This report will assist Metal Can Manufacturing manufacturers, new entrants, and companies across the industry value chain with information on revenues, sales volume, and average prices for the overall market and its sub-segments, by company, by Type, by Application, and by region.
Market Segmentation

Scope of Metal Can Manufacturing Market Report

Report Metric Details
Report Name Metal Can Manufacturing Market
Accounted market size in 2025 US$ 74688 in million
Forecasted market size in 2032 US$ 87659 million
CAGR 2.2%
Base Year 2025
Forecasted years 2026 - 2032
Segment by Type
  • Two-piece Can
  • Three-piece Can
  • Others
Segment by Size
  • Aluminum Cans
  • Steel Cans
  • Tin Cans
by Application
  • Food
  • Beverage
  • Aerosol Cans
  • General Industrial Cans
  • Paints/Chemicals
  • Others
Consumption by Region
  • North America (United States, Canada)
  • Europe (Germany, France, UK, Italy, Russia)
  • Asia-Pacific (China, Japan, South Korea, Taiwan)
  • Southeast Asia (India)
  • Latin America (Mexico, Brazil)
By Company Ball Corporation, Crown, Ardagh group, Toyo Seikan, Can Pack Group, Silgan Holdings Inc, Daiwa Can Company, Baosteel Packaging, ORG Technology, ShengXing Group, CPMC Holdings, Hokkan Holdings, Showa Aluminum Can Corporation, United Can (Great China Metal), Kingcan Holdings, Jiamei Food Packaging, Jiyuan Packaging Holdings, Trivium, Mauser Packaging Solutions(BWAY), Colep, Staehle, Massilly, Sarten Packaging, Arnest Russia, Aeropak doo, NCI, Grupo Zapata, Hildering, Metal Press, Oriental Tin Can (OTC), General Metal Container Corporation (GEMECO), Kian Joo Can Factory Berhad, Swan Industries (Thailand) Limited, Lohakij Rung Chareon Sub Co., Ltd, Soonthorn Metal Industries, Standard Can Co., Ltd, Poonsub Can Co., Ltd, Asian Pacific Can Co., Ltd (APC), Royal Can Industries, PT United Can Company (UCC), PT IMCP, Cometa Can, ATP Group, PT Multi Makmur Indah Industri (MMI), Arthawenasakti Gemilang (Arthawena), San Miguel Yamamura Packaging Corp (SMYPC), PT Pelangi Indah Canindo Tbk (PICO), Canpac Vietnam Co., Ltd, TBC-Ball Beverage Can Vietnam Limited, Asia Can Manufacturing Co.,Ltd, Thai Beverage Can Ltd (TBC)
Forecast units USD million in value
Report coverage Revenue and volume forecast, company share, competitive landscape, growth factors and trends

Chapter Outline

  • Chapter 1: Defines the scope of the report and presents an executive summary of market segments (by Type, by Application, by Size, etc.), including the size of each segment and its future growth potential. It offers a high-level view of the current market and its likely evolution in the short, medium, and long term.
  • Chapter 2: Provides a detailed analysis of the competitive landscape for Metal Can Manufacturing manufacturers, covering pricing, sales and revenue shares, latest development plans, and mergers and acquisitions.
  • Chapter 3: Examines Metal Can Manufacturing sales and revenue at the regional and country levels. It quantifies market size and growth potential for each region and its key countries, and outlines market development, outlook, addressable space, and national market size.
  • Chapter 4: Analyzes segments by Type, detailing the size and growth potential of each segment to help readers identify “blue ocean” opportunities.
  • Chapter 5: Analyzes market segments by Application, covering the size and growth potential of each segment to help readers identify “blue ocean” opportunities in downstream markets.
  • Chapter 6: Profiles key players, presenting core information on leading companies, including product sales, revenue, pricing, gross margin, product portfolio/introductions, and recent developments.
  • Chapter 7: Reviews the industry value chain, including upstream and downstream segments.
  • Chapter 8: Discusses market dynamics and recent developments, including drivers, restraints, challenges and risks for manufacturers, U.S. Tariffs and relevant policy analysis.
  • Chapter 9: Summarizes the key findings and conclusions of the report.

FAQ for this report

How fast is Metal Can Manufacturing Market growing?

Ans: The Metal Can Manufacturing Market witnessing a CAGR of 2.2% during the forecast period 2026-2032.

What is the Metal Can Manufacturing Market size in 2032?

Ans: The Metal Can Manufacturing Market size in 2032 will be US$ 87659 million.

Who are the main players in the Metal Can Manufacturing Market report?

Ans: The main players in the Metal Can Manufacturing Market are Ball Corporation, Crown, Ardagh group, Toyo Seikan, Can Pack Group, Silgan Holdings Inc, Daiwa Can Company, Baosteel Packaging, ORG Technology, ShengXing Group, CPMC Holdings, Hokkan Holdings, Showa Aluminum Can Corporation, United Can (Great China Metal), Kingcan Holdings, Jiamei Food Packaging, Jiyuan Packaging Holdings, Trivium, Mauser Packaging Solutions(BWAY), Colep, Staehle, Massilly, Sarten Packaging, Arnest Russia, Aeropak doo, NCI, Grupo Zapata, Hildering, Metal Press, Oriental Tin Can (OTC), General Metal Container Corporation (GEMECO), Kian Joo Can Factory Berhad, Swan Industries (Thailand) Limited, Lohakij Rung Chareon Sub Co., Ltd, Soonthorn Metal Industries, Standard Can Co., Ltd, Poonsub Can Co., Ltd, Asian Pacific Can Co., Ltd (APC), Royal Can Industries, PT United Can Company (UCC), PT IMCP, Cometa Can, ATP Group, PT Multi Makmur Indah Industri (MMI), Arthawenasakti Gemilang (Arthawena), San Miguel Yamamura Packaging Corp (SMYPC), PT Pelangi Indah Canindo Tbk (PICO), Canpac Vietnam Co., Ltd, TBC-Ball Beverage Can Vietnam Limited, Asia Can Manufacturing Co.,Ltd, Thai Beverage Can Ltd (TBC)

What are the Application segmentation covered in the Metal Can Manufacturing Market report?

Ans: The Applications covered in the Metal Can Manufacturing Market report are Food, Beverage, Aerosol Cans, General Industrial Cans, Paints/Chemicals, Others

What are the Type segmentation covered in the Metal Can Manufacturing Market report?

Ans: The Types covered in the Metal Can Manufacturing Market report are Two-piece Can, Three-piece Can, Others

1 Metal Can Manufacturing Market Overview
1.1 Product Definition
1.2 Metal Can Manufacturing by Type
1.2.1 Global Metal Can Manufacturing Market Value by Type: 2025 vs 2032
1.2.2 Two-piece Can
1.2.3 Three-piece Can
1.2.4 Others
1.3 Metal Can Manufacturing by Size
1.3.1 Global Metal Can Manufacturing Market Value by Size: 2025 vs 2032
1.3.2 Aluminum Cans
1.3.3 Steel Cans
1.3.4 Tin Cans
1.4 Metal Can Manufacturing by Application
1.4.1 Global Metal Can Manufacturing Market Value by Application: 2025 vs 2032
1.4.2 Food
1.4.3 Beverage
1.4.4 Aerosol Cans
1.4.5 General Industrial Cans
1.4.6 Paints/Chemicals
1.4.7 Others
1.5 Global Metal Can Manufacturing Market Size Estimates and Forecasts
1.5.1 Global Metal Can Manufacturing Revenue 2021–2032
1.5.2 Global Metal Can Manufacturing Sales 2021–2032
1.5.3 Global Metal Can Manufacturing Market Average Price (2021–2032)
1.6 Assumptions and Limitations
2 Metal Can Manufacturing Market Competition by Manufacturers
2.1 Global Metal Can Manufacturing Sales Market Share by Manufacturers (2021–2026)
2.2 Global Metal Can Manufacturing Revenue Market Share by Manufacturers (2021–2026)
2.3 Global Metal Can Manufacturing Average Price by Manufacturers (2021–2026)
2.4 Global Key Players of Metal Can Manufacturing, Industry Ranking, 2023 vs 2024 vs 2025
2.5 Global Key Manufacturers of Metal Can Manufacturing, Manufacturing Sites and Headquarters
2.6 Global Key Manufacturers of Metal Can Manufacturing, Product Types and Applications
2.7 Global Key Manufacturers of Metal Can Manufacturing, Date of Entry into the Industry
2.8 Global Metal Can Manufacturing Market Competitive Situation and Trends
2.8.1 Global Metal Can Manufacturing Market Concentration Rate
2.8.2 The Top 5 and Top 10 Global Metal Can Manufacturing Players Market Share by Revenue
2.8.3 Global Metal Can Manufacturing Market Share by Company Tier (Tier 1, Tier 2, Tier 3)
2.9 Manufacturers Mergers & Acquisitions, Expansion Plans
3 Global Metal Can Manufacturing Market Scenario by Region
3.1 Global Metal Can Manufacturing Market Size by Region: 2021 vs 2025 vs 2032
3.2 Global Metal Can Manufacturing Sales by Region: 2021–2032
3.2.1 Global Metal Can Manufacturing Sales by Region: 2021–2026
3.2.2 Global Metal Can Manufacturing Sales by Region: 2027–2032
3.3 Global Metal Can Manufacturing Revenue by Region: 2021–2032
3.3.1 Global Metal Can Manufacturing Revenue by Region: 2021–2026
3.3.2 Global Metal Can Manufacturing Revenue by Region: 2027–2032
3.4 North America Metal Can Manufacturing Market Facts & Figures by Country
3.4.1 North America Metal Can Manufacturing Market Size by Country: 2021 vs 2025 vs 2032
3.4.2 North America Metal Can Manufacturing Sales by Country (2021–2032)
3.4.3 North America Metal Can Manufacturing Revenue by Country (2021–2032)
3.4.4 United States
3.4.5 Canada
3.5 Europe Metal Can Manufacturing Market Facts & Figures by Country
3.5.1 Europe Metal Can Manufacturing Market Size by Country: 2021 vs 2025 vs 2032
3.5.2 Europe Metal Can Manufacturing Sales by Country (2021–2032)
3.5.3 Europe Metal Can Manufacturing Revenue by Country (2021–2032)
3.5.4 Germany
3.5.5 France
3.5.6 U.K.
3.5.7 Italy
3.5.8 Russia
3.6 Asia Pacific Metal Can Manufacturing Market Facts & Figures by Region
3.6.1 Asia Pacific Metal Can Manufacturing Market Size by Region: 2021 vs 2025 vs 2032
3.6.2 Asia Pacific Metal Can Manufacturing Sales by Region (2021–2032)
3.6.3 Asia Pacific Metal Can Manufacturing Revenue by Region (2021–2032)
3.6.4 China
3.6.5 Japan
3.6.6 South Korea
3.6.7 India
3.6.8 Australia
3.6.9 China Taiwan
3.6.10 Southeast Asia
3.7 Latin America Metal Can Manufacturing Market Facts & Figures by Country
3.7.1 Latin America Metal Can Manufacturing Market Size by Country: 2021 vs 2025 vs 2032
3.7.2 Latin America Metal Can Manufacturing Sales by Country (2021–2032)
3.7.3 Latin America Metal Can Manufacturing Revenue by Country (2021–2032)
3.7.4 Mexico
3.7.5 Brazil
3.7.6 Argentina
3.7.7 Colombia
3.8 Middle East and Africa Metal Can Manufacturing Market Facts & Figures by Country
3.8.1 Middle East and Africa Metal Can Manufacturing Market Size by Country: 2021 vs 2025 vs 2032
3.8.2 Middle East and Africa Metal Can Manufacturing Sales by Country (2021–2032)
3.8.3 Middle East and Africa Metal Can Manufacturing Revenue by Country (2021–2032)
3.8.4 Turkey
3.8.5 Saudi Arabia
3.8.6 UAE
4 Segment by Type
4.1 Global Metal Can Manufacturing Sales by Type (2021–2032)
4.1.1 Global Metal Can Manufacturing Sales by Type (2021–2026)
4.1.2 Global Metal Can Manufacturing Sales by Type (2027–2032)
4.1.3 Global Metal Can Manufacturing Sales Market Share by Type (2021–2032)
4.2 Global Metal Can Manufacturing Revenue by Type (2021–2032)
4.2.1 Global Metal Can Manufacturing Revenue by Type (2021–2026)
4.2.2 Global Metal Can Manufacturing Revenue by Type (2027–2032)
4.2.3 Global Metal Can Manufacturing Revenue Market Share by Type (2021–2032)
4.3 Global Metal Can Manufacturing Price by Type (2021–2032)
5 Segment by Application
5.1 Global Metal Can Manufacturing Sales by Application (2021–2032)
5.1.1 Global Metal Can Manufacturing Sales by Application (2021–2026)
5.1.2 Global Metal Can Manufacturing Sales by Application (2027–2032)
5.1.3 Global Metal Can Manufacturing Sales Market Share by Application (2021–2032)
5.2 Global Metal Can Manufacturing Revenue by Application (2021–2032)
5.2.1 Global Metal Can Manufacturing Revenue by Application (2021–2026)
5.2.2 Global Metal Can Manufacturing Revenue by Application (2027–2032)
5.2.3 Global Metal Can Manufacturing Revenue Market Share by Application (2021–2032)
5.3 Global Metal Can Manufacturing Price by Application (2021–2032)
6 Key Companies Profiled
6.1 Ball Corporation
6.1.1 Ball Corporation Company Information
6.1.2 Ball Corporation Description and Business Overview
6.1.3 Ball Corporation Metal Can Manufacturing Sales, Revenue, and Gross Margin (2021–2026)
6.1.4 Ball Corporation Metal Can Manufacturing Product Portfolio
6.1.5 Ball Corporation Recent Developments/Updates
6.2 Crown
6.2.1 Crown Company Information
6.2.2 Crown Description and Business Overview
6.2.3 Crown Metal Can Manufacturing Sales, Revenue, and Gross Margin (2021–2026)
6.2.4 Crown Metal Can Manufacturing Product Portfolio
6.2.5 Crown Recent Developments/Updates
6.3 Ardagh group
6.3.1 Ardagh group Company Information
6.3.2 Ardagh group Description and Business Overview
6.3.3 Ardagh group Metal Can Manufacturing Sales, Revenue, and Gross Margin (2021–2026)
6.3.4 Ardagh group Metal Can Manufacturing Product Portfolio
6.3.5 Ardagh group Recent Developments/Updates
6.4 Toyo Seikan
6.4.1 Toyo Seikan Company Information
6.4.2 Toyo Seikan Description and Business Overview
6.4.3 Toyo Seikan Metal Can Manufacturing Sales, Revenue, and Gross Margin (2021–2026)
6.4.4 Toyo Seikan Metal Can Manufacturing Product Portfolio
6.4.5 Toyo Seikan Recent Developments/Updates
6.5 Can Pack Group
6.5.1 Can Pack Group Company Information
6.5.2 Can Pack Group Description and Business Overview
6.5.3 Can Pack Group Metal Can Manufacturing Sales, Revenue, and Gross Margin (2021–2026)
6.5.4 Can Pack Group Metal Can Manufacturing Product Portfolio
6.5.5 Can Pack Group Recent Developments/Updates
6.6 Silgan Holdings Inc
6.6.1 Silgan Holdings Inc Company Information
6.6.2 Silgan Holdings Inc Description and Business Overview
6.6.3 Silgan Holdings Inc Metal Can Manufacturing Sales, Revenue, and Gross Margin (2021–2026)
6.6.4 Silgan Holdings Inc Metal Can Manufacturing Product Portfolio
6.6.5 Silgan Holdings Inc Recent Developments/Updates
6.7 Daiwa Can Company
6.7.1 Daiwa Can Company Company Information
6.7.2 Daiwa Can Company Description and Business Overview
6.7.3 Daiwa Can Company Metal Can Manufacturing Sales, Revenue, and Gross Margin (2021–2026)
6.7.4 Daiwa Can Company Metal Can Manufacturing Product Portfolio
6.7.5 Daiwa Can Company Recent Developments/Updates
6.8 Baosteel Packaging
6.8.1 Baosteel Packaging Company Information
6.8.2 Baosteel Packaging Description and Business Overview
6.8.3 Baosteel Packaging Metal Can Manufacturing Sales, Revenue, and Gross Margin (2021–2026)
6.8.4 Baosteel Packaging Metal Can Manufacturing Product Portfolio
6.8.5 Baosteel Packaging Recent Developments/Updates
6.9 ORG Technology
6.9.1 ORG Technology Company Information
6.9.2 ORG Technology Description and Business Overview
6.9.3 ORG Technology Metal Can Manufacturing Sales, Revenue, and Gross Margin (2021–2026)
6.9.4 ORG Technology Metal Can Manufacturing Product Portfolio
6.9.5 ORG Technology Recent Developments/Updates
6.10 ShengXing Group
6.10.1 ShengXing Group Company Information
6.10.2 ShengXing Group Description and Business Overview
6.10.3 ShengXing Group Metal Can Manufacturing Sales, Revenue, and Gross Margin (2021–2026)
6.10.4 ShengXing Group Metal Can Manufacturing Product Portfolio
6.10.5 ShengXing Group Recent Developments/Updates
6.11 CPMC Holdings
6.11.1 CPMC Holdings Company Information
6.11.2 CPMC Holdings Description and Business Overview
6.11.3 CPMC Holdings Metal Can Manufacturing Sales, Revenue, and Gross Margin (2021–2026)
6.11.4 CPMC Holdings Metal Can Manufacturing Product Portfolio
6.11.5 CPMC Holdings Recent Developments/Updates
6.12 Hokkan Holdings
6.12.1 Hokkan Holdings Company Information
6.12.2 Hokkan Holdings Description and Business Overview
6.12.3 Hokkan Holdings Metal Can Manufacturing Sales, Revenue, and Gross Margin (2021–2026)
6.12.4 Hokkan Holdings Metal Can Manufacturing Product Portfolio
6.12.5 Hokkan Holdings Recent Developments/Updates
6.13 Showa Aluminum Can Corporation
6.13.1 Showa Aluminum Can Corporation Company Information
6.13.2 Showa Aluminum Can Corporation Description and Business Overview
6.13.3 Showa Aluminum Can Corporation Metal Can Manufacturing Sales, Revenue, and Gross Margin (2021–2026)
6.13.4 Showa Aluminum Can Corporation Metal Can Manufacturing Product Portfolio
6.13.5 Showa Aluminum Can Corporation Recent Developments/Updates
6.14 United Can (Great China Metal)
6.14.1 United Can (Great China Metal) Company Information
6.14.2 United Can (Great China Metal) Description and Business Overview
6.14.3 United Can (Great China Metal) Metal Can Manufacturing Sales, Revenue, and Gross Margin (2021–2026)
6.14.4 United Can (Great China Metal) Metal Can Manufacturing Product Portfolio
6.14.5 United Can (Great China Metal) Recent Developments/Updates
6.15 Kingcan Holdings
6.15.1 Kingcan Holdings Company Information
6.15.2 Kingcan Holdings Description and Business Overview
6.15.3 Kingcan Holdings Metal Can Manufacturing Sales, Revenue, and Gross Margin (2021–2026)
6.15.4 Kingcan Holdings Metal Can Manufacturing Product Portfolio
6.15.5 Kingcan Holdings Recent Developments/Updates
6.16 Jiamei Food Packaging
6.16.1 Jiamei Food Packaging Company Information
6.16.2 Jiamei Food Packaging Description and Business Overview
6.16.3 Jiamei Food Packaging Metal Can Manufacturing Sales, Revenue, and Gross Margin (2021–2026)
6.16.4 Jiamei Food Packaging Metal Can Manufacturing Product Portfolio
6.16.5 Jiamei Food Packaging Recent Developments/Updates
6.17 Jiyuan Packaging Holdings
6.17.1 Jiyuan Packaging Holdings Company Information
6.17.2 Jiyuan Packaging Holdings Description and Business Overview
6.17.3 Jiyuan Packaging Holdings Metal Can Manufacturing Sales, Revenue, and Gross Margin (2021–2026)
6.17.4 Jiyuan Packaging Holdings Metal Can Manufacturing Product Portfolio
6.17.5 Jiyuan Packaging Holdings Recent Developments/Updates
6.18 Trivium
6.18.1 Trivium Company Information
6.18.2 Trivium Description and Business Overview
6.18.3 Trivium Metal Can Manufacturing Sales, Revenue, and Gross Margin (2021–2026)
6.18.4 Trivium Metal Can Manufacturing Product Portfolio
6.18.5 Trivium Recent Developments/Updates
6.19 Mauser Packaging Solutions(BWAY)
6.19.1 Mauser Packaging Solutions(BWAY) Company Information
6.19.2 Mauser Packaging Solutions(BWAY) Description and Business Overview
6.19.3 Mauser Packaging Solutions(BWAY) Metal Can Manufacturing Sales, Revenue, and Gross Margin (2021–2026)
6.19.4 Mauser Packaging Solutions(BWAY) Metal Can Manufacturing Product Portfolio
6.19.5 Mauser Packaging Solutions(BWAY) Recent Developments/Updates
6.20 Colep
6.20.1 Colep Company Information
6.20.2 Colep Description and Business Overview
6.20.3 Colep Metal Can Manufacturing Sales, Revenue, and Gross Margin (2021–2026)
6.20.4 Colep Metal Can Manufacturing Product Portfolio
6.20.5 Colep Recent Developments/Updates
6.21 Staehle
6.21.1 Staehle Company Information
6.21.2 Staehle Description and Business Overview
6.21.3 Staehle Metal Can Manufacturing Sales, Revenue, and Gross Margin (2021–2026)
6.21.4 Staehle Metal Can Manufacturing Product Portfolio
6.21.5 Staehle Recent Developments/Updates
6.22 Massilly
6.22.1 Massilly Company Information
6.22.2 Massilly Description and Business Overview
6.22.3 Massilly Metal Can Manufacturing Sales, Revenue, and Gross Margin (2021–2026)
6.22.4 Massilly Metal Can Manufacturing Product Portfolio
6.22.5 Massilly Recent Developments/Updates
6.23 Sarten Packaging
6.23.1 Sarten Packaging Company Information
6.23.2 Sarten Packaging Description and Business Overview
6.23.3 Sarten Packaging Metal Can Manufacturing Sales, Revenue, and Gross Margin (2021–2026)
6.23.4 Sarten Packaging Metal Can Manufacturing Product Portfolio
6.23.5 Sarten Packaging Recent Developments/Updates
6.24 Arnest Russia
6.24.1 Arnest Russia Company Information
6.24.2 Arnest Russia Description and Business Overview
6.24.3 Arnest Russia Metal Can Manufacturing Sales, Revenue, and Gross Margin (2021–2026)
6.24.4 Arnest Russia Metal Can Manufacturing Product Portfolio
6.24.5 Arnest Russia Recent Developments/Updates
6.25 Aeropak doo
6.25.1 Aeropak doo Company Information
6.25.2 Aeropak doo Description and Business Overview
6.25.3 Aeropak doo Metal Can Manufacturing Sales, Revenue, and Gross Margin (2021–2026)
6.25.4 Aeropak doo Metal Can Manufacturing Product Portfolio
6.25.5 Aeropak doo Recent Developments/Updates
6.26 NCI
6.26.1 NCI Company Information
6.26.2 NCI Description and Business Overview
6.26.3 NCI Metal Can Manufacturing Sales, Revenue, and Gross Margin (2021–2026)
6.26.4 NCI Metal Can Manufacturing Product Portfolio
6.26.5 NCI Recent Developments/Updates
6.27 Grupo Zapata
6.27.1 Grupo Zapata Company Information
6.27.2 Grupo Zapata Description and Business Overview
6.27.3 Grupo Zapata Metal Can Manufacturing Sales, Revenue, and Gross Margin (2021–2026)
6.27.4 Grupo Zapata Metal Can Manufacturing Product Portfolio
6.27.5 Grupo Zapata Recent Developments/Updates
6.28 Hildering
6.28.1 Hildering Company Information
6.28.2 Hildering Description and Business Overview
6.28.3 Hildering Metal Can Manufacturing Sales, Revenue, and Gross Margin (2021–2026)
6.28.4 Hildering Metal Can Manufacturing Product Portfolio
6.28.5 Hildering Recent Developments/Updates
6.29 Metal Press
6.29.1 Metal Press Company Information
6.29.2 Metal Press Description and Business Overview
6.29.3 Metal Press Metal Can Manufacturing Sales, Revenue, and Gross Margin (2021–2026)
6.29.4 Metal Press Metal Can Manufacturing Product Portfolio
6.29.5 Metal Press Recent Developments/Updates
6.30 Oriental Tin Can (OTC)
6.30.1 Oriental Tin Can (OTC) Company Information
6.30.2 Oriental Tin Can (OTC) Description and Business Overview
6.30.3 Oriental Tin Can (OTC) Metal Can Manufacturing Sales, Revenue, and Gross Margin (2021–2026)
6.30.4 Oriental Tin Can (OTC) Metal Can Manufacturing Product Portfolio
6.30.5 Oriental Tin Can (OTC) Recent Developments/Updates
6.31 General Metal Container Corporation (GEMECO)
6.31.1 General Metal Container Corporation (GEMECO) Company Information
6.31.2 General Metal Container Corporation (GEMECO) Description and Business Overview
6.31.3 General Metal Container Corporation (GEMECO) Metal Can Manufacturing Sales, Revenue, and Gross Margin (2021–2026)
6.31.4 General Metal Container Corporation (GEMECO) Metal Can Manufacturing Product Portfolio
6.31.5 General Metal Container Corporation (GEMECO) Recent Developments/Updates
6.32 Kian Joo Can Factory Berhad
6.32.1 Kian Joo Can Factory Berhad Company Information
6.32.2 Kian Joo Can Factory Berhad Description and Business Overview
6.32.3 Kian Joo Can Factory Berhad Metal Can Manufacturing Sales, Revenue, and Gross Margin (2021–2026)
6.32.4 Kian Joo Can Factory Berhad Metal Can Manufacturing Product Portfolio
6.32.5 Kian Joo Can Factory Berhad Recent Developments/Updates
6.33 Swan Industries (Thailand) Limited
6.33.1 Swan Industries (Thailand) Limited Company Information
6.33.2 Swan Industries (Thailand) Limited Description and Business Overview
6.33.3 Swan Industries (Thailand) Limited Metal Can Manufacturing Sales, Revenue, and Gross Margin (2021–2026)
6.33.4 Swan Industries (Thailand) Limited Metal Can Manufacturing Product Portfolio
6.33.5 Swan Industries (Thailand) Limited Recent Developments/Updates
6.34 Lohakij Rung Chareon Sub Co., Ltd
6.34.1 Lohakij Rung Chareon Sub Co., Ltd Company Information
6.34.2 Lohakij Rung Chareon Sub Co., Ltd Description and Business Overview
6.34.3 Lohakij Rung Chareon Sub Co., Ltd Metal Can Manufacturing Sales, Revenue, and Gross Margin (2021–2026)
6.34.4 Lohakij Rung Chareon Sub Co., Ltd Metal Can Manufacturing Product Portfolio
6.34.5 Lohakij Rung Chareon Sub Co., Ltd Recent Developments/Updates
6.35 Soonthorn Metal Industries
6.35.1 Soonthorn Metal Industries Company Information
6.35.2 Soonthorn Metal Industries Description and Business Overview
6.35.3 Soonthorn Metal Industries Metal Can Manufacturing Sales, Revenue, and Gross Margin (2021–2026)
6.35.4 Soonthorn Metal Industries Metal Can Manufacturing Product Portfolio
6.35.5 Soonthorn Metal Industries Recent Developments/Updates
6.36 Standard Can Co., Ltd
6.36.1 Standard Can Co., Ltd Company Information
6.36.2 Standard Can Co., Ltd Description and Business Overview
6.36.3 Standard Can Co., Ltd Metal Can Manufacturing Sales, Revenue, and Gross Margin (2021–2026)
6.36.4 Standard Can Co., Ltd Metal Can Manufacturing Product Portfolio
6.36.5 Standard Can Co., Ltd Recent Developments/Updates
6.37 Poonsub Can Co., Ltd
6.37.1 Poonsub Can Co., Ltd Company Information
6.37.2 Poonsub Can Co., Ltd Description and Business Overview
6.37.3 Poonsub Can Co., Ltd Metal Can Manufacturing Sales, Revenue, and Gross Margin (2021–2026)
6.37.4 Poonsub Can Co., Ltd Metal Can Manufacturing Product Portfolio
6.37.5 Poonsub Can Co., Ltd Recent Developments/Updates
6.38 Asian Pacific Can Co., Ltd (APC)
6.38.1 Asian Pacific Can Co., Ltd (APC) Company Information
6.38.2 Asian Pacific Can Co., Ltd (APC) Description and Business Overview
6.38.3 Asian Pacific Can Co., Ltd (APC) Metal Can Manufacturing Sales, Revenue, and Gross Margin (2021–2026)
6.38.4 Asian Pacific Can Co., Ltd (APC) Metal Can Manufacturing Product Portfolio
6.38.5 Asian Pacific Can Co., Ltd (APC) Recent Developments/Updates
6.39 Royal Can Industries
6.39.1 Royal Can Industries Company Information
6.39.2 Royal Can Industries Description and Business Overview
6.39.3 Royal Can Industries Metal Can Manufacturing Sales, Revenue, and Gross Margin (2021–2026)
6.39.4 Royal Can Industries Metal Can Manufacturing Product Portfolio
6.39.5 Royal Can Industries Recent Developments/Updates
6.40 PT United Can Company (UCC)
6.40.1 PT United Can Company (UCC) Company Information
6.40.2 PT United Can Company (UCC) Description and Business Overview
6.40.3 PT United Can Company (UCC) Metal Can Manufacturing Sales, Revenue, and Gross Margin (2021–2026)
6.40.4 PT United Can Company (UCC) Metal Can Manufacturing Product Portfolio
6.40.5 PT United Can Company (UCC) Recent Developments/Updates
7 Industry Chain and Sales Channels Analysis
7.1 Metal Can Manufacturing Industry Chain Analysis
7.2 Metal Can Manufacturing Raw Material Supply Analysis
7.2.1 Key Raw Materials
7.2.2 Raw Materials Key Suppliers
7.3 Metal Can Manufacturing Production Mode & Process Analysis
7.4 Metal Can Manufacturing Sales and Marketing
7.4.1 Metal Can Manufacturing Sales Channels
7.4.2 Metal Can Manufacturing Distributors
7.5 Metal Can Manufacturing Customer Analysis
8 Metal Can Manufacturing Market Dynamics
8.1 Metal Can Manufacturing Industry Trends
8.2 Metal Can Manufacturing Market Drivers
8.3 Metal Can Manufacturing Market Challenges
8.4 Metal Can Manufacturing Market Restraints
8.5 Impact of U.S. Tariffs
9 Research Findings and Conclusion
10 Methodology and Data Source
10.1 Methodology/Research Approach
10.1.1 Research Programs/Design
10.1.2 Market Size Estimation
10.1.3 Market Breakdown and Data Triangulation
10.2 Data Source
10.2.1 Secondary Sources
10.2.2 Primary Sources
10.3 Author List
10.4 Disclaimer
List of Tables
 Table 1. Global Metal Can Manufacturing Market Value by Type (US$ Million), 2025 vs 2032
 Table 2. Global Metal Can Manufacturing Market Value by Size (US$ Million), 2025 vs 2032
 Table 3. Global Metal Can Manufacturing Market Value by Application (US$ Million), 2025 vs 2032
 Table 4. Global Metal Can Manufacturing Market Competitive Situation by Manufacturers in 2025
 Table 5. Global Metal Can Manufacturing Sales (M Units) of Key Manufacturers (2021–2026)
 Table 6. Global Metal Can Manufacturing Sales Market Share by Manufacturers (2021–2026)
 Table 7. Global Metal Can Manufacturing Revenue (US$ Million) by Manufacturers (2021–2026)
 Table 8. Global Metal Can Manufacturing Revenue Share by Manufacturers (2021–2026)
 Table 9. Global Market Metal Can Manufacturing Average Price (USD/K Unit) of Key Manufacturers (2021–2026)
 Table 10. Global Key Players of Metal Can Manufacturing, Industry Ranking, 2023 vs 2024 vs 2025
 Table 11. Global Key Manufacturers of Metal Can Manufacturing, Manufacturing Sites and Headquarters
 Table 12. Global Key Manufacturers of Metal Can Manufacturing, Product Types and Applications
 Table 13. Global Key Manufacturers of Metal Can Manufacturing, Date of Entry into the Industry
 Table 14. Global Manufacturers Market Concentration Ratio (CR5 and HHI)
 Table 15. Global Metal Can Manufacturing Companies by Tier (Tier 1, Tier 2, Tier 3), based on Metal Can Manufacturing Revenue, 2025
 Table 16. Manufacturers Mergers & Acquisitions, Expansion Plans
 Table 17. Global Metal Can Manufacturing Market Size by Region (US$ Million): 2021 vs 2025 vs 2032
 Table 18. Global Metal Can Manufacturing Sales by Region (M Units), 2021–2026
 Table 19. Global Metal Can Manufacturing Sales Market Share by Region (2021–2026)
 Table 20. Global Metal Can Manufacturing Sales by Region (M Units), 2027–2032
 Table 21. Global Metal Can Manufacturing Sales Market Share by Region (2027–2032)
 Table 22. Global Metal Can Manufacturing Revenue by Region (US$ Million), 2021–2026
 Table 23. Global Metal Can Manufacturing Revenue Market Share by Region (2021–2026)
 Table 24. Global Metal Can Manufacturing Revenue by Region (US$ Million), 2027–2032
 Table 25. Global Metal Can Manufacturing Revenue Market Share by Region (2027–2032)
 Table 26. North America Metal Can Manufacturing Revenue by Country: 2021 vs 2025 vs 2032 (US$ Million)
 Table 27. North America Metal Can Manufacturing Sales by Country (M Units), 2021–2026
 Table 28. North America Metal Can Manufacturing Sales by Country (M Units), 2027–2032
 Table 29. North America Metal Can Manufacturing Revenue by Country (US$ Million), 2021–2026
 Table 30. North America Metal Can Manufacturing Revenue by Country (US$ Million), 2027–2032
 Table 31. Europe Metal Can Manufacturing Revenue by Country: 2021 vs 2025 vs 2032 (US$ Million)
 Table 32. Europe Metal Can Manufacturing Sales by Country (M Units), 2021–2026
 Table 33. Europe Metal Can Manufacturing Sales by Country (M Units), 2027–2032
 Table 34. Europe Metal Can Manufacturing Revenue by Country (US$ Million), 2021–2026
 Table 35. Europe Metal Can Manufacturing Revenue by Country (US$ Million), 2027–2032
 Table 36. Asia Pacific Metal Can Manufacturing Revenue by Region: 2021 vs 2025 vs 2032 (US$ Million)
 Table 37. Asia Pacific Metal Can Manufacturing Sales by Region (M Units), 2021–2026
 Table 38. Asia Pacific Metal Can Manufacturing Sales by Region (M Units), 2027–2032
 Table 39. Asia Pacific Metal Can Manufacturing Revenue by Region (US$ Million), 2021–2026
 Table 40. Asia Pacific Metal Can Manufacturing Revenue by Region (US$ Million), 2027–2032
 Table 41. Latin America Metal Can Manufacturing Revenue by Country: 2021 vs 2025 vs 2032 (US$ Million)
 Table 42. Latin America Metal Can Manufacturing Sales by Country (M Units), 2021–2026
 Table 43. Latin America Metal Can Manufacturing Sales by Country (M Units), 2027–2032
 Table 44. Latin America Metal Can Manufacturing Revenue by Country (US$ Million), 2021–2026
 Table 45. Latin America Metal Can Manufacturing Revenue by Country (US$ Million), 2027–2032
 Table 46. Middle East and Africa Metal Can Manufacturing Revenue by Country: 2021 vs 2025 vs 2032 (US$ Million)
 Table 47. Middle East and Africa Metal Can Manufacturing Sales by Country (M Units), 2021–2026
 Table 48. Middle East and Africa Metal Can Manufacturing Sales by Country (M Units), 2027–2032
 Table 49. Middle East and Africa Metal Can Manufacturing Revenue by Country (US$ Million), 2021–2026
 Table 50. Middle East and Africa Metal Can Manufacturing Revenue by Country (US$ Million), 2027–2032
 Table 51. Global Metal Can Manufacturing Sales (M Units) by Type (2021–2026)
 Table 52. Global Metal Can Manufacturing Sales (M Units) by Type (2027–2032)
 Table 53. Global Metal Can Manufacturing Sales Market Share by Type (2021–2026)
 Table 54. Global Metal Can Manufacturing Sales Market Share by Type (2027–2032)
 Table 55. Global Metal Can Manufacturing Revenue (US$ Million) by Type (2021–2026)
 Table 56. Global Metal Can Manufacturing Revenue (US$ Million) by Type (2027–2032)
 Table 57. Global Metal Can Manufacturing Revenue Market Share by Type (2021–2026)
 Table 58. Global Metal Can Manufacturing Revenue Market Share by Type (2027–2032)
 Table 59. Global Metal Can Manufacturing Price (USD/K Unit) by Type (2021–2026)
 Table 60. Global Metal Can Manufacturing Price (USD/K Unit) by Type (2027–2032)
 Table 61. Global Metal Can Manufacturing Sales (M Units) by Application (2021–2026)
 Table 62. Global Metal Can Manufacturing Sales (M Units) by Application (2027–2032)
 Table 63. Global Metal Can Manufacturing Sales Market Share by Application (2021–2026)
 Table 64. Global Metal Can Manufacturing Sales Market Share by Application (2027–2032)
 Table 65. Global Metal Can Manufacturing Revenue (US$ Million) by Application (2021–2026)
 Table 66. Global Metal Can Manufacturing Revenue (US$ Million) by Application (2027–2032)
 Table 67. Global Metal Can Manufacturing Revenue Market Share by Application (2021–2026)
 Table 68. Global Metal Can Manufacturing Revenue Market Share by Application (2027–2032)
 Table 69. Global Metal Can Manufacturing Price (USD/K Unit) by Application (2021–2026)
 Table 70. Global Metal Can Manufacturing Price (USD/K Unit) by Application (2027–2032)
 Table 71. Ball Corporation Company Information
 Table 72. Ball Corporation Description and Business Overview
 Table 73. Ball Corporation Metal Can Manufacturing Sales (M Units), Revenue (US$ Million), Price (USD/K Unit), and Gross Margin (2021–2026)
 Table 74. Ball Corporation Metal Can Manufacturing Product
 Table 75. Ball Corporation Recent Developments/Updates
 Table 76. Crown Company Information
 Table 77. Crown Description and Business Overview
 Table 78. Crown Metal Can Manufacturing Sales (M Units), Revenue (US$ Million), Price (USD/K Unit), and Gross Margin (2021–2026)
 Table 79. Crown Metal Can Manufacturing Product
 Table 80. Crown Recent Developments/Updates
 Table 81. Ardagh group Company Information
 Table 82. Ardagh group Description and Business Overview
 Table 83. Ardagh group Metal Can Manufacturing Sales (M Units), Revenue (US$ Million), Price (USD/K Unit), and Gross Margin (2021–2026)
 Table 84. Ardagh group Metal Can Manufacturing Product
 Table 85. Ardagh group Recent Developments/Updates
 Table 86. Toyo Seikan Company Information
 Table 87. Toyo Seikan Description and Business Overview
 Table 88. Toyo Seikan Metal Can Manufacturing Sales (M Units), Revenue (US$ Million), Price (USD/K Unit), and Gross Margin (2021–2026)
 Table 89. Toyo Seikan Metal Can Manufacturing Product
 Table 90. Toyo Seikan Recent Developments/Updates
 Table 91. Can Pack Group Company Information
 Table 92. Can Pack Group Description and Business Overview
 Table 93. Can Pack Group Metal Can Manufacturing Sales (M Units), Revenue (US$ Million), Price (USD/K Unit), and Gross Margin (2021–2026)
 Table 94. Can Pack Group Metal Can Manufacturing Product
 Table 95. Can Pack Group Recent Developments/Updates
 Table 96. Silgan Holdings Inc Company Information
 Table 97. Silgan Holdings Inc Description and Business Overview
 Table 98. Silgan Holdings Inc Metal Can Manufacturing Sales (M Units), Revenue (US$ Million), Price (USD/K Unit), and Gross Margin (2021–2026)
 Table 99. Silgan Holdings Inc Metal Can Manufacturing Product
 Table 100. Silgan Holdings Inc Recent Developments/Updates
 Table 101. Daiwa Can Company Company Information
 Table 102. Daiwa Can Company Description and Business Overview
 Table 103. Daiwa Can Company Metal Can Manufacturing Sales (M Units), Revenue (US$ Million), Price (USD/K Unit), and Gross Margin (2021–2026)
 Table 104. Daiwa Can Company Metal Can Manufacturing Product
 Table 105. Daiwa Can Company Recent Developments/Updates
 Table 106. Baosteel Packaging Company Information
 Table 107. Baosteel Packaging Description and Business Overview
 Table 108. Baosteel Packaging Metal Can Manufacturing Sales (M Units), Revenue (US$ Million), Price (USD/K Unit), and Gross Margin (2021–2026)
 Table 109. Baosteel Packaging Metal Can Manufacturing Product
 Table 110. Baosteel Packaging Recent Developments/Updates
 Table 111. ORG Technology Company Information
 Table 112. ORG Technology Description and Business Overview
 Table 113. ORG Technology Metal Can Manufacturing Sales (M Units), Revenue (US$ Million), Price (USD/K Unit), and Gross Margin (2021–2026)
 Table 114. ORG Technology Metal Can Manufacturing Product
 Table 115. ORG Technology Recent Developments/Updates
 Table 116. ShengXing Group Company Information
 Table 117. ShengXing Group Description and Business Overview
 Table 118. ShengXing Group Metal Can Manufacturing Sales (M Units), Revenue (US$ Million), Price (USD/K Unit), and Gross Margin (2021–2026)
 Table 119. ShengXing Group Metal Can Manufacturing Product
 Table 120. ShengXing Group Recent Developments/Updates
 Table 121. CPMC Holdings Company Information
 Table 122. CPMC Holdings Description and Business Overview
 Table 123. CPMC Holdings Metal Can Manufacturing Sales (M Units), Revenue (US$ Million), Price (USD/K Unit), and Gross Margin (2021–2026)
 Table 124. CPMC Holdings Metal Can Manufacturing Product
 Table 125. CPMC Holdings Recent Developments/Updates
 Table 126. Hokkan Holdings Company Information
 Table 127. Hokkan Holdings Description and Business Overview
 Table 128. Hokkan Holdings Metal Can Manufacturing Sales (M Units), Revenue (US$ Million), Price (USD/K Unit), and Gross Margin (2021–2026)
 Table 129. Hokkan Holdings Metal Can Manufacturing Product
 Table 130. Hokkan Holdings Recent Developments/Updates
 Table 131. Showa Aluminum Can Corporation Company Information
 Table 132. Showa Aluminum Can Corporation Description and Business Overview
 Table 133. Showa Aluminum Can Corporation Metal Can Manufacturing Sales (M Units), Revenue (US$ Million), Price (USD/K Unit), and Gross Margin (2021–2026)
 Table 134. Showa Aluminum Can Corporation Metal Can Manufacturing Product
 Table 135. Showa Aluminum Can Corporation Recent Developments/Updates
 Table 136. United Can (Great China Metal) Company Information
 Table 137. United Can (Great China Metal) Description and Business Overview
 Table 138. United Can (Great China Metal) Metal Can Manufacturing Sales (M Units), Revenue (US$ Million), Price (USD/K Unit), and Gross Margin (2021–2026)
 Table 139. United Can (Great China Metal) Metal Can Manufacturing Product
 Table 140. United Can (Great China Metal) Recent Developments/Updates
 Table 141. Kingcan Holdings Company Information
 Table 142. Kingcan Holdings Description and Business Overview
 Table 143. Kingcan Holdings Metal Can Manufacturing Sales (M Units), Revenue (US$ Million), Price (USD/K Unit), and Gross Margin (2021–2026)
 Table 144. Kingcan Holdings Metal Can Manufacturing Product
 Table 145. Kingcan Holdings Recent Developments/Updates
 Table 146. Jiamei Food Packaging Company Information
 Table 147. Jiamei Food Packaging Description and Business Overview
 Table 148. Jiamei Food Packaging Metal Can Manufacturing Sales (M Units), Revenue (US$ Million), Price (USD/K Unit), and Gross Margin (2021–2026)
 Table 149. Jiamei Food Packaging Metal Can Manufacturing Product
 Table 150. Jiamei Food Packaging Recent Developments/Updates
 Table 151. Jiyuan Packaging Holdings Company Information
 Table 152. Jiyuan Packaging Holdings Description and Business Overview
 Table 153. Jiyuan Packaging Holdings Metal Can Manufacturing Sales (M Units), Revenue (US$ Million), Price (USD/K Unit), and Gross Margin (2021–2026)
 Table 154. Jiyuan Packaging Holdings Metal Can Manufacturing Product
 Table 155. Jiyuan Packaging Holdings Recent Developments/Updates
 Table 156. Trivium Company Information
 Table 157. Trivium Description and Business Overview
 Table 158. Trivium Metal Can Manufacturing Sales (M Units), Revenue (US$ Million), Price (USD/K Unit), and Gross Margin (2021–2026)
 Table 159. Trivium Metal Can Manufacturing Product
 Table 160. Trivium Recent Developments/Updates
 Table 161. Mauser Packaging Solutions(BWAY) Company Information
 Table 162. Mauser Packaging Solutions(BWAY) Description and Business Overview
 Table 163. Mauser Packaging Solutions(BWAY) Metal Can Manufacturing Sales (M Units), Revenue (US$ Million), Price (USD/K Unit), and Gross Margin (2021–2026)
 Table 164. Mauser Packaging Solutions(BWAY) Metal Can Manufacturing Product
 Table 165. Mauser Packaging Solutions(BWAY) Recent Developments/Updates
 Table 166. Colep Company Information
 Table 167. Colep Description and Business Overview
 Table 168. Colep Metal Can Manufacturing Sales (M Units), Revenue (US$ Million), Price (USD/K Unit), and Gross Margin (2021–2026)
 Table 169. Colep Metal Can Manufacturing Product
 Table 170. Colep Recent Developments/Updates
 Table 171. Staehle Company Information
 Table 172. Staehle Description and Business Overview
 Table 173. Staehle Metal Can Manufacturing Sales (M Units), Revenue (US$ Million), Price (USD/K Unit), and Gross Margin (2021–2026)
 Table 174. Staehle Metal Can Manufacturing Product
 Table 175. Staehle Recent Developments/Updates
 Table 176. Massilly Company Information
 Table 177. Massilly Description and Business Overview
 Table 178. Massilly Metal Can Manufacturing Sales (M Units), Revenue (US$ Million), Price (USD/K Unit), and Gross Margin (2021–2026)
 Table 179. Massilly Metal Can Manufacturing Product
 Table 180. Massilly Recent Developments/Updates
 Table 181. Sarten Packaging Company Information
 Table 182. Sarten Packaging Description and Business Overview
 Table 183. Sarten Packaging Metal Can Manufacturing Sales (M Units), Revenue (US$ Million), Price (USD/K Unit), and Gross Margin (2021–2026)
 Table 184. Sarten Packaging Metal Can Manufacturing Product
 Table 185. Sarten Packaging Recent Developments/Updates
 Table 186. Arnest Russia Company Information
 Table 187. Arnest Russia Description and Business Overview
 Table 188. Arnest Russia Metal Can Manufacturing Sales (M Units), Revenue (US$ Million), Price (USD/K Unit), and Gross Margin (2021–2026)
 Table 189. Arnest Russia Metal Can Manufacturing Product
 Table 190. Arnest Russia Recent Developments/Updates
 Table 191. Aeropak doo Company Information
 Table 192. Aeropak doo Description and Business Overview
 Table 193. Aeropak doo Metal Can Manufacturing Sales (M Units), Revenue (US$ Million), Price (USD/K Unit), and Gross Margin (2021–2026)
 Table 194. Aeropak doo Metal Can Manufacturing Product
 Table 195. Aeropak doo Recent Developments/Updates
 Table 196. NCI Company Information
 Table 197. NCI Description and Business Overview
 Table 198. NCI Metal Can Manufacturing Sales (M Units), Revenue (US$ Million), Price (USD/K Unit), and Gross Margin (2021–2026)
 Table 199. NCI Metal Can Manufacturing Product
 Table 200. NCI Recent Developments/Updates
 Table 201. Grupo Zapata Company Information
 Table 202. Grupo Zapata Description and Business Overview
 Table 203. Grupo Zapata Metal Can Manufacturing Sales (M Units), Revenue (US$ Million), Price (USD/K Unit), and Gross Margin (2021–2026)
 Table 204. Grupo Zapata Metal Can Manufacturing Product
 Table 205. Grupo Zapata Recent Developments/Updates
 Table 206. Hildering Company Information
 Table 207. Hildering Description and Business Overview
 Table 208. Hildering Metal Can Manufacturing Sales (M Units), Revenue (US$ Million), Price (USD/K Unit), and Gross Margin (2021–2026)
 Table 209. Hildering Metal Can Manufacturing Product
 Table 210. Hildering Recent Developments/Updates
 Table 211. Metal Press Company Information
 Table 212. Metal Press Description and Business Overview
 Table 213. Metal Press Metal Can Manufacturing Sales (M Units), Revenue (US$ Million), Price (USD/K Unit), and Gross Margin (2021–2026)
 Table 214. Metal Press Metal Can Manufacturing Product
 Table 215. Metal Press Recent Developments/Updates
 Table 216. Oriental Tin Can (OTC) Company Information
 Table 217. Oriental Tin Can (OTC) Description and Business Overview
 Table 218. Oriental Tin Can (OTC) Metal Can Manufacturing Sales (M Units), Revenue (US$ Million), Price (USD/K Unit), and Gross Margin (2021–2026)
 Table 219. Oriental Tin Can (OTC) Metal Can Manufacturing Product
 Table 220. Oriental Tin Can (OTC) Recent Developments/Updates
 Table 221. General Metal Container Corporation (GEMECO) Company Information
 Table 222. General Metal Container Corporation (GEMECO) Description and Business Overview
 Table 223. General Metal Container Corporation (GEMECO) Metal Can Manufacturing Sales (M Units), Revenue (US$ Million), Price (USD/K Unit), and Gross Margin (2021–2026)
 Table 224. General Metal Container Corporation (GEMECO) Metal Can Manufacturing Product
 Table 225. General Metal Container Corporation (GEMECO) Recent Developments/Updates
 Table 226. Kian Joo Can Factory Berhad Company Information
 Table 227. Kian Joo Can Factory Berhad Description and Business Overview
 Table 228. Kian Joo Can Factory Berhad Metal Can Manufacturing Sales (M Units), Revenue (US$ Million), Price (USD/K Unit), and Gross Margin (2021–2026)
 Table 229. Kian Joo Can Factory Berhad Metal Can Manufacturing Product
 Table 230. Kian Joo Can Factory Berhad Recent Developments/Updates
 Table 231. Swan Industries (Thailand) Limited Company Information
 Table 232. Swan Industries (Thailand) Limited Description and Business Overview
 Table 233. Swan Industries (Thailand) Limited Metal Can Manufacturing Sales (M Units), Revenue (US$ Million), Price (USD/K Unit), and Gross Margin (2021–2026)
 Table 234. Swan Industries (Thailand) Limited Metal Can Manufacturing Product
 Table 235. Swan Industries (Thailand) Limited Recent Developments/Updates
 Table 236. Lohakij Rung Chareon Sub Co., Ltd Company Information
 Table 237. Lohakij Rung Chareon Sub Co., Ltd Description and Business Overview
 Table 238. Lohakij Rung Chareon Sub Co., Ltd Metal Can Manufacturing Sales (M Units), Revenue (US$ Million), Price (USD/K Unit), and Gross Margin (2021–2026)
 Table 239. Lohakij Rung Chareon Sub Co., Ltd Metal Can Manufacturing Product
 Table 240. Lohakij Rung Chareon Sub Co., Ltd Recent Developments/Updates
 Table 241. Soonthorn Metal Industries Company Information
 Table 242. Soonthorn Metal Industries Description and Business Overview
 Table 243. Soonthorn Metal Industries Metal Can Manufacturing Sales (M Units), Revenue (US$ Million), Price (USD/K Unit), and Gross Margin (2021–2026)
 Table 244. Soonthorn Metal Industries Metal Can Manufacturing Product
 Table 245. Soonthorn Metal Industries Recent Developments/Updates
 Table 246. Standard Can Co., Ltd Company Information
 Table 247. Standard Can Co., Ltd Description and Business Overview
 Table 248. Standard Can Co., Ltd Metal Can Manufacturing Sales (M Units), Revenue (US$ Million), Price (USD/K Unit), and Gross Margin (2021–2026)
 Table 249. Standard Can Co., Ltd Metal Can Manufacturing Product
 Table 250. Standard Can Co., Ltd Recent Developments/Updates
 Table 251. Poonsub Can Co., Ltd Company Information
 Table 252. Poonsub Can Co., Ltd Description and Business Overview
 Table 253. Poonsub Can Co., Ltd Metal Can Manufacturing Sales (M Units), Revenue (US$ Million), Price (USD/K Unit), and Gross Margin (2021–2026)
 Table 254. Poonsub Can Co., Ltd Metal Can Manufacturing Product
 Table 255. Poonsub Can Co., Ltd Recent Developments/Updates
 Table 256. Asian Pacific Can Co., Ltd (APC) Company Information
 Table 257. Asian Pacific Can Co., Ltd (APC) Description and Business Overview
 Table 258. Asian Pacific Can Co., Ltd (APC) Metal Can Manufacturing Sales (M Units), Revenue (US$ Million), Price (USD/K Unit), and Gross Margin (2021–2026)
 Table 259. Asian Pacific Can Co., Ltd (APC) Metal Can Manufacturing Product
 Table 260. Asian Pacific Can Co., Ltd (APC) Recent Developments/Updates
 Table 261. Royal Can Industries Company Information
 Table 262. Royal Can Industries Description and Business Overview
 Table 263. Royal Can Industries Metal Can Manufacturing Sales (M Units), Revenue (US$ Million), Price (USD/K Unit), and Gross Margin (2021–2026)
 Table 264. Royal Can Industries Metal Can Manufacturing Product
 Table 265. Royal Can Industries Recent Developments/Updates
 Table 266. PT United Can Company (UCC) Company Information
 Table 267. PT United Can Company (UCC) Description and Business Overview
 Table 268. PT United Can Company (UCC) Metal Can Manufacturing Sales (M Units), Revenue (US$ Million), Price (USD/K Unit), and Gross Margin (2021–2026)
 Table 269. PT United Can Company (UCC) Metal Can Manufacturing Product
 Table 270. PT United Can Company (UCC) Recent Developments/Updates
 Table 271. Key Raw Materials Lists
 Table 272. Raw Materials Key Suppliers Lists
 Table 273. Metal Can Manufacturing Distributors List
 Table 274. Metal Can Manufacturing Customers List
 Table 275. Metal Can Manufacturing Market Trends
 Table 276. Metal Can Manufacturing Market Drivers
 Table 277. Metal Can Manufacturing Market Challenges
 Table 278. Metal Can Manufacturing Market Restraints
 Table 279. Research Programs/Design for This Report
 Table 280. Key Data Information from Secondary Sources
 Table 281. Key Data Information from Primary Sources
 Table 282. Authors List of This Report


List of Figures
 Figure 1. Product Picture of Metal Can Manufacturing
 Figure 2. Global Metal Can Manufacturing Market Value by Type (US$ Million), 2021–2032
 Figure 3. Global Metal Can Manufacturing Market Share by Type: 2025 & 2032
 Figure 4. Two-piece Can Product Picture
 Figure 5. Three-piece Can Product Picture
 Figure 6. Others Product Picture
 Figure 7. Global Metal Can Manufacturing Market Value by Size (US$ Million), 2021–2032
 Figure 8. Global Metal Can Manufacturing Market Share by Size: 2025 vs 2032
 Figure 9. Aluminum Cans Product Picture
 Figure 10. Steel Cans Product Picture
 Figure 11. Tin Cans Product Picture
 Figure 12. Global Metal Can Manufacturing Market Value by Application (US$ Million), 2021–2032
 Figure 13. Global Metal Can Manufacturing Market Share by Application: 2025 & 2032
 Figure 14. Food
 Figure 15. Beverage
 Figure 16. Aerosol Cans
 Figure 17. General Industrial Cans
 Figure 18. Paints/Chemicals
 Figure 19. Others
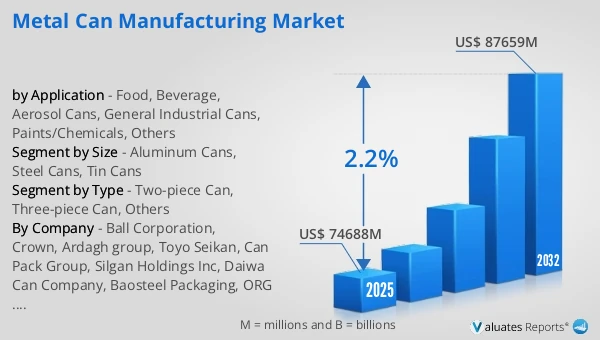
 Figure 20. Global Metal Can Manufacturing Revenue, (US$ Million), 2021 vs 2025 vs 2032
 Figure 21. Global Metal Can Manufacturing Market Size (US$ Million), 2021–2032
 Figure 22. Global Metal Can Manufacturing Sales (M Units), 2021–2032
 Figure 23. Global Metal Can Manufacturing Average Price (USD/K Unit), 2021–2032
 Figure 24. Metal Can Manufacturing Report Years Considered
 Figure 25. Metal Can Manufacturing Sales Share by Manufacturers in 2025
 Figure 26. Global Metal Can Manufacturing Revenue Share by Manufacturers in 2025
 Figure 27. Top 5 and Top 10 Global Metal Can Manufacturing Players: Market Share by Revenue in Metal Can Manufacturing in 2025
 Figure 28. Metal Can Manufacturing Market Share by Company Type (Tier 1, Tier 2, and Tier 3): 2021 vs 2025
 Figure 29. Global Metal Can Manufacturing Market Size by Region (US$ Million): 2021 vs 2025 vs 2032
 Figure 30. North America Metal Can Manufacturing Sales Market Share by Country (2021–2032)
 Figure 31. North America Metal Can Manufacturing Revenue Market Share by Country (2021–2032)
 Figure 32. United States Metal Can Manufacturing Revenue Growth Rate (US$ Million), 2021–2032
 Figure 33. Canada Metal Can Manufacturing Revenue Growth Rate (US$ Million), 2021–2032
 Figure 34. Europe Metal Can Manufacturing Sales Market Share by Country (2021–2032)
 Figure 35. Europe Metal Can Manufacturing Revenue Market Share by Country (2021–2032)
 Figure 36. Germany Metal Can Manufacturing Revenue Growth Rate (US$ Million), 2021–2032
 Figure 37. France Metal Can Manufacturing Revenue Growth Rate (US$ Million), 2021–2032
 Figure 38. U.K. Metal Can Manufacturing Revenue Growth Rate (US$ Million), 2021–2032
 Figure 39. Italy Metal Can Manufacturing Revenue Growth Rate (US$ Million), 2021–2032
 Figure 40. Russia Metal Can Manufacturing Revenue Growth Rate (US$ Million), 2021–2032
 Figure 41. Asia Pacific Metal Can Manufacturing Sales Market Share by Region (2021–2032)
 Figure 42. Asia Pacific Metal Can Manufacturing Revenue Market Share by Region (2021–2032)
 Figure 43. China Metal Can Manufacturing Revenue Growth Rate (US$ Million), 2021–2032
 Figure 44. Japan Metal Can Manufacturing Revenue Growth Rate (US$ Million), 2021–2032
 Figure 45. South Korea Metal Can Manufacturing Revenue Growth Rate (US$ Million), 2021–2032
 Figure 46. India Metal Can Manufacturing Revenue Growth Rate (US$ Million), 2021–2032
 Figure 47. Australia Metal Can Manufacturing Revenue Growth Rate (US$ Million), 2021–2032
 Figure 48. China Taiwan Metal Can Manufacturing Revenue Growth Rate (US$ Million), 2021–2032
 Figure 49. Southeast Asia Metal Can Manufacturing Revenue Growth Rate (US$ Million), 2021–2032
 Figure 50. Latin America Metal Can Manufacturing Sales Market Share by Country (2021–2032)
 Figure 51. Latin America Metal Can Manufacturing Revenue Market Share by Country (2021–2032)
 Figure 52. Mexico Metal Can Manufacturing Revenue Growth Rate (US$ Million), 2021–2032
 Figure 53. Brazil Metal Can Manufacturing Revenue Growth Rate (US$ Million), 2021–2032
 Figure 54. Argentina Metal Can Manufacturing Revenue Growth Rate (US$ Million), 2021–2032
 Figure 55. Colombia Metal Can Manufacturing Revenue Growth Rate (US$ Million), 2021–2032
 Figure 56. Middle East and Africa Metal Can Manufacturing Sales Market Share by Country (2021–2032)
 Figure 57. Middle East and Africa Metal Can Manufacturing Revenue Market Share by Country (2021–2032)
 Figure 58. Turkey Metal Can Manufacturing Revenue Growth Rate (US$ Million), 2021–2032
 Figure 59. Saudi Arabia Metal Can Manufacturing Revenue Growth Rate (US$ Million), 2021–2032
 Figure 60. UAE Metal Can Manufacturing Revenue Growth Rate (US$ Million), 2021–2032
 Figure 61. Global Sales Market Share of Metal Can Manufacturing by Type (2021–2032)
 Figure 62. Global Revenue Market Share of Metal Can Manufacturing by Type (2021–2032)
 Figure 63. Global Metal Can Manufacturing Price (USD/K Unit) by Type (2021–2032)
 Figure 64. Global Sales Market Share of Metal Can Manufacturing by Application (2021–2032)
 Figure 65. Global Revenue Market Share of Metal Can Manufacturing by Application (2021–2032)
 Figure 66. Global Metal Can Manufacturing Price (USD/K Unit) by Application (2021–2032)
 Figure 67. Metal Can Manufacturing Value Chain
 Figure 68. Channels of Distribution (Direct Vs Distribution)
 Figure 69. Bottom-up and Top-down Approaches for This Report
 Figure 70. Data Triangulation
 Figure 71. Key Executives Interviewed
SELECT A FORMAT
Added to Cart
Electronic

$2900

Single User License
Electronic

$4350

Multi User License
Electronic

$5800

Enterprise License
Add to Cart
Buy Now (15% Discount)

OUR CUSTOMER

SecuX Technology Inc

SIMILAR REPORTS