List of Tables
Table 1. Global Ground Handling Services Market Size Growth Rate by Type (US$ Million), 2019 VS 2023 VS 2030
Table 2. Key Players of Cabin service
Table 3. Key Players of Catering
Table 4. Key Players of Ramp service
Table 5. Key Players of Passenger service
Table 6. Key Players of Field operation service
Table 7. Key Players of Others
Table 8. Global Ground Handling Services Market Size Growth Rate by Application (US$ Million), 2019 VS 2023 VS 2030
Table 9. Global Ground Handling Services Market Size Growth Rate (CAGR) by Region (US$ Million): 2019 VS 2023 VS 2030
Table 10. Global Ground Handling Services Market Size by Region (2019-2024) & (US$ Million)
Table 11. Global Ground Handling Services Market Share by Region (2019-2024)
Table 12. Global Ground Handling Services Forecasted Market Size by Region (2025-2030) & (US$ Million)
Table 13. Global Ground Handling Services Market Share by Region (2025-2030)
Table 14. Ground Handling Services Market Trends
Table 15. Ground Handling Services Market Drivers
Table 16. Ground Handling Services Market Challenges
Table 17. Ground Handling Services Market Restraints
Table 18. Global Ground Handling Services Revenue by Players (2019-2024) & (US$ Million)
Table 19. Global Ground Handling Services Revenue Share by Players (2019-2024)
Table 20. Global Top Ground Handling Services by Company Type (Tier 1, Tier 2, and Tier 3) & (based on the Revenue in Ground Handling Services as of 2023)
Table 21. Global Ground Handling Services Industry Ranking 2022 VS 2023 VS 2024
Table 22. Global 5 Largest Players Market Share by Ground Handling Services Revenue (CR5 and HHI) & (2019-2024)
Table 23. Global Key Players of Ground Handling Services, Headquarters and Area Served
Table 24. Global Key Players of Ground Handling Services, Product and Application
Table 25. Global Key Players of Ground Handling Services, Product and Application
Table 26. Mergers & Acquisitions, Expansion Plans
Table 27. Global Ground Handling Services Market Size by Type (2019-2024) & (US$ Million)
Table 28. Global Ground Handling Services Revenue Market Share by Type (2019-2024)
Table 29. Global Ground Handling Services Forecasted Market Size by Type (2025-2030) & (US$ Million)
Table 30. Global Ground Handling Services Revenue Market Share by Type (2025-2030)
Table 31. Global Ground Handling Services Market Size by Application (2019-2024) & (US$ Million)
Table 32. Global Ground Handling Services Revenue Share by Application (2019-2024)
Table 33. Global Ground Handling Services Forecasted Market Size by Application (2025-2030) & (US$ Million)
Table 34. Global Ground Handling Services Revenue Share by Application (2025-2030)
Table 35. North America Ground Handling Services Market Size by Type (2019-2024) & (US$ Million)
Table 36. North America Ground Handling Services Market Size by Type (2025-2030) & (US$ Million)
Table 37. North America Ground Handling Services Market Size by Application (2019-2024) & (US$ Million)
Table 38. North America Ground Handling Services Market Size by Application (2025-2030) & (US$ Million)
Table 39. North America Ground Handling Services Growth Rate (CAGR) by Country (US$ Million): 2019 VS 2023 VS 2030
Table 40. North America Ground Handling Services Market Size by Country (2019-2024) & (US$ Million)
Table 41. North America Ground Handling Services Market Size by Country (2025-2030) & (US$ Million)
Table 42. Europe Ground Handling Services Market Size by Type (2019-2024) & (US$ Million)
Table 43. Europe Ground Handling Services Market Size by Type (2025-2030) & (US$ Million)
Table 44. Europe Ground Handling Services Market Size by Application (2019-2024) & (US$ Million)
Table 45. Europe Ground Handling Services Market Size by Application (2025-2030) & (US$ Million)
Table 46. Europe Ground Handling Services Growth Rate (CAGR) by Country (US$ Million): 2019 VS 2023 VS 2030
Table 47. Europe Ground Handling Services Market Size by Country (2019-2024) & (US$ Million)
Table 48. Europe Ground Handling Services Market Size by Country (2025-2030) & (US$ Million)
Table 49. China Ground Handling Services Market Size by Type (2019-2024) & (US$ Million)
Table 50. China Ground Handling Services Market Size by Type (2025-2030) & (US$ Million)
Table 51. China Ground Handling Services Market Size by Application (2019-2024) & (US$ Million)
Table 52. China Ground Handling Services Market Size by Application (2025-2030) & (US$ Million)
Table 53. Asia Ground Handling Services Market Size by Type (2019-2024) & (US$ Million)
Table 54. Asia Ground Handling Services Market Size by Type (2025-2030) & (US$ Million)
Table 55. Asia Ground Handling Services Market Size by Application (2019-2024) & (US$ Million)
Table 56. Asia Ground Handling Services Market Size by Application (2025-2030) & (US$ Million)
Table 57. Asia Ground Handling Services Growth Rate (CAGR) by Region (US$ Million): 2019 VS 2023 VS 2030
Table 58. Asia Ground Handling Services Market Size by Region (2019-2024) & (US$ Million)
Table 59. Asia Ground Handling Services Market Size by Region (2025-2030) & (US$ Million)
Table 60. Middle East, Africa, and Latin America Ground Handling Services Market Size by Type (2019-2024) & (US$ Million)
Table 61. Middle East, Africa, and Latin America Ground Handling Services Market Size by Type (2025-2030) & (US$ Million)
Table 62. Middle East, Africa, and Latin America Ground Handling Services Market Size by Application (2019-2024) & (US$ Million)
Table 63. Middle East, Africa, and Latin America Ground Handling Services Market Size by Application (2025-2030) & (US$ Million)
Table 64. Middle East, Africa, and Latin America Ground Handling Services Growth Rate (CAGR) by Country (US$ Million): 2019 VS 2023 VS 2030
Table 65. Middle East, Africa, and Latin America Ground Handling Services Market Size by Country (2019-2024) & (US$ Million)
Table 66. Middle East, Africa, and Latin America Ground Handling Services Market Size by Country (2025-2030) & (US$ Million)
Table 67. Mallaghan Company Details
Table 68. Mallaghan Business Overview
Table 69. Mallaghan Ground Handling Services Product
Table 70. Mallaghan Revenue in Ground Handling Services Business (2019-2024) & (US$ Million)
Table 71. Mallaghan Recent Developments
Table 72. Cavotec Company Details
Table 73. Cavotec Business Overview
Table 74. Cavotec Ground Handling Services Product
Table 75. Cavotec Revenue in Ground Handling Services Business (2019-2024) & (US$ Million)
Table 76. Cavotec Recent Developments
Table 77. JBT Corporation Company Details
Table 78. JBT Corporation Business Overview
Table 79. JBT Corporation Ground Handling Services Product
Table 80. JBT Corporation Revenue in Ground Handling Services Business (2019-2024) & (US$ Million)
Table 81. JBT Corporation Recent Developments
Table 82. Cargotec Company Details
Table 83. Cargotec Business Overview
Table 84. Cargotec Ground Handling Services Product
Table 85. Cargotec Revenue in Ground Handling Services Business (2019-2024) & (US$ Million)
Table 86. Cargotec Recent Developments
Table 87. SAAB Group Company Details
Table 88. SAAB Group Business Overview
Table 89. SAAB Group Ground Handling Services Product
Table 90. SAAB Group Revenue in Ground Handling Services Business (2019-2024) & (US$ Million)
Table 91. SAAB Group Recent Developments
Table 92. Beumer Group Company Details
Table 93. Beumer Group Business Overview
Table 94. Beumer Group Ground Handling Services Product
Table 95. Beumer Group Revenue in Ground Handling Services Business (2019-2024) & (US$ Million)
Table 96. Beumer Group Recent Developments
Table 97. Weihai Guangtai Airports Equipment Company Details
Table 98. Weihai Guangtai Airports Equipment Business Overview
Table 99. Weihai Guangtai Airports Equipment Ground Handling Services Product
Table 100. Weihai Guangtai Airports Equipment Revenue in Ground Handling Services Business (2019-2024) & (US$ Million)
Table 101. Weihai Guangtai Airports Equipment Recent Developments
Table 102. Aviapartner Company Details
Table 103. Aviapartner Business Overview
Table 104. Aviapartner Ground Handling Services Product
Table 105. Aviapartner Revenue in Ground Handling Services Business (2019-2024) & (US$ Million)
Table 106. Aviapartner Recent Developments
Table 107. TAV Airports Holding Co. Company Details
Table 108. TAV Airports Holding Co. Business Overview
Table 109. TAV Airports Holding Co. Ground Handling Services Product
Table 110. TAV Airports Holding Co. Revenue in Ground Handling Services Business (2019-2024) & (US$ Million)
Table 111. TAV Airports Holding Co. Recent Developments
Table 112. Skyplan Services Limited Company Details
Table 113. Skyplan Services Limited Business Overview
Table 114. Skyplan Services Limited Ground Handling Services Product
Table 115. Skyplan Services Limited Revenue in Ground Handling Services Business (2019-2024) & (US$ Million)
Table 116. Skyplan Services Limited Recent Developments
Table 117. Aerospace Jet Company Details
Table 118. Aerospace Jet Business Overview
Table 119. Aerospace Jet Ground Handling Services Product
Table 120. Aerospace Jet Revenue in Ground Handling Services Business (2019-2024) & (US$ Million)
Table 121. Aerospace Jet Recent Developments
Table 122. AFS Ground Support Company Details
Table 123. AFS Ground Support Business Overview
Table 124. AFS Ground Support Ground Handling Services Product
Table 125. AFS Ground Support Revenue in Ground Handling Services Business (2019-2024) & (US$ Million)
Table 126. AFS Ground Support Recent Developments
Table 127. Vision Aviation Global Company Details
Table 128. Vision Aviation Global Business Overview
Table 129. Vision Aviation Global Ground Handling Services Product
Table 130. Vision Aviation Global Revenue in Ground Handling Services Business (2019-2024) & (US$ Million)
Table 131. Vision Aviation Global Recent Developments
Table 132. Belau Transfer and Terminal Company Details
Table 133. Belau Transfer and Terminal Business Overview
Table 134. Belau Transfer and Terminal Ground Handling Services Product
Table 135. Belau Transfer and Terminal Revenue in Ground Handling Services Business (2019-2024) & (US$ Million)
Table 136. Belau Transfer and Terminal Recent Developments
Table 137. AN Aviation services CO. Company Details
Table 138. AN Aviation services CO. Business Overview
Table 139. AN Aviation services CO. Ground Handling Services Product
Table 140. AN Aviation services CO. Revenue in Ground Handling Services Business (2019-2024) & (US$ Million)
Table 141. AN Aviation services CO. Recent Developments
Table 142. AvJet International (FZE) Company Details
Table 143. AvJet International (FZE) Business Overview
Table 144. AvJet International (FZE) Ground Handling Services Product
Table 145. AvJet International (FZE) Revenue in Ground Handling Services Business (2019-2024) & (US$ Million)
Table 146. AvJet International (FZE) Recent Developments
Table 147. Proground GmbH Company Details
Table 148. Proground GmbH Business Overview
Table 149. Proground GmbH Ground Handling Services Product
Table 150. Proground GmbH Revenue in Ground Handling Services Business (2019-2024) & (US$ Million)
Table 151. Proground GmbH Recent Developments
Table 152. Myanmar National Airlines Company Details
Table 153. Myanmar National Airlines Business Overview
Table 154. Myanmar National Airlines Ground Handling Services Product
Table 155. Myanmar National Airlines Revenue in Ground Handling Services Business (2019-2024) & (US$ Million)
Table 156. Myanmar National Airlines Recent Developments
Table 157. Aero Specialties Company Details
Table 158. Aero Specialties Business Overview
Table 159. Aero Specialties Ground Handling Services Product
Table 160. Aero Specialties Revenue in Ground Handling Services Business (2019-2024) & (US$ Million)
Table 161. Aero Specialties Recent Developments
Table 162. Bharat Earth Movers Company Details
Table 163. Bharat Earth Movers Business Overview
Table 164. Bharat Earth Movers Ground Handling Services Product
Table 165. Bharat Earth Movers Revenue in Ground Handling Services Business (2019-2024) & (US$ Million)
Table 166. Bharat Earth Movers Recent Developments
Table 167. Oceania Aviation Company Details
Table 168. Oceania Aviation Business Overview
Table 169. Oceania Aviation Ground Handling Services Product
Table 170. Oceania Aviation Revenue in Ground Handling Services Business (2019-2024) & (US$ Million)
Table 171. Oceania Aviation Recent Developments
Table 172. Bliss-Fox Ground Support Equipment Company Details
Table 173. Bliss-Fox Ground Support Equipment Business Overview
Table 174. Bliss-Fox Ground Support Equipment Ground Handling Services Product
Table 175. Bliss-Fox Ground Support Equipment Revenue in Ground Handling Services Business (2019-2024) & (US$ Million)
Table 176. Bliss-Fox Ground Support Equipment Recent Developments
Table 177. Gate Company Details
Table 178. Gate Business Overview
Table 179. Gate Ground Handling Services Product
Table 180. Gate Revenue in Ground Handling Services Business (2019-2024) & (US$ Million)
Table 181. Gate Recent Developments
Table 182. Research Programs/Design for This Report
Table 183. Key Data Information from Secondary Sources
Table 184. Key Data Information from Primary Sources
List of Figures
Figure 1. Global Ground Handling Services Market Size Growth Rate by Type, 2019 VS 2023 VS 2030 (US$ Million)
Figure 2. Global Ground Handling Services Market Share by Type: 2023 VS 2030
Figure 3. Cabin service Features
Figure 4. Catering Features
Figure 5. Ramp service Features
Figure 6. Passenger service Features
Figure 7. Field operation service Features
Figure 8. Others Features
Figure 9. Global Ground Handling Services Market Size Growth Rate by Application, 2019 VS 2023 VS 2030 (US$ Million)
Figure 10. Global Ground Handling Services Market Share by Application: 2023 VS 2030
Figure 11. Civil Case Studies
Figure 12. Military Case Studies
Figure 13. Ground Handling Services Report Years Considered
Figure 14. Global Ground Handling Services Market Size (US$ Million), Year-over-Year: 2019-2030
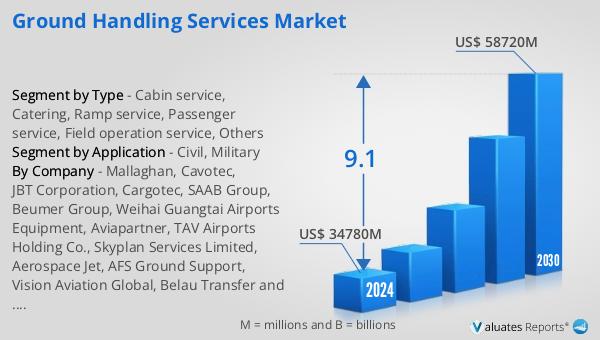
Figure 15. Global Ground Handling Services Market Size, (US$ Million), 2019 VS 2023 VS 2030
Figure 16. Global Ground Handling Services Market Share by Region: 2023 VS 2030
Figure 17. Global Ground Handling Services Market Share by Players in 2023
Figure 18. Global Top Ground Handling Services Players by Company Type (Tier 1, Tier 2, and Tier 3) & (based on the Revenue in Ground Handling Services as of 2023)
Figure 19. The Top 10 and 5 Players Market Share by Ground Handling Services Revenue in 2023
Figure 20. North America Ground Handling Services Market Size YoY Growth (2019-2030) & (US$ Million)
Figure 21. North America Ground Handling Services Market Share by Type (2019-2030)
Figure 22. North America Ground Handling Services Market Share by Application (2019-2030)
Figure 23. North America Ground Handling Services Market Share by Country (2019-2030)
Figure 24. United States Ground Handling Services Market Size YoY Growth (2019-2030) & (US$ Million)
Figure 25. Canada Ground Handling Services Market Size YoY Growth (2019-2030) & (US$ Million)
Figure 26. Europe Ground Handling Services Market Size YoY (2019-2030) & (US$ Million)
Figure 27. Europe Ground Handling Services Market Share by Type (2019-2030)
Figure 28. Europe Ground Handling Services Market Share by Application (2019-2030)
Figure 29. Europe Ground Handling Services Market Share by Country (2019-2030)
Figure 30. Germany Ground Handling Services Market Size YoY Growth (2019-2030) & (US$ Million)
Figure 31. France Ground Handling Services Market Size YoY Growth (2019-2030) & (US$ Million)
Figure 32. U.K. Ground Handling Services Market Size YoY Growth (2019-2030) & (US$ Million)
Figure 33. Italy Ground Handling Services Market Size YoY Growth (2019-2030) & (US$ Million)
Figure 34. Russia Ground Handling Services Market Size YoY Growth (2019-2030) & (US$ Million)
Figure 35. Nordic Countries Ground Handling Services Market Size YoY Growth (2019-2030) & (US$ Million)
Figure 36. China Ground Handling Services Market Size YoY (2019-2030) & (US$ Million)
Figure 37. China Ground Handling Services Market Share by Type (2019-2030)
Figure 38. China Ground Handling Services Market Share by Application (2019-2030)
Figure 39. Asia Ground Handling Services Market Size YoY (2019-2030) & (US$ Million)
Figure 40. Asia Ground Handling Services Market Share by Type (2019-2030)
Figure 41. Asia Ground Handling Services Market Share by Application (2019-2030)
Figure 42. Asia Ground Handling Services Market Share by Region (2019-2030)
Figure 43. Japan Ground Handling Services Market Size YoY Growth (2019-2030) & (US$ Million)
Figure 44. South Korea Ground Handling Services Market Size YoY Growth (2019-2030) & (US$ Million)
Figure 45. China Taiwan Ground Handling Services Market Size YoY Growth (2019-2030) & (US$ Million)
Figure 46. Southeast Asia Ground Handling Services Market Size YoY Growth (2019-2030) & (US$ Million)
Figure 47. India Ground Handling Services Market Size YoY Growth (2019-2030) & (US$ Million)
Figure 48. Australia Ground Handling Services Market Size YoY Growth (2019-2030) & (US$ Million)
Figure 49. Middle East, Africa, and Latin America Ground Handling Services Market Size YoY (2019-2030) & (US$ Million)
Figure 50. Middle East, Africa, and Latin America Ground Handling Services Market Share by Type (2019-2030)
Figure 51. Middle East, Africa, and Latin America Ground Handling Services Market Share by Application (2019-2030)
Figure 52. Middle East, Africa, and Latin America Ground Handling Services Market Share by Country (2019-2030)
Figure 53. Brazil Ground Handling Services Market Size YoY Growth (2019-2030) & (US$ Million)
Figure 54. Mexico Ground Handling Services Market Size YoY Growth (2019-2030) & (US$ Million)
Figure 55. Turkey Ground Handling Services Market Size YoY Growth (2019-2030) & (US$ Million)
Figure 56. Saudi Arabia Ground Handling Services Market Size YoY Growth (2019-2030) & (US$ Million)
Figure 57. Israel Ground Handling Services Market Size YoY Growth (2019-2030) & (US$ Million)
Figure 58. GCC Countries Ground Handling Services Market Size YoY Growth (2019-2030) & (US$ Million)
Figure 59. Mallaghan Revenue Growth Rate in Ground Handling Services Business (2019-2024)
Figure 60. Cavotec Revenue Growth Rate in Ground Handling Services Business (2019-2024)
Figure 61. JBT Corporation Revenue Growth Rate in Ground Handling Services Business (2019-2024)
Figure 62. Cargotec Revenue Growth Rate in Ground Handling Services Business (2019-2024)
Figure 63. SAAB Group Revenue Growth Rate in Ground Handling Services Business (2019-2024)
Figure 64. Beumer Group Revenue Growth Rate in Ground Handling Services Business (2019-2024)
Figure 65. Weihai Guangtai Airports Equipment Revenue Growth Rate in Ground Handling Services Business (2019-2024)
Figure 66. Aviapartner Revenue Growth Rate in Ground Handling Services Business (2019-2024)
Figure 67. TAV Airports Holding Co. Revenue Growth Rate in Ground Handling Services Business (2019-2024)
Figure 68. Skyplan Services Limited Revenue Growth Rate in Ground Handling Services Business (2019-2024)
Figure 69. Aerospace Jet Revenue Growth Rate in Ground Handling Services Business (2019-2024)
Figure 70. AFS Ground Support Revenue Growth Rate in Ground Handling Services Business (2019-2024)
Figure 71. Vision Aviation Global Revenue Growth Rate in Ground Handling Services Business (2019-2024)
Figure 72. Belau Transfer and Terminal Revenue Growth Rate in Ground Handling Services Business (2019-2024)
Figure 73. AN Aviation services CO. Revenue Growth Rate in Ground Handling Services Business (2019-2024)
Figure 74. AvJet International (FZE) Revenue Growth Rate in Ground Handling Services Business (2019-2024)
Figure 75. Proground GmbH Revenue Growth Rate in Ground Handling Services Business (2019-2024)
Figure 76. Myanmar National Airlines Revenue Growth Rate in Ground Handling Services Business (2019-2024)
Figure 77. Aero Specialties Revenue Growth Rate in Ground Handling Services Business (2019-2024)
Figure 78. Bharat Earth Movers Revenue Growth Rate in Ground Handling Services Business (2019-2024)
Figure 79. Oceania Aviation Revenue Growth Rate in Ground Handling Services Business (2019-2024)
Figure 80. Bliss-Fox Ground Support Equipment Revenue Growth Rate in Ground Handling Services Business (2019-2024)
Figure 81. Gate Revenue Growth Rate in Ground Handling Services Business (2019-2024)
Figure 82. Bottom-up and Top-down Approaches for This Report
Figure 83. Data Triangulation
Figure 84. Key Executives Interviewed