Transparent Ceramic Spinel Market Size
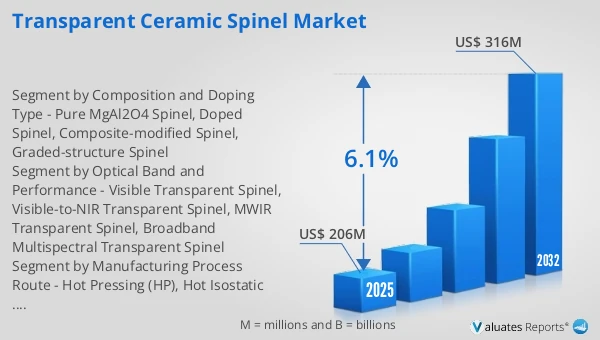
The global Transparent Ceramic Spinel market was valued at US$ 206 million in 2025 and is anticipated to reach US$ 316 million by 2032, at a CAGR of 6.1% from 2026 to 2032.
Transparent Ceramic Spinel Market
The 2025 U.S. tariff policies introduce profound uncertainty into the global economic landscape. This report critically examines the implications of recent tariff adjustments and international strategic countermeasures on Transparent Ceramic Spinel competitive dynamics, regional economic interdependencies, and supply chain reconfigurations.
In 2025, the global output of Transparent Ceramic Spinel reached 165 tons, with an average selling price of USD 1.25 million/ton, production capacity of 220 tons, and a gross margin of 52%.
Transparent ceramic spinel typically refers to an advanced transparent ceramic material based on magnesium aluminate spinel (MgAl₂O₄), manufactured through high-density sintering and optical-grade polishing to achieve high transmittance from the visible to infrared spectral range. It combines high hardness, wear resistance, thermal shock resistance, and strong environmental stability, enabling the fabrication of optical windows, domes, IR windows, and transparent armor components. It is widely used in defense and security (EO/IR sensing and guidance), infrared imaging, laser systems, and high-end industrial viewing applications.
The transparent ceramic spinel market is characterized by high entry barriers, small-batch production, and high pricing. Demand is primarily driven by defense electro-optics, IR windows, and upgrades in transparent protection, with additional structural penetration into civilian applications such as high-end industrial viewing windows. On the supply side, extremely strict requirements on powder purity, densification control during sintering, defect suppression, and optical-grade finishing yield limit the number of suppliers capable of scalable mass production, resulting in relatively high market concentration. With growing needs for multispectral imaging, lightweight IR systems, and performance upgrades in transparent armor, products are evolving toward larger sizes, higher transmittance, and better consistency, keeping the market largely driven by premium applications.
This report delivers a comprehensive overview of the global Transparent Ceramic Spinel market, with both quantitative and qualitative analyses, to help readers develop growth strategies, assess the competitive landscape, evaluate their position in the current market, and make informed business decisions regarding Transparent Ceramic Spinel. The Transparent Ceramic Spinel market size, estimates, and forecasts are provided in terms of output/shipments (Kiloton) and revenue (US$ millions), with 2025 as the base year and historical and forecast data for 2021–2032.
The report segments the global Transparent Ceramic Spinel market comprehensively. Regional market sizes by Type, by Application, by Composition and Doping Type, and by company are also provided. For deeper insight, the report profiles the competitive landscape, key competitors, and their respective market rankings, and discusses technological trends and new product developments.
This report will assist Transparent Ceramic Spinel manufacturers, new entrants, and companies across the industry value chain with information on revenues, production, and average prices for the overall market and its sub-segments, by company, by Type, by Application, and by region.
Market Segmentation
Scope of Transparent Ceramic Spinel Market Report
| Report Metric |
Details |
| Report Name |
Transparent Ceramic Spinel Market |
| Accounted market size in 2025 |
US$ 206 million |
| Forecasted market size in 2032 |
US$ 316 million |
| CAGR |
6.1% |
| Base Year |
2025 |
| Forecasted years |
2026 - 2032 |
| Segment by Type |
- Monocrystalline
- Polycrystalline
- Others
|
| Segment by Composition and Doping Type |
- Pure MgAl2O4 Spinel
- Doped Spinel
- Composite-modified Spinel
- Graded-structure Spinel
|
| Segment by Manufacturing Process Route |
- Hot Pressing (HP)
- Hot Isostatic Pressing (HIP)
- Spark Plasma Sintering (SPS)
- Pressureless Sintering
|
| Segment by Optical Band and Performance |
- Visible Transparent Spinel
- Visible-to-NIR Transparent Spinel
- MWIR Transparent Spinel
- Broadband Multispectral Transparent Spinel
|
| by Application |
- Optics
- Electronics
- Military
- Other
|
| Production by Region |
- North America
- Europe
- China
- Japan
|
| Consumption by Region |
- North America (United States, Canada)
- Europe (Germany, France, UK, Italy, Russia)
- Asia-Pacific (China, Japan, South Korea, Taiwan)
- Southeast Asia (India)
- Latin America (Mexico, Brazil)
|
| By Company |
Surmet, CeraNova, Ceramtec-Etec, Luoyang Cen-Lon Creamics |
| Forecast units |
USD million in value |
| Report coverage |
Revenue and volume forecast, company share, competitive landscape, growth factors and trends |
Chapter Outline
- Chapter 1: Defines the scope of the report and presents an executive summary of market segments (by Type, by Application, by Composition and Doping Type, etc.), including the size of each segment and its future growth potential. It offers a high-level view of the current market and its likely evolution in the short, medium, and long term.
- Chapter 2: Provides a detailed analysis of the competitive landscape for Transparent Ceramic Spinel manufacturers, including prices, production, value-based market shares, latest development plans, and information on mergers and acquisitions.
- Chapter 3: Examines Transparent Ceramic Spinel production/output and value by region and country, providing a quantitative assessment of market size and growth potential for each region over the next six years.
- Chapter 4: Analyzes Transparent Ceramic Spinel consumption at the regional and country levels. It quantifies market size and growth potential for each region and its key countries, and outlines market development, outlook, addressable space, and national production.
- Chapter 5: Analyzes market segments by Type, covering the size and growth potential of each segment to help readers identify “blue ocean” opportunities.
- Chapter 6: Analyzes market segments by Application, covering the size and growth potential of each segment to help readers identify “blue ocean” opportunities in downstream markets.
- Chapter 7: Profiles key players, detailing the fundamentals of major companies, including product production/output, value, price, gross margin, product portfolio/introductions, and recent developments.
- Chapter 8: Reviews the industry value chain, including upstream and downstream segments.
- Chapter 9: Discusses market dynamics and recent developments, including drivers, restraints, challenges and risks for manufacturers, U.S. Tariffs and relevant policy analysis.
- Chapter 10: Summarizes the key findings and conclusions of the report.
FAQ for this report
How fast is Transparent Ceramic Spinel Market growing?
Ans: The Transparent Ceramic Spinel Market witnessing a CAGR of 6.1% during the forecast period 2026-2032.
What is the Transparent Ceramic Spinel Market size in 2032?
Ans: The Transparent Ceramic Spinel Market size in 2032 will be US$ 316 million.
Who are the main players in the Transparent Ceramic Spinel Market report?
Ans: The main players in the Transparent Ceramic Spinel Market are Surmet, CeraNova, Ceramtec-Etec, Luoyang Cen-Lon Creamics
What are the Application segmentation covered in the Transparent Ceramic Spinel Market report?
Ans: The Applications covered in the Transparent Ceramic Spinel Market report are Optics, Electronics, Military, Other
What are the Type segmentation covered in the Transparent Ceramic Spinel Market report?
Ans: The Types covered in the Transparent Ceramic Spinel Market report are Pure MgAl2O4 Spinel, Doped Spinel, Composite-modified Spinel, Graded-structure Spinel

