0
U.S. (TOLL FREE)
+1 (315) 215-3225
Automative

0
U.S. (TOLL FREE)
+1 (315) 215-3225
Gummy Vitamin Market Size, Manufacturers, Supply Chain, Sales Channel and Clients, 2021-2027
Published Date: July 2021
|
Report Code: QYRE-Auto-30V378
Home | Market Reports | Health| Nutrition| Vitamins & Supplements
Global Gummy Vitamin Market Size Manufacturers Supply Chain Sales Channel and Clients 2021 2027
BUY CHAPTERS

Gummy Vitamin Market Size, Manufacturers, Supply Chain, Sales Channel and Clients, 2021-2027

Code: QYRE-Auto-30V378
Report
July 2021
Pages:121
QYResearch
Buy Now with 15% Discount
DESCRIPTION
TABLE OF CONTENT
TABLES & FIGURES

Gummy Vitamins Market 

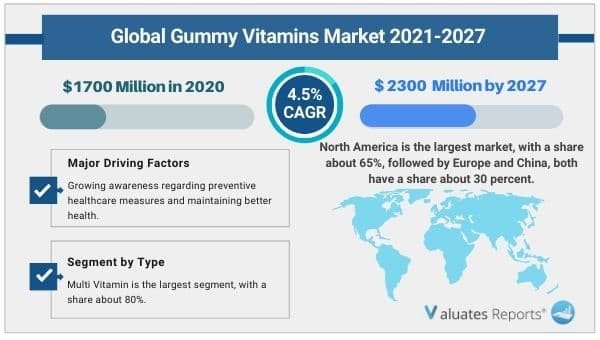
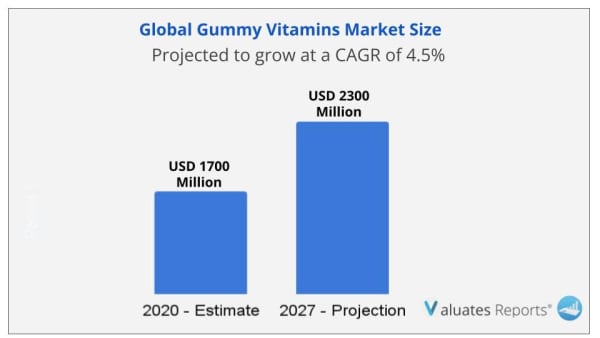
In 2020, the global Gummy Vitamin market size was US$ 1700 million and it is expected to reach US$ 2300 million by the end of 2027, with a CAGR of 4.5% during 2021-2027.

Major Trends in Gummy Vitamins Market 

The rising demand for nutritional supplements that can be used on the go as a result of busier work schedules and rising health awareness are major factors driving the Gummy Vitamin Market. The Gummy Vitamin Market is expected to expand in the upcoming years due to factors such as easy swallowability, variety, flavor, the convenience of usage, and pill weariness difficulties. The use of gummy vitamins will expand due to the rise in vitamin deficiencies, dysphagia, and the demand for preventative healthcare measures, which will accelerate the Gummy Vitamin Market expansion over the course of the projection period. 

 
gummy vitamins market

Trends Influencing the Global Gummy Vitamins Market

Gummy vitamins are sweet-tasting and come in a variety of sizes, colors, forms, and flavors. They also have a pleasing appearance and are simple to swallow. The customer gives convenience a lot of consideration while making purchases. In addition, individuals are sick of taking excessive amounts of pills, tablets, and medications. They do not want to continue taking prescription medications every day, which causes pill weariness, especially among the elderly population. Therefore, gummy vitamins are a good solution for delivering nourishment in a sweet, enjoyable manner. In the upcoming years, the market for gummy vitamins is anticipated to expand due to how simple they are to use. Customers are switching to more practical, healthier solutions.

gummy vitamins market size

The need for multivitamin supplements has increased due to the rising vitamin deficit in the world. Gummy vitamin candies are a convenient way for people to supplement their diets if they avoid particular foods or have problems absorbing nutrients. Dysphagia's rising prevalence is also helping the market grow since it increases demand because people with chronic medical problems have trouble swallowing. As a result, the Gummy Vitamin Market is anticipated to rise rapidly over the study period. 

Consumers are becoming more proactive in preserving their well-being, and there is an increasing emphasis on health and wellness on a worldwide scale. Gummy vitamins are popular with health-conscious people because they provide an easy and fun method to add important nutrients to their diets. The market for gummy vitamins is being driven by the rising knowledge of the value of vitamins and minerals for general health. Furthermore, In terms of flavors, formulations, and component combinations, the industry has witnessed substantial product innovation. Gummy vitamins are being introduced by manufacturers to address certain health issues, such as immune support, bone health, and pregnancy care. A larger customer base is drawn in by this product innovation and variety, which together with the use of natural and organic components promote market expansion.

 
indonesia gummy vitamins market size

Gummy Vitamins Market Share Analysis 

Based on region, North America holds a 65% market share for gummy vitamins, followed by China and Europe, each with a combined 30% market share.  Gummy vitamins have a sizable market in North America, which consists of the United States and Canada. The high level of well-being consciousness in the area, the influence of wellness trends, and the demand for portable supplement formats all support market expansion. Major companies and large distribution networks are further market drivers. Additionally, regulatory frameworks that permit the marketing of nutritional supplements aid in the expansion of the North American gummy vitamin market.

Within the Gummy Vitamin Market, the children segment is a significant and important market. Gummy vitamins created especially for kids have become increasingly popular as a result of their tasty flavor, brilliant colors, and entertaining forms, which make them more appealing to kids.

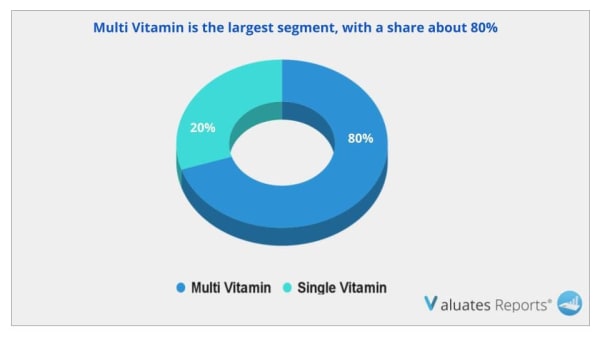
Multivitamins make up the biggest product-based sector, accounting for 80% of sales. By combining a variety of necessary vitamins and minerals in a single dose, multivitamin gummies provide a handy approach for people to achieve their daily nutritional needs.

 gummy vitamins market segmentation


Gummy Vitamins Market Segmentation 

By Type

  • Multi Vitamin
  • Single Vitamin

By Application

  • For Children
  • For Adult

By Region

  • North America
  • United States
  • Canada
  • Asia-Pacific
  • China
  • Japan
  • South Korea
  • India
  • Southeast Asia
  • Australia
  • Rest of Asia-Pacific
  • Europe
  • Germany
  • France
  • UK.
  • Italy
  • Russia
  • Nordic Countries
  • Rest of Europe
  • Latin America
  • Mexico
  • Brazil
  • Rest of Latin America
  • Middle East & Africa
  • Turkey
  • Saudi Arabia
  • UAE
  • Rest of MEA 

Key Companies

  • Gummy Vitamins
  • Bayer
  • Church & Dwight Co
  • Pharmavite
  • Nature’s Way
  • Smarty Pants Vitamins
  • Hero Nutritionals
  • Nature’s Bounty, Inc
  • Life Science Nutritionals
  • Rainbow Light
  • Herbaland
  • Olly Nutrition.

Scope of Gumy Vitamins Market Report

Report Metric Details
Report Name Gummy Vitamins Market
The market size in 2020 USD 1700 Million
The revenue forecast in 2027 USD 2300 Million
Growth Rate CAGR of 4.5%
Market size available for years 2021-2027
Forecast units Value (USD)
Segments covered Type, Application, Industry, Regions
Report coverage Revenue & volume forecast, company share, competitive landscape, growth factors, and trends
Geographic regions covered North America, Europe, Asia Pacific, Latin America, Middle East & Africa
 

Frequently Asked Questions About This Report

1. How big is the Gummy Vitamins Market?

Ans. In 2020, the global Gummy Vitamin market size was US$ 1700 million and it is expected to reach US$ 2300 million by the end of 2027, with a CAGR of 4.5% during 2021-2027.

2. How big is the Indonesia Gummy Vitamins Market?

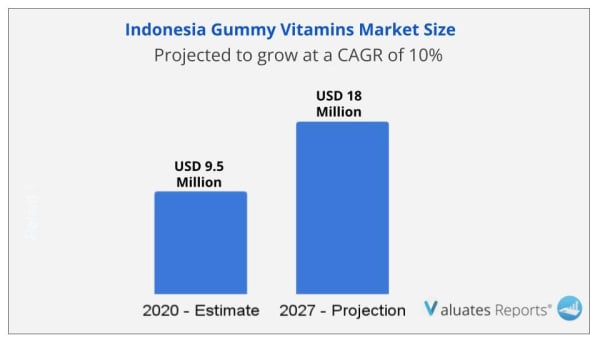
Ans. In Indonesia, the Gummy Vitamin market size is expected to grow from US$ 9.5 million in 2020 to US$ 18 million by 2027, at a CAGR of 10% during the forecast period.

3. Who are the major key players in the Gummy vitamins market?

Ans. Global Gummy Vitamin key players include Bayer, Church & Dwight Co, Pharmavite, etc. Global top three manufacturers hold a share about 30%.

4. Which region holds largest market share in the Gummy vitamins market?

Ans. North America is the largest market, with a share about 65%, followed by Europe and China, both have a share about 30 percent.

5. Which segment holds largest market share in the Gummy vitamins market?

Ans. Multi Vitamin is the largest segment, with a share about 80%

6. Which is the largest application in the Gummy vitamins market?

Ans. In terms of application, the largest application is For Children, followed by For Adult.

7. Does the report provides covid-19 impact analysis?

Ans. Yes, the report includes a COVID-19 impact analysis. Also, it is further extended into every individual segment of the report.

 
1 Study Coverage
1.1 Gummy Vitamin Product Introduction
1.2 Market by Type
1.2.1 Global Gummy Vitamin Market Size Growth Rate by Type
1.2.2 Multi Vitamin
1.2.3 Single Vitamin
1.3 Market by Application
1.3.1 Global Gummy Vitamin Market Size Growth Rate by Application
1.3.2 For Children
1.3.3 For Adult
1.4 Study Objectives
1.5 Years Considered
2 Executive Summary
2.1 Global Gummy Vitamin Market Size Estimates and Forecasts
2.1.1 Global Gummy Vitamin Revenue 2016-2027
2.1.2 Global Gummy Vitamin Sales 2016-2027
2.2 Gummy Vitamin Market Size by Region: 2021 Versus 2027
2.3 Gummy Vitamin Sales by Region (2016-2027)
2.3.1 Global Gummy Vitamin Sales by Region: 2016-2021
2.3.2 Global Gummy Vitamin Sales Forecast by Region (2022-2027)
2.3.3 Global Gummy Vitamin Sales Market Share by Region (2016-2027)
2.4 Gummy Vitamin Market Estimates and Projections by Region (2022-2027)
2.4.1 Global Gummy Vitamin Revenue by Region: 2016-2021
2.4.2 Global Gummy Vitamin Revenue Forecast by Region (2022-2027)
2.4.3 Global Gummy Vitamin Revenue Market Share by Region (2016-2027)
3 Global Gummy Vitamin by Manufacturers
3.1 Global Top Gummy Vitamin Manufacturers by Sales
3.1.1 Global Gummy Vitamin Sales by Manufacturer (2016-2021)
3.1.2 Global Gummy Vitamin Sales Market Share by Manufacturer (2016-2021)
3.2 Global Top Gummy Vitamin Manufacturers by Revenue
3.2.1 Global Gummy Vitamin Revenue by Manufacturer (2016-2021)
3.2.2 Global Gummy Vitamin Revenue Share by Manufacturer (2016-2021)
3.3 Global Gummy Vitamin Price by Manufacturer (2016-2021)
3.4 Competitive Landscape
3.4.1 Key Gummy Vitamin Manufacturers Covered: Ranking by Revenue
3.4.2 Global Gummy Vitamin Market Concentration Ratio (CR5 and HHI) & (2016-2021)
3.4.3 Global Gummy Vitamin Market Share by Company Type (Tier 1, Tier 2 and Tier 3)
3.5 Global Gummy Vitamin Manufacturing Base Distribution, Product Type
3.5.1 Gummy Vitamin Manufacturers Manufacturing Base Distribution, Headquarters
3.5.2 Manufacturers Gummy Vitamin Product Type
3.5.3 Date of International Manufacturers Enter into Gummy Vitamin Market
3.6 Manufacturers Mergers & Acquisitions, Expansion Plans
4 Company Profiles
4.1 Gummy Vitamins
4.1.1 Gummy Vitamins Corporation Information
4.1.2 Gummy Vitamins Description, Business Overview
4.1.3 Gummy Vitamins Gummy Vitamin Products Offered
4.1.4 Gummy Vitamins Gummy Vitamin Sales, Revenue and Gross Margin (2016-2021)
4.1.5 Gummy Vitamins Gummy Vitamin Revenue by Product
4.1.6 Gummy Vitamins Gummy Vitamin Revenue by Application
4.1.7 Gummy Vitamins Gummy Vitamin Revenue by Geographic Area
4.1.8 Gummy Vitamins Gummy Vitamin Revenue by Sales Channel
4.1.9 Gummy Vitamins Recent Development
4.2 Bayer
4.2.1 Bayer Corporation Information
4.2.2 Bayer Description, Business Overview
4.2.3 Bayer Gummy Vitamin Products Offered
4.2.4 Bayer Gummy Vitamin Sales, Revenue and Gross Margin (2016-2021)
4.2.5 Bayer Gummy Vitamin Revenue by Product
4.2.6 Bayer Gummy Vitamin Revenue by Application
4.2.7 Bayer Gummy Vitamin Revenue by Geographic Area
4.2.8 Bayer Gummy Vitamin Revenue by Sales Channel
4.2.9 Bayer Recent Development
4.3 Church & Dwight Co
4.3.1 Church & Dwight Co Corporation Information
4.3.2 Church & Dwight Co Description, Business Overview
4.3.3 Church & Dwight Co Gummy Vitamin Products Offered
4.3.4 Church & Dwight Co Gummy Vitamin Sales, Revenue and Gross Margin (2016-2021)
4.3.5 Church & Dwight Co Gummy Vitamin Revenue by Product
4.3.6 Church & Dwight Co Gummy Vitamin Revenue by Application
4.3.7 Church & Dwight Co Gummy Vitamin Revenue by Geographic Area
4.3.8 Church & Dwight Co Gummy Vitamin Revenue by Sales Channel
4.3.9 Church & Dwight Co Recent Development
4.4 Pharmavite
4.4.1 Pharmavite Corporation Information
4.4.2 Pharmavite Description, Business Overview
4.4.3 Pharmavite Gummy Vitamin Products Offered
4.4.4 Pharmavite Gummy Vitamin Sales, Revenue and Gross Margin (2016-2021)
4.4.5 Pharmavite Gummy Vitamin Revenue by Product
4.4.6 Pharmavite Gummy Vitamin Revenue by Application
4.4.7 Pharmavite Gummy Vitamin Revenue by Geographic Area
4.4.8 Pharmavite Gummy Vitamin Revenue by Sales Channel
4.4.9 Pharmavite Recent Development
4.5 Nature’s Way
4.5.1 Nature’s Way Corporation Information
4.5.2 Nature’s Way Description, Business Overview
4.5.3 Nature’s Way Gummy Vitamin Products Offered
4.5.4 Nature’s Way Gummy Vitamin Sales, Revenue and Gross Margin (2016-2021)
4.5.5 Nature’s Way Gummy Vitamin Revenue by Product
4.5.6 Nature’s Way Gummy Vitamin Revenue by Application
4.5.7 Nature’s Way Gummy Vitamin Revenue by Geographic Area
4.5.8 Nature’s Way Gummy Vitamin Revenue by Sales Channel
4.5.9 Nature’s Way Recent Development
4.6 Smarty Pants Vitamins
4.6.1 Smarty Pants Vitamins Corporation Information
4.6.2 Smarty Pants Vitamins Description, Business Overview
4.6.3 Smarty Pants Vitamins Gummy Vitamin Products Offered
4.6.4 Smarty Pants Vitamins Gummy Vitamin Sales, Revenue and Gross Margin (2016-2021)
4.6.5 Smarty Pants Vitamins Gummy Vitamin Revenue by Product
4.6.6 Smarty Pants Vitamins Gummy Vitamin Revenue by Application
4.6.7 Smarty Pants Vitamins Gummy Vitamin Revenue by Geographic Area
4.6.8 Smarty Pants Vitamins Recent Development
4.7 Hero Nutritionals
4.7.1 Hero Nutritionals Corporation Information
4.7.2 Hero Nutritionals Description, Business Overview
4.7.3 Hero Nutritionals Gummy Vitamin Products Offered
4.7.4 Hero Nutritionals Gummy Vitamin Sales, Revenue and Gross Margin (2016-2021)
4.7.5 Hero Nutritionals Gummy Vitamin Revenue by Product
4.7.6 Hero Nutritionals Gummy Vitamin Revenue by Application
4.7.7 Hero Nutritionals Gummy Vitamin Revenue by Geographic Area
4.7.8 Hero Nutritionals Recent Development
4.8 Nature’s Bounty, Inc
4.8.1 Nature’s Bounty, Inc Corporation Information
4.8.2 Nature’s Bounty, Inc Description, Business Overview
4.8.3 Nature’s Bounty, Inc Gummy Vitamin Products Offered
4.8.4 Nature’s Bounty, Inc Gummy Vitamin Sales, Revenue and Gross Margin (2016-2021)
4.8.5 Nature’s Bounty, Inc Gummy Vitamin Revenue by Product
4.8.6 Nature’s Bounty, Inc Gummy Vitamin Revenue by Application
4.8.7 Nature’s Bounty, Inc Gummy Vitamin Revenue by Geographic Area
4.8.8 Nature’s Bounty, Inc Recent Development
4.9 Life Science Nutritionals
4.9.1 Life Science Nutritionals Corporation Information
4.9.2 Life Science Nutritionals Description, Business Overview
4.9.3 Life Science Nutritionals Gummy Vitamin Products Offered
4.9.4 Life Science Nutritionals Gummy Vitamin Sales, Revenue and Gross Margin (2016-2021)
4.9.5 Life Science Nutritionals Gummy Vitamin Revenue by Product
4.9.6 Life Science Nutritionals Gummy Vitamin Revenue by Application
4.9.7 Life Science Nutritionals Gummy Vitamin Revenue by Geographic Area
4.9.8 Life Science Nutritionals Recent Development
4.10 Rainbow Light
4.10.1 Rainbow Light Corporation Information
4.10.2 Rainbow Light Description, Business Overview
4.10.3 Rainbow Light Gummy Vitamin Products Offered
4.10.4 Rainbow Light Gummy Vitamin Sales, Revenue and Gross Margin (2016-2021)
4.10.5 Rainbow Light Gummy Vitamin Revenue by Product
4.10.6 Rainbow Light Gummy Vitamin Revenue by Application
4.10.7 Rainbow Light Gummy Vitamin Revenue by Geographic Area
4.10.8 Rainbow Light Recent Development
4.11 Herbaland
4.11.1 Herbaland Corporation Information
4.11.2 Herbaland Description, Business Overview
4.11.3 Herbaland Gummy Vitamin Products Offered
4.11.4 Herbaland Gummy Vitamin Sales, Revenue and Gross Margin (2016-2021)
4.11.5 Herbaland Gummy Vitamin Revenue by Product
4.11.6 Herbaland Gummy Vitamin Revenue by Application
4.11.7 Herbaland Gummy Vitamin Revenue by Geographic Area
4.11.8 Herbaland Recent Development
4.12 Olly Nutrition
4.12.1 Olly Nutrition Corporation Information
4.12.2 Olly Nutrition Description, Business Overview
4.12.3 Olly Nutrition Gummy Vitamin Products Offered
4.12.4 Olly Nutrition Gummy Vitamin Sales, Revenue and Gross Margin (2016-2021)
4.12.5 Olly Nutrition Gummy Vitamin Revenue by Product
4.12.6 Olly Nutrition Gummy Vitamin Revenue by Application
4.12.7 Olly Nutrition Gummy Vitamin Revenue by Geographic Area
4.12.8 Olly Nutrition Recent Development
5 Breakdown Data by Type
5.1 Global Gummy Vitamin Sales by Type (2016-2027)
5.1.1 Global Gummy Vitamin Sales by Type (2016-2021)
5.1.2 Global Gummy Vitamin Sales Forecast by Type (2022-2027)
5.1.3 Global Gummy Vitamin Sales Market Share by Type (2016-2027)
5.2 Global Gummy Vitamin Revenue Forecast by Type (2016-2027)
5.2.1 Global Gummy Vitamin Revenue by Type (2016-2021)
5.2.2 Global Gummy Vitamin Revenue Forecast by Type (2022-2027)
5.2.3 Global Gummy Vitamin Revenue Market Share by Type (2016-2027)
5.3 Gummy Vitamin Average Selling Price (ASP) by Type (2016-2027)
6 Breakdown Data by Application
6.1 Global Gummy Vitamin Sales by Application (2016-2027)
6.1.1 Global Gummy Vitamin Sales by Application (2016-2021)
6.1.2 Global Gummy Vitamin Sales Forecast by Application (2022-2027)
6.1.3 Global Gummy Vitamin Sales Market Share by Application (2016-2027)
6.2 Global Gummy Vitamin Revenue Forecast by Application (2016-2027)
6.2.1 Global Gummy Vitamin Revenue by Application (2016-2021)
6.2.2 Global Gummy Vitamin Revenue Forecast by Application (2022-2027)
6.2.3 Global Gummy Vitamin Revenue Market Share by Application (2016-2027)
6.3 Gummy Vitamin Average Selling Price (ASP) by Application (2016-2027)
7 North America
7.1 North America Gummy Vitamin Market Size YoY Growth 2016-2027
7.2 North America Gummy Vitamin Market Facts & Figures by Country
7.2.1 North America Gummy Vitamin Sales by Country (2016-2027)
7.2.2 North America Gummy Vitamin Revenue by Country (2016-2027)
7.3 North America Gummy Vitamin Sales by Type
7.4 North America Gummy Vitamin Sales by Application
8 Asia-Pacific
8.1 Asia-Pacific Gummy Vitamin Market Size YoY Growth 2016-2027
8.2 Asia-Pacific Gummy Vitamin Market Facts & Figures by Region
8.2.1 Asia-Pacific Gummy Vitamin Sales by Region (2016-2027)
8.2.2 Asia-Pacific Gummy Vitamin Revenue by Region (2016-2027)
8.3 Asia-Pacific Gummy Vitamin Sales by Type
8.4 Asia-Pacific Gummy Vitamin Sales by Application
9 Europe
9.1 Europe Gummy Vitamin Market Size YoY Growth 2016-2027
9.2 Europe Gummy Vitamin Market Facts & Figures by Country
9.2.1 Europe Gummy Vitamin Sales by Country (2016-2027)
9.2.2 Europe Gummy Vitamin Revenue by Country (2016-2027)
9.3 Europe Gummy Vitamin Sales by Type
9.4 Europe Gummy Vitamin Sales by Application
10 Latin America
10.1 Latin America Gummy Vitamin Market Size YoY Growth 2016-2027
10.2 Latin America Gummy Vitamin Market Facts & Figures by Country
10.2.1 Latin America Gummy Vitamin Sales by Country (2016-2027)
10.2.2 Latin America Gummy Vitamin Revenue by Country (2016-2027)
10.3 Latin America Gummy Vitamin Sales by Type
10.4 Latin America Gummy Vitamin Sales by Application
11 Middle East and Africa
11.1 Middle East and Africa Gummy Vitamin Market Size YoY Growth 2016-2027
11.2 Middle East and Africa Gummy Vitamin Market Facts & Figures by Country
11.2.1 Middle East and Africa Gummy Vitamin Sales by Country (2016-2027)
11.2.2 Middle East and Africa Gummy Vitamin Revenue by Country (2016-2027)
11.3 Middle East and Africa Gummy Vitamin Sales by Type
11.4 Middle East and Africa Gummy Vitamin Sales by Application
12 Supply Chain and Sales Channel Analysis
12.1 Gummy Vitamin Supply Chain Analysis
12.2 Gummy Vitamin Key Raw Materials and Upstream Suppliers
12.3 Gummy Vitamin Clients Analysis
12.4 Gummy Vitamin Sales Channel and Sales Model Analysis
12.4.1 Gummy Vitamin Distribution Channel Analysis: Indirect Sales VS Direct Sales
12.4.2 Gummy Vitamin Distribution Channel Analysis: Online Sales VS Offline Sales
12.4.3 Gummy Vitamin Distributors
13 Market Dynamics
13.1 Gummy Vitamin Market Drivers
13.2 Gummy Vitamin Market Opportunities
13.3 Gummy Vitamin Market Challenges
13.4 Gummy Vitamin Market Restraints
13.5 Porter’s Five Forces Analysis
14 Research Findings and Conclusion
15 Appendix
15.1 Research Methodology
15.1.1 Methodology/Research Approach
15.1.2 Data Source
15.2 Author Details
15.3 Disclaimer
List of Tables
    Table 1. Global Gummy Vitamin Market Size Growth Rate by Type (US$ Million): 2021 VS 2027
    Table 2. Major Manufacturers of Multi Vitamin
    Table 3. Major Manufacturers of Single Vitamin
    Table 4. Global Gummy Vitamin Market Size Growth by Application (US$ Million): 2021 VS 2027
    Table 5. Global Gummy Vitamin Market Size by Region (US$ Million): 2021 VS 2027
    Table 6. Global Gummy Vitamin Sales by Region (2016-2021) & (M Bottles)
    Table 7. Global Gummy Vitamin Sales Forecast by Region (2022-2027) & (M Bottles)
    Table 8. Global Gummy Vitamin Revenue by Region (2016-2021) & (US$ Million)
    Table 9. Global Gummy Vitamin Revenue Forecast by Region (2022-2027) & (US$ Million)
    Table 10. Global Gummy Vitamin Sales by Manufacturer (2016-2021) & (M Bottles)
    Table 11. Global Gummy Vitamin Sales Share by Manufacturer (2016-2021)
    Table 12. Gummy Vitamin Revenue by Manufacturer (2016-2021) & (US$ Million)
    Table 13. Gummy Vitamin Revenue Share by Manufacturer (2016-2021)
    Table 14. Key Manufacturers Gummy Vitamin Price (2016-2021) & (USD/Bottle)
    Table 15. Ranking of Global Top Gummy Vitamin Manufacturers by Revenue (US$ Million) in 2020
    Table 16. Global Gummy Vitamin Manufacturers Market Concentration Ratio (CR5 and HHI) & (2016-2021)
    Table 17. Global Gummy Vitamin by Company Type (Tier 1, Tier 2 and Tier 3) & (based on the Revenue in Gummy Vitamin as of 2020)
    Table 18. Gummy Vitamin Manufacturers Manufacturing Base Distribution and Headquarters
    Table 19. Manufacturers Gummy Vitamin Product Type
    Table 20. Date of International Manufacturers Enter into Gummy Vitamin Market
    Table 21. Manufacturers Mergers & Acquisitions, Expansion Plans
    Table 22. Gummy Vitamins Corporation Information
    Table 23. Gummy Vitamins Description and Business Overview
    Table 24. Gummy Vitamins Gummy Vitamin Sales (M Bottles), Revenue (US$ Million), Price (USD/Bottle) and Gross Margin (2016-2021)
    Table 25. Gummy Vitamins Gummy Vitamin Product
    Table 26. Gummy Vitamins Gummy Vitamin Revenue (US$ Million) and Market Share by Product
    Table 27. Gummy Vitamins Gummy Vitamin Revenue (US$ Million) and Market Share by Application
    Table 28. Gummy Vitamins Gummy Vitamin Revenue (US$ Million) and Market Share by Geographic Area
    Table 29. Gummy Vitamins Gummy Vitamin Revenue (US$ Million) and Market Share by Sales Channel
    Table 30. Gummy Vitamins Recent Development
    Table 31. Bayer Corporation Information
    Table 32. Bayer Description and Business Overview
    Table 33. Bayer Gummy Vitamin Sales (M Bottles), Revenue (US$ Million), Price (USD/Bottle) and Gross Margin (2016-2021)
    Table 34. Bayer Gummy Vitamin Product
    Table 35. Bayer Gummy Vitamin Revenue (US$ Million) and Market Share by Product
    Table 36. Bayer Gummy Vitamin Revenue (US$ Million) and Market Share by Application
    Table 37. Bayer Gummy Vitamin Revenue (US$ Million) and Market Share by Geographic Area
    Table 38. Bayer Gummy Vitamin Revenue (US$ Million) and Market Share by Sales Channel
    Table 39. Bayer Recent Development
    Table 40. Church & Dwight Co Corporation Information
    Table 41. Church & Dwight Co Description and Business Overview
    Table 42. Church & Dwight Co Gummy Vitamin Sales (M Bottles), Revenue (US$ Million), Price (USD/Bottle) and Gross Margin (2016-2021)
    Table 43. Church & Dwight Co Gummy Vitamin Product
    Table 44. Church & Dwight Co Gummy Vitamin Revenue (US$ Million) and Market Share by Product
    Table 45. Church & Dwight Co Gummy Vitamin Revenue (US$ Million) and Market Share by Application
    Table 46. Church & Dwight Co Gummy Vitamin Revenue (US$ Million) and Market Share by Geographic Area
    Table 47. Church & Dwight Co Gummy Vitamin Revenue (US$ Million) and Market Share by Sales Channel
    Table 48. Church & Dwight Co Recent Development
    Table 49. Pharmavite Corporation Information
    Table 50. Pharmavite Description and Business Overview
    Table 51. Pharmavite Gummy Vitamin Sales (M Bottles), Revenue (US$ Million), Price (USD/Bottle) and Gross Margin (2016-2021)
    Table 52. Pharmavite Gummy Vitamin Product
    Table 53. Pharmavite Gummy Vitamin Revenue (US$ Million) and Market Share by Product
    Table 54. Pharmavite Gummy Vitamin Revenue (US$ Million) and Market Share by Application
    Table 55. Pharmavite Gummy Vitamin Revenue (US$ Million) and Market Share by Geographic Area
    Table 56. Pharmavite Gummy Vitamin Revenue (US$ Million) and Market Share by Sales Channel
    Table 57. Pharmavite Recent Development
    Table 58. Nature’s Way Corporation Information
    Table 59. Nature’s Way Description and Business Overview
    Table 60. Nature’s Way Gummy Vitamin Sales (M Bottles), Revenue (US$ Million), Price (USD/Bottle) and Gross Margin (2016-2021)
    Table 61. Nature’s Way Gummy Vitamin Product
    Table 62. Nature’s Way Gummy Vitamin Revenue (US$ Million) and Market Share by Product
    Table 63. Nature’s Way Gummy Vitamin Revenue (US$ Million) and Market Share by Application
    Table 64. Nature’s Way Gummy Vitamin Revenue (US$ Million) and Market Share by Geographic Area
    Table 65. Nature’s Way Gummy Vitamin Revenue (US$ Million) and Market Share by Sales Channel
    Table 66. Nature’s Way Recent Development
    Table 67. Smarty Pants Vitamins Corporation Information
    Table 68. Smarty Pants Vitamins Description and Business Overview
    Table 69. Smarty Pants Vitamins Gummy Vitamin Sales (M Bottles), Revenue (US$ Million), Price (USD/Bottle) and Gross Margin (2016-2021)
    Table 70. Smarty Pants Vitamins Gummy Vitamin Product
    Table 71. Smarty Pants Vitamins Gummy Vitamin Revenue (US$ Million) and Market Share by Product
    Table 72. Smarty Pants Vitamins Gummy Vitamin Revenue (US$ Million) and Market Share by Application
    Table 73. Smarty Pants Vitamins Gummy Vitamin Revenue (US$ Million) and Market Share by Geographic Area
    Table 74. Smarty Pants Vitamins Recent Development
    Table 75. Hero Nutritionals Corporation Information
    Table 76. Hero Nutritionals Description and Business Overview
    Table 77. Hero Nutritionals Gummy Vitamin Sales (M Bottles), Revenue (US$ Million), Price (USD/Bottle) and Gross Margin (2016-2021)
    Table 78. Hero Nutritionals Gummy Vitamin Product
    Table 79. Hero Nutritionals Gummy Vitamin Revenue (US$ Million) and Market Share by Product
    Table 80. Hero Nutritionals Gummy Vitamin Revenue (US$ Million) and Market Share by Application
    Table 81. Hero Nutritionals Gummy Vitamin Revenue (US$ Million) and Market Share by Geographic Area
    Table 82. Hero Nutritionals Recent Development
    Table 83. Nature’s Bounty, Inc Corporation Information
    Table 84. Nature’s Bounty, Inc Description and Business Overview
    Table 85. Nature’s Bounty, Inc Gummy Vitamin Sales (M Bottles), Revenue (US$ Million), Price (USD/Bottle) and Gross Margin (2016-2021)
    Table 86. Nature’s Bounty, Inc Gummy Vitamin Product
    Table 87. Nature’s Bounty, Inc Gummy Vitamin Revenue (US$ Million) and Market Share by Product
    Table 88. Nature’s Bounty, Inc Gummy Vitamin Revenue (US$ Million) and Market Share by Application
    Table 89. Nature’s Bounty, Inc Gummy Vitamin Revenue (US$ Million) and Market Share by Geographic Area
    Table 90. Nature’s Bounty, Inc Recent Development
    Table 91. Life Science Nutritionals Corporation Information
    Table 92. Life Science Nutritionals Description and Business Overview
    Table 93. Life Science Nutritionals Gummy Vitamin Sales (M Bottles), Revenue (US$ Million), Price (USD/Bottle) and Gross Margin (2016-2021)
    Table 94. Life Science Nutritionals Gummy Vitamin Product
    Table 95. Life Science Nutritionals Gummy Vitamin Revenue (US$ Million) and Market Share by Product
    Table 96. Life Science Nutritionals Gummy Vitamin Revenue (US$ Million) and Market Share by Application
    Table 97. Life Science Nutritionals Gummy Vitamin Revenue (US$ Million) and Market Share by Geographic Area
    Table 98. Life Science Nutritionals Recent Development
    Table 99. Rainbow Light Corporation Information
    Table 100. Rainbow Light Description and Business Overview
    Table 101. Rainbow Light Gummy Vitamin Sales (M Bottles), Revenue (US$ Million), Price (USD/Bottle) and Gross Margin (2016-2021)
    Table 102. Rainbow Light Gummy Vitamin Product
    Table 103. Rainbow Light Gummy Vitamin Revenue (US$ Million) and Market Share by Product
    Table 104. Rainbow Light Gummy Vitamin Revenue (US$ Million) and Market Share by Application
    Table 105. Rainbow Light Gummy Vitamin Revenue (US$ Million) and Market Share by Geographic Area
    Table 106. Rainbow Light Recent Development
    Table 107. Herbaland Corporation Information
    Table 108. Herbaland Description and Business Overview
    Table 109. Herbaland Gummy Vitamin Sales (M Bottles), Revenue (US$ Million), Price (USD/Bottle) and Gross Margin (2016-2021)
    Table 110. Herbaland Gummy Vitamin Product
    Table 111. Herbaland Gummy Vitamin Revenue (US$ Million) and Market Share by Product
    Table 112. Herbaland Gummy Vitamin Revenue (US$ Million) and Market Share by Application
    Table 113. Herbaland Gummy Vitamin Revenue (US$ Million) and Market Share by Geographic Area
    Table 114. Herbaland Recent Development
    Table 115. Olly Nutrition Corporation Information
    Table 116. Olly Nutrition Description and Business Overview
    Table 117. Olly Nutrition Gummy Vitamin Sales (M Bottles), Revenue (US$ Million), Price (USD/Bottle) and Gross Margin (2016-2021)
    Table 118. Olly Nutrition Gummy Vitamin Product
    Table 119. Olly Nutrition Gummy Vitamin Revenue (US$ Million) and Market Share by Product
    Table 120. Olly Nutrition Gummy Vitamin Revenue (US$ Million) and Market Share by Application
    Table 121. Olly Nutrition Gummy Vitamin Revenue (US$ Million) and Market Share by Geographic Area
    Table 122. Olly Nutrition Recent Development
    Table 123. Global Gummy Vitamin Sales by Type (2016-2021) & (M Bottles)
    Table 124. Global Gummy Vitamin Sales Forecast by Type (2022-2027) & (M Bottles)
    Table 125. Global Gummy Vitamin Revenue by Type (2016-2021) & (US$ Million)
    Table 126. Global Gummy Vitamin Revenue Forecast by Type (2022-2027) & (US$ Million)
    Table 127. Global Gummy Vitamin Sales by Application (2016-2021) & (M Bottles)
    Table 128. Global Gummy Vitamin Sales Forecast by Application (2022-2027) & (M Bottles)
    Table 129. Global Gummy Vitamin Revenue by Application (2016-2021) & (US$ Million)
    Table 130. Global Gummy Vitamin Revenue Forecast by Application (2022-2027) & (US$ Million)
    Table 131. North America Gummy Vitamin Sales by Country (2016-2021) & (M Bottles)
    Table 132. North America Gummy Vitamin Sales by Country (2022-2027) & (M Bottles)
    Table 133. North America Gummy Vitamin Revenue by Country (2016-2021) & (US$ Million)
    Table 134. North America Gummy Vitamin Revenue by Country (2022-2027) & (US$ Million)
    Table 135. North America Gummy Vitamin Sales by Type (2016-2021) & (M Bottles)
    Table 136. North America Gummy Vitamin Sales by Application (2016-2021) & (M Bottles)
    Table 137. Asia-Pacific Gummy Vitamin Sales by Region (2016-2021) & (M Bottles)
    Table 138. Asia-Pacific Gummy Vitamin Sales by Region (2022-2027) & (M Bottles)
    Table 139. Asia-Pacific Gummy Vitamin Revenue by Region (2016-2027) & (US$ Million)
    Table 140. Asia-Pacific Gummy Vitamin Revenue by Region (2022-2027) & (US$ Million)
    Table 141. Asia-Pacific Gummy Vitamin Sales by Type (2016-2021) & (M Bottles)
    Table 142. Asia-Pacific Gummy Vitamin Sales by Application (2016-2021) & (M Bottles)
    Table 143. Europe Gummy Vitamin Sales by Country (2016-2021) & (M Bottles)
    Table 144. Europe Gummy Vitamin Sales by Country (2022-2027) & (M Bottles)
    Table 145. Europe Gummy Vitamin Revenue by Country (2016-2021) & (US$ Million)
    Table 146. Europe Gummy Vitamin Revenue by Country (2022-2027) & (US$ Million)
    Table 147. Europe Gummy Vitamin Sales by Type (2016-2021) & (M Bottles)
    Table 148. Europe Gummy Vitamin Sales by Application (2016-2021) & (M Bottles)
    Table 149. Latin America Gummy Vitamin Sales by Country (2016-2021) & (M Bottles)
    Table 150. Latin America Gummy Vitamin Sales by Country (2022-2027) & (M Bottles)
    Table 151. Latin America Gummy Vitamin Revenue by Country (2016-2021) & (US$ Million)
    Table 152. Latin America Gummy Vitamin Revenue by Country (2022-2027) & (US$ Million)
    Table 153. Latin America Gummy Vitamin Sales by Type (2016-2021) & (M Bottles)
    Table 154. Latin America Gummy Vitamin Sales by Application (2016-2021) & (M Bottles)
    Table 155. Middle East and Africa Gummy Vitamin Sales by Country (2016-2021) & (M Bottles)
    Table 156. Middle East and Africa Gummy Vitamin Sales by Country (2022-2027) & (M Bottles)
    Table 157. Middle East and Africa Gummy Vitamin Revenue by Country (2016-2021) & (US$ Million)
    Table 158. Middle East and Africa Gummy Vitamin Revenue by Country (2022-2027) & (US$ Million)
    Table 159. Middle East and Africa Gummy Vitamin Sales by Type (2016-2021) & (M Bottles)
    Table 160. Middle East and Africa Gummy Vitamin Sales by Application (2016-2021) & (M Bottles)
    Table 161. Gummy Vitamin Key Raw Materials, Industry Status and Trend
    Table 162. Gummy Vitamin Key Raw Materials and Upstream Suppliers
    Table 163. Gummy Vitamin Clients Status and Trend
    Table 164. Gummy Vitamin Typical Clients
    Table 165. Gummy Vitamin Distributors
    Table 166. Key Drivers: Impact Analysis (2022-2027)
    Table 167. Gummy Vitamin Market Drivers
    Table 168. Gummy Vitamin Market Opportunities
    Table 169. Gummy Vitamin Market Challenges
    Table 170. Gummy Vitamin Market Restraints
    Table 171. Gummy Vitamin Porter’s Five Forces Analysis
    Table 172. Research Programs/Design for This Report
    Table 173. Key Data Information from Secondary Sources
    Table 174. Key Data Information from Primary Sources
List of Figures
    Figure 1. Gummy Vitamin Product Picture
    Figure 2. Global Gummy Vitamin Sales Market Share by Type in 2021 & 2027
    Figure 3. Multi Vitamin Product Picture
    Figure 4. Single Vitamin Product Picture
    Figure 5. Global Gummy Vitamin Sales Market Share by Application in 2021 & 2027
    Figure 6. For Children Examples
    Figure 7. For Adult Examples
    Figure 8. Gummy Vitamin Report Years Considered
    Figure 9. Global Gummy Vitamin Market Size, (US$ Million), 2016 VS 2021 VS 2027
    Figure 10. Global Gummy Vitamin Market Size 2016-2027 (US$ Million)
    Figure 11. Global Gummy Vitamin Sales 2016-2027 (K Units)
    Figure 12. Global Gummy Vitamin Market Size Market Share by Region: 2021 Versus 2027
    Figure 13. Global Gummy Vitamin Sales Market Share Forecast by Region (2016-2027)
    Figure 14. Global Gummy Vitamin Revenue Market Share by Region (2016-2027)
    Figure 15. Global Gummy Vitamin Sales Share by Manufacturer in 2020
    Figure 16. Gummy Vitamin Market Share by Company Type (Tier 1, Tier 2 and Tier 3): 2016 VS 2020
    Figure 17. Global Gummy Vitamin Sales Market Share Forecast by Type (2016-2027)
    Figure 18. Global Gummy Vitamin Revenue Market Share Forecast by Type (2016-2027)
    Figure 19. Gummy Vitamin Average Selling Price (ASP) by Type (2016-2021) & (USD/Unit)
    Figure 20. Global Gummy Vitamin Sales Market Share Forecast by Application (2016-2027)
    Figure 21. Global Gummy Vitamin Revenue Market Share Forecast by Application (2016-2027)
    Figure 22. Gummy Vitamin Average Selling Price (ASP) by Application (2016-2021) & (USD/Unit)
    Figure 23. North America Gummy Vitamin Revenue 2016-2027 (US$ Million)
    Figure 24. North America Gummy Vitamin Sales Market Share by Type (2016-2021)
    Figure 25. North America Gummy Vitamin Sales Market Share by Application (2016-2021)
    Figure 26. Asia-Pacific Gummy Vitamin Revenue 2016-2027 (US$ Million)
    Figure 27. Asia-Pacific Gummy Vitamin Sales Market Share by Region (2016-2027)
    Figure 28. Asia-Pacific Gummy Vitamin Revenue Market Share by Region (2016-2027)
    Figure 29. Asia-Pacific Gummy Vitamin Sales Market Share by Type (2016-2021)
    Figure 30. Asia-Pacific Gummy Vitamin Sales Market Share by Application (2016-2021)
    Figure 31. Europe Gummy Vitamin Revenue Growth Rate 2016-2027 (US$ Million)
    Figure 32. Europe Gummy Vitamin Sales Market Share by Country (2016-2027)
    Figure 33. Europe Gummy Vitamin Revenue Market Share by Country (2016-2027)
    Figure 34. Europe Gummy Vitamin Sales Market Share by Type (2016-2021)
    Figure 35. Europe Gummy Vitamin Sales Market Share by Application (2016-2021)
    Figure 36. Latin America Gummy Vitamin Revenue Growth Rate 2016-2027 (US$ Million)
    Figure 37. Latin America Gummy Vitamin Sales Market Share by Country (2016-2027)
    Figure 38. Latin America Gummy Vitamin Revenue Market Share by Country (2016-2021)
    Figure 39. Latin America Gummy Vitamin Sales Market Share by Type (2016-2021)
    Figure 40. Latin America Gummy Vitamin Sales Market Share by Application (2016-2021)
    Figure 41. Middle East and Africa Gummy Vitamin Revenue Growth Rate 2016-2027 (US$ Million)
    Figure 42. Middle East and Africa Gummy Vitamin Sales Market Share by Country (2016-2027)
    Figure 43. Middle East and Africa Gummy Vitamin Revenue Market Share by Country (2016-2027)
    Figure 44. Middle East and Africa Gummy Vitamin Sales Market Share by Type (2016-2021)
    Figure 45. Middle East and Africa Gummy Vitamin Sales Market Share by Application (2016-2021)
    Figure 46. Gummy Vitamin Supply Chain (Upstream and Downstream Market)
    Figure 47. Global Production Market Share of Gummy Vitamin Raw Materials by Region in 2020
    Figure 48. Gummy Vitamin Distribution Channels
    Figure 49. Global Gummy Vitamin Percentage 2016-2027: Indirect Sales VS Direct Sales
    Figure 50. Global Gummy Vitamin Percentage 2016-2027: Online Sales VS Offline Sales
    Figure 51. Porter's Five Forces Analysis
    Figure 52. Bottom-up and Top-down Approaches for This Report
    Figure 53. Data Triangulation
    Figure 54. Key Executives Interviewed
SELECT A FORMAT
Added to Cart
Electronic (PDF)

$5900

This license allows only one user to access the PDF.
Electronic (PDF)

$8850

This license allows 1 - 5 user to access the PDF, license is suitable for small groups of 5 users working together
Electronic (PDF)

$11800

This license allows users/teams in a same Enterprise to use this report, various departments within an enterpise can use this report
Add to Cart
Buy Now (15% Discount)

OUR CUSTOMER

SecuX Technology Inc

RELATED REPORTS

Fish Bone Calcium - Global Market Share and Ranking, Overall Sales and Demand Forecast 2024-2030

120 Pages
Type: Report
Code: QYRE-Auto-21Z17741
Fri Nov 08 00:00:00 UTC 2024

Add to Cart

High Absorption Coenzyme Q10 - Global Market Share and Ranking, Overall Sales and Demand Forecast 2024-2030

120 Pages
Type: Report
Code: QYRE-Auto-16L17677
Fri Nov 08 00:00:00 UTC 2024

Add to Cart

Bee Propolis Capsules - Global Market Share and Ranking, Overall Sales and Demand Forecast 2024-2030

120 Pages
Type: Report
Code: QYRE-Auto-1S17864
Fri Nov 08 00:00:00 UTC 2024

Add to Cart

Seaweed Supplements - Global Market Share and Ranking, Overall Sales and Demand Forecast 2024-2030

120 Pages
Type: Report
Code: QYRE-Auto-28W17550
Fri Nov 08 00:00:00 UTC 2024

Add to Cart