
DNA sequencing is any chemical, enzymatic or technological procedure for determining the linear order of nucleotide bases in DNA.
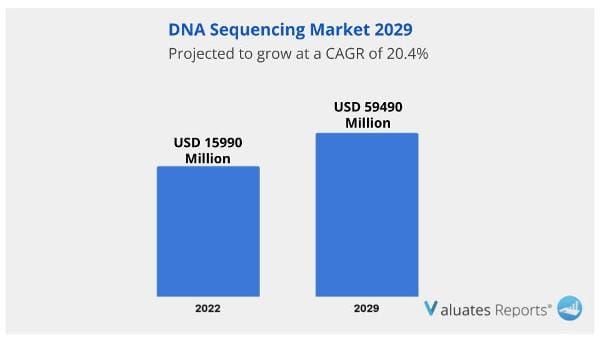
The DNA sequencing market was estimated to be worth US$ 15990 million in 2022 and is projected to grow to US$ 59490 million by 2029, at a CAGR of 20.4% from 2023 to 2029. When calculating market sizes, the impact of COVID-19 and the Netherlands-Ukraine War were taken into account.
Rapid advancements in sequencing technology and bioinformatics have enabled the identification of DNA variations. These advancements also determine variants associated with increased risk for disease. With the widespread application of Next-generation Sequencing (NGS) and Whole-genome Sequencing (WGS), a large range of genes can be tested in a single diagnostic platform at the same time, which expands the utility of DNA sequencing in clinical diagnosis applications. This factor is expected to drive the growth of the DNA sequencing market.
DNA sequencing has advantages over microarray and other genetic analysis techniques, including low cost, high accuracy & speed, and precise results even with small sample input. Applications for DNA sequencing include biomarker identification, oncology research, customized medicine, forensics, and others. This factor is expected to drive the growth of the DNA sequencing market.
It has streamlined nucleotide analysis and has superseded traditional genomics technologies, like genotyping, microarray, and others. Due to the boom in sequencing applications and growth in technological developments in DNA sequencing, the demand for DNA sequencing has greatly increased. Additionally, a boost in worldwide genome mapping efforts and R&D spending are two factors driving the market's expansion. This in turn is expected to further drive the growth of the DNA sequencing market.
DNA sequencing, a highly accurate and high-throughput method utilized for a range of applications including de novo assembly, WGS, and DNA resequencing, has caused a paradigm change in proteomic and genomic research. As a result, this technology is easily used for research studies in many academic research centers. This is expected to drive the growth of the DNA sequencing market.
The DNA sequencing market is anticipated to expand at a profitable rate in the Asia Pacific over the course of the forecast period. There will likely be many prospects for regional growth as a result of strategic actions taken by international companies to increase their presence in light of the substantial client base.
| Report Metric | Details |
| Report Name | The global DNA Sequencing Market |
| The market size in 2022 | USD 15990 Million |
| The revenue forecast in 2029 | USD 59490 Million |
| Growth Rate | Compound Annual Growth Rate (CAGR) of 20.4% from 2023 to 2029 |
| Market size available for years | 2023-2029 |
| Forecast units | Value (USD) |
| Segments covered | Type, Application, Regions |
| Report coverage | Revenue & volume forecast, company share, competitive landscape, growth factors, and trends |
| Geographic regions covered | North America, Europe, Asia Pacific, Latin America, Middle East & Africa |
Ans. The global DNA Sequencing market was valued at US$ 15990 million in 2022 and is anticipated to reach US$ 59490 million by 2029, witnessing a CAGR of 20.4% during the forecast period 2023-2029.
Ans. The global DNA Sequencing market is expected to grow at a compound annual growth rate of 20.4% from 2023 to 2029.
Ans. Illumina, Roche, Pacific Biosciences, BGI, Macrogen, Berry Genomics, Novo Gene, Others
1 DNA Sequencing Market Overview
1.1 Product Overview and Scope of DNA Sequencing
1.2 DNA Sequencing Segment by Type
1.2.1 Global DNA Sequencing Market Value Comparison by Type (2023-2029)
1.2.2 First Generation DNA Sequencing
1.2.3 Second Generation DNA Sequencing
1.2.4 Third Generation DNA Sequencing
1.3 DNA Sequencing Segment by Application
1.3.1 Global DNA Sequencing Market Value by Application: (2023-2029)
1.3.2 Oncology DNA Sequencing
1.3.3 Life Science DNA Sequencing
1.3.4 Emerging Application DNA Sequencing
1.3.5 Hereditary Disease Detection DNA Sequencing
1.4 Global DNA Sequencing Market Size Estimates and Forecasts
1.4.1 Global DNA Sequencing Revenue 2018-2029
1.4.2 Global DNA Sequencing Sales 2018-2029
1.4.3 Global DNA Sequencing Market Average Price (2018-2029)
1.5 Assumptions and Limitations
2 DNA Sequencing Market Competition by Manufacturers
2.1 Global DNA Sequencing Sales Market Share by Manufacturers (2018-2023)
2.2 Global DNA Sequencing Revenue Market Share by Manufacturers (2018-2023)
2.3 Global DNA Sequencing Average Price by Manufacturers (2018-2023)
2.4 Global DNA Sequencing Industry Ranking 2021 VS 2022 VS 2023
2.5 Global Key Manufacturers of DNA Sequencing, Manufacturing Sites & Headquarters
2.6 Global Key Manufacturers of DNA Sequencing, Product Type & Application
2.7 DNA Sequencing Market Competitive Situation and Trends
2.7.1 DNA Sequencing Market Concentration Rate
2.7.2 The Global Top 5 and Top 10 Largest DNA Sequencing Players Market Share by Revenue
2.7.3 Global DNA Sequencing Market Share by Company Type (Tier 1, Tier 2 and Tier 3)
2.8 Manufacturers Mergers & Acquisitions, Expansion Plans
3 DNA Sequencing Retrospective Market Scenario by Region
3.1 Global DNA Sequencing Market Size by Region: 2018 Versus 2022 Versus 2029
3.2 Global DNA Sequencing Global DNA Sequencing Sales by Region: 2018-2029
3.2.1 Global DNA Sequencing Sales by Region: 2018-2023
3.2.2 Global DNA Sequencing Sales by Region: 2024-2029
3.3 Global DNA Sequencing Global DNA Sequencing Revenue by Region: 2018-2029
3.3.1 Global DNA Sequencing Revenue by Region: 2018-2023
3.3.2 Global DNA Sequencing Revenue by Region: 2024-2029
3.4 North America DNA Sequencing Market Facts & Figures by Country
3.4.1 North America DNA Sequencing Market Size by Country: 2018 VS 2022 VS 2029
3.4.2 North America DNA Sequencing Sales by Country (2018-2029)
3.4.3 North America DNA Sequencing Revenue by Country (2018-2029)
3.4.4 U.S.
3.4.5 Canada
3.5 Europe DNA Sequencing Market Facts & Figures by Country
3.5.1 Europe DNA Sequencing Market Size by Country: 2018 VS 2022 VS 2029
3.5.2 Europe DNA Sequencing Sales by Country (2018-2029)
3.5.3 Europe DNA Sequencing Revenue by Country (2018-2029)
3.5.4 Germany
3.5.5 France
3.5.6 U.K.
3.5.7 Italy
3.5.8 Russia
3.6 Asia Pacific DNA Sequencing Market Facts & Figures by Country
3.6.1 Asia Pacific DNA Sequencing Market Size by Country: 2018 VS 2022 VS 2029
3.6.2 Asia Pacific DNA Sequencing Sales by Country (2018-2029)
3.6.3 Asia Pacific DNA Sequencing Revenue by Country (2018-2029)
3.6.4 China
3.6.5 Japan
3.6.6 South Korea
3.6.7 India
3.6.8 Australia
3.6.9 Taiwan
3.6.10 Indonesia
3.6.11 Thailand
3.6.12 Malaysia
3.6.13 Philippines
3.7 Latin America DNA Sequencing Market Facts & Figures by Country
3.7.1 Latin America DNA Sequencing Market Size by Country: 2018 VS 2022 VS 2029
3.7.2 Latin America DNA Sequencing Sales by Country (2018-2029)
3.7.3 Latin America DNA Sequencing Revenue by Country (2018-2029)
3.7.4 Mexico
3.7.5 Brazil
3.7.6 Argentina
3.8 Middle East and Africa DNA Sequencing Market Facts & Figures by Country
3.8.1 Middle East and Africa DNA Sequencing Market Size by Country: 2018 VS 2022 VS 2029
3.8.2 Middle East and Africa DNA Sequencing Sales by Country (2018-2029)
3.8.3 Middle East and Africa DNA Sequencing Revenue by Country (2018-2029)
3.8.4 Turkey
3.8.5 Saudi Arabia
3.8.6 U.A.E
4 Segment by Type
4.1 Global DNA Sequencing Sales by Type (2018-2029)
4.1.1 Global DNA Sequencing Sales by Type (2018-2023)
4.1.2 Global DNA Sequencing Sales by Type (2024-2029)
4.1.3 Global DNA Sequencing Sales Market Share by Type (2018-2029)
4.2 Global DNA Sequencing Revenue by Type (2018-2029)
4.2.1 Global DNA Sequencing Revenue by Type (2018-2023)
4.2.2 Global DNA Sequencing Revenue by Type (2024-2029)
4.2.3 Global DNA Sequencing Revenue Market Share by Type (2018-2029)
4.3 Global DNA Sequencing Price by Type (2018-2029)
5 Segment by Application
5.1 Global DNA Sequencing Sales by Application (2018-2029)
5.1.1 Global DNA Sequencing Sales by Application (2018-2023)
5.1.2 Global DNA Sequencing Sales by Application (2024-2029)
5.1.3 Global DNA Sequencing Sales Market Share by Application (2018-2029)
5.2 Global DNA Sequencing Revenue by Application (2018-2029)
5.2.1 Global DNA Sequencing Revenue by Application (2018-2023)
5.2.2 Global DNA Sequencing Revenue by Application (2024-2029)
5.2.3 Global DNA Sequencing Revenue Market Share by Application (2018-2029)
5.3 Global DNA Sequencing Price by Application (2018-2029)
6 Key Companies Profiled
6.1 Illumina
6.1.1 Illumina Corporation Information
6.1.2 Illumina Description and Business Overview
6.1.3 Illumina DNA Sequencing Sales, Revenue and Gross Margin (2018-2023)
6.1.4 Illumina DNA Sequencing Product Portfolio
6.1.5 Illumina Recent Developments/Updates
6.2 Roche
6.2.1 Roche Corporation Information
6.2.2 Roche Description and Business Overview
6.2.3 Roche DNA Sequencing Sales, Revenue and Gross Margin (2018-2023)
6.2.4 Roche DNA Sequencing Product Portfolio
6.2.5 Roche Recent Developments/Updates
6.3 Pacific Biosciences
6.3.1 Pacific Biosciences Corporation Information
6.3.2 Pacific Biosciences Description and Business Overview
6.3.3 Pacific Biosciences DNA Sequencing Sales, Revenue and Gross Margin (2018-2023)
6.3.4 Pacific Biosciences DNA Sequencing Product Portfolio
6.3.5 Pacific Biosciences Recent Developments/Updates
6.4 BGI
6.4.1 BGI Corporation Information
6.4.2 BGI Description and Business Overview
6.4.3 BGI DNA Sequencing Sales, Revenue and Gross Margin (2018-2023)
6.4.4 BGI DNA Sequencing Product Portfolio
6.4.5 BGI Recent Developments/Updates
6.5 Macrogen
6.5.1 Macrogen Corporation Information
6.5.2 Macrogen Description and Business Overview
6.5.3 Macrogen DNA Sequencing Sales, Revenue and Gross Margin (2018-2023)
6.5.4 Macrogen DNA Sequencing Product Portfolio
6.5.5 Macrogen Recent Developments/Updates
6.6 Berry Genomics
6.6.1 Berry Genomics Corporation Information
6.6.2 Berry Genomics Description and Business Overview
6.6.3 Berry Genomics DNA Sequencing Sales, Revenue and Gross Margin (2018-2023)
6.6.4 Berry Genomics DNA Sequencing Product Portfolio
6.6.5 Berry Genomics Recent Developments/Updates
6.7 Novo Gene
6.6.1 Novo Gene Corporation Information
6.6.2 Novo Gene Description and Business Overview
6.6.3 Novo Gene DNA Sequencing Sales, Revenue and Gross Margin (2018-2023)
6.4.4 Novo Gene DNA Sequencing Product Portfolio
6.7.5 Novo Gene Recent Developments/Updates
7 Industry Chain and Sales Channels Analysis
7.1 DNA Sequencing Industry Chain Analysis
7.2 DNA Sequencing Key Raw Materials
7.2.1 Key Raw Materials
7.2.2 Raw Materials Key Suppliers
7.3 DNA Sequencing Production Mode & Process
7.4 DNA Sequencing Sales and Marketing
7.4.1 DNA Sequencing Sales Channels
7.4.2 DNA Sequencing Distributors
7.5 DNA Sequencing Customers
8 DNA Sequencing Market Dynamics
8.1 DNA Sequencing Industry Trends
8.2 DNA Sequencing Market Drivers
8.3 DNA Sequencing Market Challenges
8.4 DNA Sequencing Market Restraints
9 Research Finding and Conclusion
10 Methodology and Data Source
10.1 Methodology/Research Approach
10.1.1 Research Programs/Design
10.1.2 Market Size Estimation
10.1.3 Market Breakdown and Data Triangulation
10.2 Data Source
10.2.1 Secondary Sources
10.2.2 Primary Sources
10.3 Author List
10.4 Disclaimer
List of Tables
Table 1. Global DNA Sequencing Market Value Comparison by Type (2023-2029) & (US$ Million)
Table 2. Global DNA Sequencing Market Value Comparison by Application (2023-2029) & (US$ Million)
Table 3. Global DNA Sequencing Market Competitive Situation by Manufacturers in 2022
Table 4. Global DNA Sequencing Sales (K Units) of Key Manufacturers (2018-2023)
Table 5. Global DNA Sequencing Sales Market Share by Manufacturers (2018-2023)
Table 6. Global DNA Sequencing Revenue (US$ Million) by Manufacturers (2018-2023)
Table 7. Global DNA Sequencing Revenue Share by Manufacturers (2018-2023)
Table 8. Global Market DNA Sequencing Average Price (USD/Unit) of Key Manufacturers (2018-2023)
Table 9. Global Key Players of DNA Sequencing, Industry Ranking, 2021 VS 2022 VS 2023
Table 10. Global Key Manufacturers of DNA Sequencing, Manufacturing Sites & Headquarters
Table 11. Global Key Manufacturers of DNA Sequencing, Product Type & Application
Table 12. Global Key Manufacturers of DNA Sequencing, Date of Enter into This Industry
Table 13. Global Manufacturers Market Concentration Ratio (CR5 and HHI)
Table 14. Global DNA Sequencing by Company Type (Tier 1, Tier 2, and Tier 3) & (based on the Revenue in DNA Sequencing as of 2022)
Table 15. Manufacturers Mergers & Acquisitions, Expansion Plans
Table 16. Global DNA Sequencing Market Size by Region (US$ Million): 2018 VS 2022 VS 2029
Table 17. Global DNA Sequencing Sales by Region (2018-2023) & (K Units)
Table 18. Global DNA Sequencing Sales Market Share by Region (2018-2023)
Table 19. Global DNA Sequencing Sales by Region (2024-2029) & (K Units)
Table 20. Global DNA Sequencing Sales Market Share by Region (2024-2029)
Table 21. Global DNA Sequencing Revenue by Region (2018-2023) & (US$ Million)
Table 22. Global DNA Sequencing Revenue Market Share by Region (2018-2023)
Table 23. Global DNA Sequencing Revenue by Region (2024-2029) & (US$ Million)
Table 24. Global DNA Sequencing Revenue Market Share by Region (2024-2029)
Table 25. North America DNA Sequencing Revenue by Country: 2018 VS 2022 VS 2029 (US$ Million)
Table 26. North America DNA Sequencing Sales by Country (2018-2023) & (K Units)
Table 27. North America DNA Sequencing Sales by Country (2024-2029) & (K Units)
Table 28. North America DNA Sequencing Revenue by Country (2018-2023) & (US$ Million)
Table 29. North America DNA Sequencing Revenue by Country (2024-2029) & (US$ Million)
Table 30. Europe DNA Sequencing Revenue by Country: 2018 VS 2022 VS 2029 (US$ Million)
Table 31. Europe DNA Sequencing Sales by Country (2018-2023) & (K Units)
Table 32. Europe DNA Sequencing Sales by Country (2024-2029) & (K Units)
Table 33. Europe DNA Sequencing Revenue by Country (2018-2023) & (US$ Million)
Table 34. Europe DNA Sequencing Revenue by Country (2024-2029) & (US$ Million)
Table 35. Asia Pacific DNA Sequencing Revenue by Region: 2018 VS 2022 VS 2029 (US$ Million)
Table 36. Asia Pacific DNA Sequencing Sales by Region (2018-2023) & (K Units)
Table 37. Asia Pacific DNA Sequencing Sales by Region (2024-2029) & (K Units)
Table 38. Asia Pacific DNA Sequencing Revenue by Region (2018-2023) & (US$ Million)
Table 39. Asia Pacific DNA Sequencing Revenue by Region (2024-2029) & (US$ Million)
Table 40. Latin America DNA Sequencing Revenue by Country: 2018 VS 2022 VS 2029 (US$ Million)
Table 41. Latin America DNA Sequencing Sales by Country (2018-2023) & (K Units)
Table 42. Latin America DNA Sequencing Sales by Country (2024-2029) & (K Units)
Table 43. Latin America DNA Sequencing Revenue by Country (2018-2023) & (US$ Million)
Table 44. Latin America DNA Sequencing Revenue by Country (2024-2029) & (US$ Million)
Table 45. Middle East & Africa DNA Sequencing Revenue by Country: 2018 VS 2022 VS 2029 (US$ Million)
Table 46. Middle East & Africa DNA Sequencing Sales by Country (2018-2023) & (K Units)
Table 47. Middle East & Africa DNA Sequencing Sales by Country (2024-2029) & (K Units)
Table 48. Middle East & Africa DNA Sequencing Revenue by Country (2018-2023) & (US$ Million)
Table 49. Middle East & Africa DNA Sequencing Revenue by Country (2024-2029) & (US$ Million)
Table 50. Global DNA Sequencing Sales (K Units) by Type (2018-2023)
Table 51. Global DNA Sequencing Sales (K Units) by Type (2024-2029)
Table 52. Global DNA Sequencing Sales Market Share by Type (2018-2023)
Table 53. Global DNA Sequencing Sales Market Share by Type (2024-2029)
Table 54. Global DNA Sequencing Revenue (US$ Million) by Type (2018-2023)
Table 55. Global DNA Sequencing Revenue (US$ Million) by Type (2024-2029)
Table 56. Global DNA Sequencing Revenue Market Share by Type (2018-2023)
Table 57. Global DNA Sequencing Revenue Market Share by Type (2024-2029)
Table 58. Global DNA Sequencing Price (USD/Unit) by Type (2018-2023)
Table 59. Global DNA Sequencing Price (USD/Unit) by Type (2024-2029)
Table 60. Global DNA Sequencing Sales (K Units) by Application (2018-2023)
Table 61. Global DNA Sequencing Sales (K Units) by Application (2024-2029)
Table 62. Global DNA Sequencing Sales Market Share by Application (2018-2023)
Table 63. Global DNA Sequencing Sales Market Share by Application (2024-2029)
Table 64. Global DNA Sequencing Revenue (US$ Million) by Application (2018-2023)
Table 65. Global DNA Sequencing Revenue (US$ Million) by Application (2024-2029)
Table 66. Global DNA Sequencing Revenue Market Share by Application (2018-2023)
Table 67. Global DNA Sequencing Revenue Market Share by Application (2024-2029)
Table 68. Global DNA Sequencing Price (USD/Unit) by Application (2018-2023)
Table 69. Global DNA Sequencing Price (USD/Unit) by Application (2024-2029)
Table 70. Illumina Corporation Information
Table 71. Illumina Description and Business Overview
Table 72. Illumina DNA Sequencing Sales (K Units), Revenue (US$ Million), Price (USD/Unit) and Gross Margin (2018-2023)
Table 73. Illumina DNA Sequencing Product
Table 74. Illumina Recent Developments/Updates
Table 75. Roche Corporation Information
Table 76. Roche Description and Business Overview
Table 77. Roche DNA Sequencing Sales (K Units), Revenue (US$ Million), Price (USD/Unit) and Gross Margin (2018-2023)
Table 78. Roche DNA Sequencing Product
Table 79. Roche Recent Developments/Updates
Table 80. Pacific Biosciences Corporation Information
Table 81. Pacific Biosciences Description and Business Overview
Table 82. Pacific Biosciences DNA Sequencing Sales (K Units), Revenue (US$ Million), Price (USD/Unit) and Gross Margin (2018-2023)
Table 83. Pacific Biosciences DNA Sequencing Product
Table 84. Pacific Biosciences Recent Developments/Updates
Table 85. BGI Corporation Information
Table 86. BGI Description and Business Overview
Table 87. BGI DNA Sequencing Sales (K Units), Revenue (US$ Million), Price (USD/Unit) and Gross Margin (2018-2023)
Table 88. BGI DNA Sequencing Product
Table 89. BGI Recent Developments/Updates
Table 90. Macrogen Corporation Information
Table 91. Macrogen Description and Business Overview
Table 92. Macrogen DNA Sequencing Sales (K Units), Revenue (US$ Million), Price (USD/Unit) and Gross Margin (2018-2023)
Table 93. Macrogen DNA Sequencing Product
Table 94. Macrogen Recent Developments/Updates
Table 95. Berry Genomics Corporation Information
Table 96. Berry Genomics Description and Business Overview
Table 97. Berry Genomics DNA Sequencing Sales (K Units), Revenue (US$ Million), Price (USD/Unit) and Gross Margin (2018-2023)
Table 98. Berry Genomics DNA Sequencing Product
Table 99. Berry Genomics Recent Developments/Updates
Table 100. Novo Gene Corporation Information
Table 101. Novo Gene Description and Business Overview
Table 102. Novo Gene DNA Sequencing Sales (K Units), Revenue (US$ Million), Price (USD/Unit) and Gross Margin (2018-2023)
Table 103. Novo Gene DNA Sequencing Product
Table 104. Novo Gene Recent Developments/Updates
Table 105. Key Raw Materials Lists
Table 106. Raw Materials Key Suppliers Lists
Table 107. DNA Sequencing Distributors List
Table 108. DNA Sequencing Customers List
Table 109. DNA Sequencing Market Trends
Table 110. DNA Sequencing Market Drivers
Table 111. DNA Sequencing Market Challenges
Table 112. DNA Sequencing Market Restraints
Table 113. Research Programs/Design for This Report
Table 114. Key Data Information from Secondary Sources
Table 115. Key Data Information from Primary Sources
List of Figures
Figure 1. Product Picture of DNA Sequencing
Figure 2. Global DNA Sequencing Market Value Comparison by Type (2023-2029) & (US$ Million)
Figure 3. Global DNA Sequencing Market Share by Type in 2022 & 2029
Figure 4. First Generation DNA Sequencing Product Picture
Figure 5. Second Generation DNA Sequencing Product Picture
Figure 6. Third Generation DNA Sequencing Product Picture
Figure 7. Global DNA Sequencing Market Value Comparison by Application (2023-2029) & (US$ Million)
Figure 8. Global DNA Sequencing Market Share by Application in 2022 & 2029
Figure 9. Oncology DNA Sequencing
Figure 10. Life Science DNA Sequencing
Figure 11. Emerging Application DNA Sequencing
Figure 12. Hereditary Disease Detection DNA Sequencing
Figure 13. Global DNA Sequencing Revenue, (US$ Million), 2018 VS 2022 VS 2029
Figure 14. Global DNA Sequencing Market Size (2018-2029) & (US$ Million)
Figure 15. Global DNA Sequencing Sales (2018-2029) & (K Units)
Figure 16. Global DNA Sequencing Average Price (USD/Unit) & (2018-2029)
Figure 17. DNA Sequencing Report Years Considered
Figure 18. DNA Sequencing Sales Share by Manufacturers in 2022
Figure 19. Global DNA Sequencing Revenue Share by Manufacturers in 2022
Figure 20. The Global 5 and 10 Largest DNA Sequencing Players: Market Share by Revenue in 2022
Figure 21. DNA Sequencing Market Share by Company Type (Tier 1, Tier 2 and Tier 3): 2018 VS 2022
Figure 22. Global DNA Sequencing Market Size by Region (US$ Million): 2018 VS 2022 VS 2029
Figure 23. North America DNA Sequencing Sales Market Share by Country (2018-2029)
Figure 24. North America DNA Sequencing Revenue Market Share by Country (2018-2029)
Figure 25. U.S. DNA Sequencing Revenue Growth Rate (2018-2029) & (US$ Million)
Figure 26. Canada DNA Sequencing Revenue Growth Rate (2018-2029) & (US$ Million)
Figure 27. Europe DNA Sequencing Sales Market Share by Country (2018-2029)
Figure 28. Europe DNA Sequencing Revenue Market Share by Country (2018-2029)
Figure 29. Germany DNA Sequencing Revenue Growth Rate (2018-2029) & (US$ Million)
Figure 30. France DNA Sequencing Revenue Growth Rate (2018-2029) & (US$ Million)
Figure 31. U.K. DNA Sequencing Revenue Growth Rate (2018-2029) & (US$ Million)
Figure 32. Italy DNA Sequencing Revenue Growth Rate (2018-2029) & (US$ Million)
Figure 33. Russia DNA Sequencing Revenue Growth Rate (2018-2029) & (US$ Million)
Figure 34. Asia Pacific DNA Sequencing Sales Market Share by Region (2018-2029)
Figure 35. Asia Pacific DNA Sequencing Revenue Market Share by Region (2018-2029)
Figure 36. China DNA Sequencing Revenue Growth Rate (2018-2029) & (US$ Million)
Figure 37. Japan DNA Sequencing Revenue Growth Rate (2018-2029) & (US$ Million)
Figure 38. South Korea DNA Sequencing Revenue Growth Rate (2018-2029) & (US$ Million)
Figure 39. India DNA Sequencing Revenue Growth Rate (2018-2029) & (US$ Million)
Figure 40. Australia DNA Sequencing Revenue Growth Rate (2018-2029) & (US$ Million)
Figure 41. Taiwan DNA Sequencing Revenue Growth Rate (2018-2029) & (US$ Million)
Figure 42. Indonesia DNA Sequencing Revenue Growth Rate (2018-2029) & (US$ Million)
Figure 43. Thailand DNA Sequencing Revenue Growth Rate (2018-2029) & (US$ Million)
Figure 44. Malaysia DNA Sequencing Revenue Growth Rate (2018-2029) & (US$ Million)
Figure 45. Philippines DNA Sequencing Revenue Growth Rate (2018-2029) & (US$ Million)
Figure 46. Latin America DNA Sequencing Sales Market Share by Country (2018-2029)
Figure 47. Latin America DNA Sequencing Revenue Market Share by Country (2018-2029)
Figure 48. Mexico DNA Sequencing Revenue Growth Rate (2018-2029) & (US$ Million)
Figure 49. Brazil DNA Sequencing Revenue Growth Rate (2018-2029) & (US$ Million)
Figure 50. Argentina DNA Sequencing Revenue Growth Rate (2018-2029) & (US$ Million)
Figure 51. Middle East & Africa DNA Sequencing Sales Market Share by Country (2018-2029)
Figure 52. Middle East & Africa DNA Sequencing Revenue Market Share by Country (2018-2029)
Figure 53. Turkey DNA Sequencing Revenue Growth Rate (2018-2029) & (US$ Million)
Figure 54. Saudi Arabia DNA Sequencing Revenue Growth Rate (2018-2029) & (US$ Million)
Figure 55. U.A.E DNA Sequencing Revenue Growth Rate (2018-2029) & (US$ Million)
Figure 56. Global Sales Market Share of DNA Sequencing by Type (2018-2029)
Figure 57. Global Revenue Market Share of DNA Sequencing by Type (2018-2029)
Figure 58. Global DNA Sequencing Price (USD/Unit) by Type (2018-2029)
Figure 59. Global Sales Market Share of DNA Sequencing by Application (2018-2029)
Figure 60. Global Revenue Market Share of DNA Sequencing by Application (2018-2029)
Figure 61. Global DNA Sequencing Price (USD/Unit) by Application (2018-2029)
Figure 62. DNA Sequencing Value Chain
Figure 63. DNA Sequencing Production Process
Figure 64. Channels of Distribution (Direct Vs Distribution)
Figure 65. Distributors Profiles
Figure 66. Bottom-up and Top-down Approaches for This Report
Figure 67. Data Triangulation
Figure 68. Key Executives Interviewed
$2900
$5800
HAVE A QUERY?
OUR CUSTOMER

SIMILAR REPORTS