List of Tables
Table 1. Global Casting Aluminum Alloys for Automobiles Market Size Growth Rate by Type (US$ Million): 2020 VS 2024 VS 2031
Table 2. Key Players of Engine Components
Table 3. Key Players of Body Components
Table 4. Key Players of Chassis Components
Table 5. Key Players of Driveline Components
Table 6. Key Players of Others
Table 7. Global Casting Aluminum Alloys for Automobiles Market Size Growth by Application (US$ Million): 2020 VS 2024 VS 2031
Table 8. Global Casting Aluminum Alloys for Automobiles Market Size by Region (US$ Million): 2020 VS 2024 VS 2031
Table 9. Global Casting Aluminum Alloys for Automobiles Market Size by Region (2020-2025) & (US$ Million)
Table 10. Global Casting Aluminum Alloys for Automobiles Market Share by Region (2020-2025)
Table 11. Global Casting Aluminum Alloys for Automobiles Forecasted Market Size by Region (2026-2031) & (US$ Million)
Table 12. Global Casting Aluminum Alloys for Automobiles Market Share by Region (2026-2031)
Table 13. Casting Aluminum Alloys for Automobiles Market Trends
Table 14. Casting Aluminum Alloys for Automobiles Market Drivers
Table 15. Casting Aluminum Alloys for Automobiles Market Challenges
Table 16. Casting Aluminum Alloys for Automobiles Market Restraints
Table 17. Global Casting Aluminum Alloys for Automobiles Revenue by Players (2020-2025) & (US$ Million)
Table 18. Global Casting Aluminum Alloys for Automobiles Market Share by Players (2020-2025)
Table 19. Global Top Casting Aluminum Alloys for Automobiles Players by Company Type (Tier 1, Tier 2, and Tier 3) & (based on the Revenue in Casting Aluminum Alloys for Automobiles as of 2024)
Table 20. Ranking of Global Top Casting Aluminum Alloys for Automobiles Companies by Revenue (US$ Million) in 2024
Table 21. Global 5 Largest Players Market Share by Casting Aluminum Alloys for Automobiles Revenue (CR5 and HHI) & (2020-2025)
Table 22. Global Key Players of Casting Aluminum Alloys for Automobiles, Headquarters and Area Served
Table 23. Global Key Players of Casting Aluminum Alloys for Automobiles, Product and Application
Table 24. Global Key Players of Casting Aluminum Alloys for Automobiles, Date of Enter into This Industry
Table 25. Mergers & Acquisitions, Expansion Plans
Table 26. Global Casting Aluminum Alloys for Automobiles Market Size by Type (2020-2025) & (US$ Million)
Table 27. Global Casting Aluminum Alloys for Automobiles Revenue Market Share by Type (2020-2025)
Table 28. Global Casting Aluminum Alloys for Automobiles Forecasted Market Size by Type (2026-2031) & (US$ Million)
Table 29. Global Casting Aluminum Alloys for Automobiles Revenue Market Share by Type (2026-2031)
Table 30. Global Casting Aluminum Alloys for Automobiles Market Size by Application (2020-2025) & (US$ Million)
Table 31. Global Casting Aluminum Alloys for Automobiles Revenue Market Share by Application (2020-2025)
Table 32. Global Casting Aluminum Alloys for Automobiles Forecasted Market Size by Application (2026-2031) & (US$ Million)
Table 33. Global Casting Aluminum Alloys for Automobiles Revenue Market Share by Application (2026-2031)
Table 34. North America Casting Aluminum Alloys for Automobiles Market Size Growth Rate by Country (US$ Million): 2020 VS 2024 VS 2031
Table 35. North America Casting Aluminum Alloys for Automobiles Market Size by Country (2020-2025) & (US$ Million)
Table 36. North America Casting Aluminum Alloys for Automobiles Market Size by Country (2026-2031) & (US$ Million)
Table 37. Europe Casting Aluminum Alloys for Automobiles Market Size Growth Rate by Country (US$ Million): 2020 VS 2024 VS 2031
Table 38. Europe Casting Aluminum Alloys for Automobiles Market Size by Country (2020-2025) & (US$ Million)
Table 39. Europe Casting Aluminum Alloys for Automobiles Market Size by Country (2026-2031) & (US$ Million)
Table 40. Asia-Pacific Casting Aluminum Alloys for Automobiles Market Size Growth Rate by Region (US$ Million): 2020 VS 2024 VS 2031
Table 41. Asia-Pacific Casting Aluminum Alloys for Automobiles Market Size by Region (2020-2025) & (US$ Million)
Table 42. Asia-Pacific Casting Aluminum Alloys for Automobiles Market Size by Region (2026-2031) & (US$ Million)
Table 43. Latin America Casting Aluminum Alloys for Automobiles Market Size Growth Rate by Country (US$ Million): 2020 VS 2024 VS 2031
Table 44. Latin America Casting Aluminum Alloys for Automobiles Market Size by Country (2020-2025) & (US$ Million)
Table 45. Latin America Casting Aluminum Alloys for Automobiles Market Size by Country (2026-2031) & (US$ Million)
Table 46. Middle East & Africa Casting Aluminum Alloys for Automobiles Market Size Growth Rate by Country (US$ Million): 2020 VS 2024 VS 2031
Table 47. Middle East & Africa Casting Aluminum Alloys for Automobiles Market Size by Country (2020-2025) & (US$ Million)
Table 48. Middle East & Africa Casting Aluminum Alloys for Automobiles Market Size by Country (2026-2031) & (US$ Million)
Table 49. PHB Corporation Company Details
Table 50. PHB Corporation Business Overview
Table 51. PHB Corporation Casting Aluminum Alloys for Automobiles Product
Table 52. PHB Corporation Revenue in Casting Aluminum Alloys for Automobiles Business (2020-2025) & (US$ Million)
Table 53. PHB Corporation Recent Development
Table 54. VPIC Group Company Details
Table 55. VPIC Group Business Overview
Table 56. VPIC Group Casting Aluminum Alloys for Automobiles Product
Table 57. VPIC Group Revenue in Casting Aluminum Alloys for Automobiles Business (2020-2025) & (US$ Million)
Table 58. VPIC Group Recent Development
Table 59. DGS Druckguss Systeme Company Details
Table 60. DGS Druckguss Systeme Business Overview
Table 61. DGS Druckguss Systeme Casting Aluminum Alloys for Automobiles Product
Table 62. DGS Druckguss Systeme Revenue in Casting Aluminum Alloys for Automobiles Business (2020-2025) & (US$ Million)
Table 63. DGS Druckguss Systeme Recent Development
Table 64. Gibbs Company Details
Table 65. Gibbs Business Overview
Table 66. Gibbs Casting Aluminum Alloys for Automobiles Product
Table 67. Gibbs Revenue in Casting Aluminum Alloys for Automobiles Business (2020-2025) & (US$ Million)
Table 68. Gibbs Recent Development
Table 69. Nemak Company Details
Table 70. Nemak Business Overview
Table 71. Nemak Casting Aluminum Alloys for Automobiles Product
Table 72. Nemak Revenue in Casting Aluminum Alloys for Automobiles Business (2020-2025) & (US$ Million)
Table 73. Nemak Recent Development
Table 74. Groupe SAB Company Details
Table 75. Groupe SAB Business Overview
Table 76. Groupe SAB Casting Aluminum Alloys for Automobiles Product
Table 77. Groupe SAB Revenue in Casting Aluminum Alloys for Automobiles Business (2020-2025) & (US$ Million)
Table 78. Groupe SAB Recent Development
Table 79. Form Technologies Company Details
Table 80. Form Technologies Business Overview
Table 81. Form Technologies Casting Aluminum Alloys for Automobiles Product
Table 82. Form Technologies Revenue in Casting Aluminum Alloys for Automobiles Business (2020-2025) & (US$ Million)
Table 83. Form Technologies Recent Development
Table 84. Ryobi Company Details
Table 85. Ryobi Business Overview
Table 86. Ryobi Casting Aluminum Alloys for Automobiles Product
Table 87. Ryobi Revenue in Casting Aluminum Alloys for Automobiles Business (2020-2025) & (US$ Million)
Table 88. Ryobi Recent Development
Table 89. Rockman Industries Company Details
Table 90. Rockman Industries Business Overview
Table 91. Rockman Industries Casting Aluminum Alloys for Automobiles Product
Table 92. Rockman Industries Revenue in Casting Aluminum Alloys for Automobiles Business (2020-2025) & (US$ Million)
Table 93. Rockman Industries Recent Development
Table 94. Endurance Company Details
Table 95. Endurance Business Overview
Table 96. Endurance Casting Aluminum Alloys for Automobiles Product
Table 97. Endurance Revenue in Casting Aluminum Alloys for Automobiles Business (2020-2025) & (US$ Million)
Table 98. Endurance Recent Development
Table 99. Redstone Manufacturing Company Details
Table 100. Redstone Manufacturing Business Overview
Table 101. Redstone Manufacturing Casting Aluminum Alloys for Automobiles Product
Table 102. Redstone Manufacturing Revenue in Casting Aluminum Alloys for Automobiles Business (2020-2025) & (US$ Million)
Table 103. Redstone Manufacturing Recent Development
Table 104. Kinetic Die Casting Company Details
Table 105. Kinetic Die Casting Business Overview
Table 106. Kinetic Die Casting Casting Aluminum Alloys for Automobiles Product
Table 107. Kinetic Die Casting Revenue in Casting Aluminum Alloys for Automobiles Business (2020-2025) & (US$ Million)
Table 108. Kinetic Die Casting Recent Development
Table 109. Acme Casting Company Details
Table 110. Acme Casting Business Overview
Table 111. Acme Casting Casting Aluminum Alloys for Automobiles Product
Table 112. Acme Casting Revenue in Casting Aluminum Alloys for Automobiles Business (2020-2025) & (US$ Million)
Table 113. Acme Casting Recent Development
Table 114. Ahresty Corporation Company Details
Table 115. Ahresty Corporation Business Overview
Table 116. Ahresty Corporation Casting Aluminum Alloys for Automobiles Product
Table 117. Ahresty Corporation Revenue in Casting Aluminum Alloys for Automobiles Business (2020-2025) & (US$ Million)
Table 118. Ahresty Corporation Recent Development
Table 119. Georg Fischer Company Details
Table 120. Georg Fischer Business Overview
Table 121. Georg Fischer Casting Aluminum Alloys for Automobiles Product
Table 122. Georg Fischer Revenue in Casting Aluminum Alloys for Automobiles Business (2020-2025) & (US$ Million)
Table 123. Georg Fischer Recent Development
Table 124. Martinrea Honsel Company Details
Table 125. Martinrea Honsel Business Overview
Table 126. Martinrea Honsel Casting Aluminum Alloys for Automobiles Product
Table 127. Martinrea Honsel Revenue in Casting Aluminum Alloys for Automobiles Business (2020-2025) & (US$ Million)
Table 128. Martinrea Honsel Recent Development
Table 129. Handtmann Company Details
Table 130. Handtmann Business Overview
Table 131. Handtmann Casting Aluminum Alloys for Automobiles Product
Table 132. Handtmann Revenue in Casting Aluminum Alloys for Automobiles Business (2020-2025) & (US$ Million)
Table 133. Handtmann Recent Development
Table 134. Teksid Company Details
Table 135. Teksid Business Overview
Table 136. Teksid Casting Aluminum Alloys for Automobiles Product
Table 137. Teksid Revenue in Casting Aluminum Alloys for Automobiles Business (2020-2025) & (US$ Million)
Table 138. Teksid Recent Development
Table 139. MK Tron Company Details
Table 140. MK Tron Business Overview
Table 141. MK Tron Casting Aluminum Alloys for Automobiles Product
Table 142. MK Tron Revenue in Casting Aluminum Alloys for Automobiles Business (2020-2025) & (US$ Million)
Table 143. MK Tron Recent Development
Table 144. Sandhar Company Details
Table 145. Sandhar Business Overview
Table 146. Sandhar Casting Aluminum Alloys for Automobiles Product
Table 147. Sandhar Revenue in Casting Aluminum Alloys for Automobiles Business (2020-2025) & (US$ Million)
Table 148. Sandhar Recent Development
Table 149. Shanghai Yongmaotai Automotive Technology Company Details
Table 150. Shanghai Yongmaotai Automotive Technology Business Overview
Table 151. Shanghai Yongmaotai Automotive Technology Casting Aluminum Alloys for Automobiles Product
Table 152. Shanghai Yongmaotai Automotive Technology Revenue in Casting Aluminum Alloys for Automobiles Business (2020-2025) & (US$ Million)
Table 153. Shanghai Yongmaotai Automotive Technology Recent Development
Table 154. Zhejiang Deyi Precision Machinery Company Details
Table 155. Zhejiang Deyi Precision Machinery Business Overview
Table 156. Zhejiang Deyi Precision Machinery Casting Aluminum Alloys for Automobiles Product
Table 157. Zhejiang Deyi Precision Machinery Revenue in Casting Aluminum Alloys for Automobiles Business (2020-2025) & (US$ Million)
Table 158. Zhejiang Deyi Precision Machinery Recent Development
Table 159. Guangdong Hongtu Technology Company Details
Table 160. Guangdong Hongtu Technology Business Overview
Table 161. Guangdong Hongtu Technology Casting Aluminum Alloys for Automobiles Product
Table 162. Guangdong Hongtu Technology Revenue in Casting Aluminum Alloys for Automobiles Business (2020-2025) & (US$ Million)
Table 163. Guangdong Hongtu Technology Recent Development
Table 164. Guangdong Wencan Die Casting Company Details
Table 165. Guangdong Wencan Die Casting Business Overview
Table 166. Guangdong Wencan Die Casting Casting Aluminum Alloys for Automobiles Product
Table 167. Guangdong Wencan Die Casting Revenue in Casting Aluminum Alloys for Automobiles Business (2020-2025) & (US$ Million)
Table 168. Guangdong Wencan Die Casting Recent Development
Table 169. Ningbo IKD Company Details
Table 170. Ningbo IKD Business Overview
Table 171. Ningbo IKD Casting Aluminum Alloys for Automobiles Product
Table 172. Ningbo IKD Revenue in Casting Aluminum Alloys for Automobiles Business (2020-2025) & (US$ Million)
Table 173. Ningbo IKD Recent Development
Table 174. Ningbo Xusheng Group Company Details
Table 175. Ningbo Xusheng Group Business Overview
Table 176. Ningbo Xusheng Group Casting Aluminum Alloys for Automobiles Product
Table 177. Ningbo Xusheng Group Revenue in Casting Aluminum Alloys for Automobiles Business (2020-2025) & (US$ Million)
Table 178. Ningbo Xusheng Group Recent Development
Table 179. Suzhou Yadelin Company Details
Table 180. Suzhou Yadelin Business Overview
Table 181. Suzhou Yadelin Casting Aluminum Alloys for Automobiles Product
Table 182. Suzhou Yadelin Revenue in Casting Aluminum Alloys for Automobiles Business (2020-2025) & (US$ Million)
Table 183. Suzhou Yadelin Recent Development
Table 184. Jiangsu Rongtai Company Details
Table 185. Jiangsu Rongtai Business Overview
Table 186. Jiangsu Rongtai Casting Aluminum Alloys for Automobiles Product
Table 187. Jiangsu Rongtai Revenue in Casting Aluminum Alloys for Automobiles Business (2020-2025) & (US$ Million)
Table 188. Jiangsu Rongtai Recent Development
Table 189. Guangdong Foryou Corporation Company Details
Table 190. Guangdong Foryou Corporation Business Overview
Table 191. Guangdong Foryou Corporation Casting Aluminum Alloys for Automobiles Product
Table 192. Guangdong Foryou Corporation Revenue in Casting Aluminum Alloys for Automobiles Business (2020-2025) & (US$ Million)
Table 193. Guangdong Foryou Corporation Recent Development
Table 194. Research Programs/Design for This Report
Table 195. Key Data Information from Secondary Sources
Table 196. Key Data Information from Primary Sources
Table 197. Authors List of This Report
List of Figures
Figure 1. Casting Aluminum Alloys for Automobiles Picture
Figure 2. Global Casting Aluminum Alloys for Automobiles Market Size Comparison by Type (2020-2031) & (US$ Million)
Figure 3. Global Casting Aluminum Alloys for Automobiles Market Share by Type: 2024 VS 2031
Figure 4. Engine Components Features
Figure 5. Body Components Features
Figure 6. Chassis Components Features
Figure 7. Driveline Components Features
Figure 8. Others Features
Figure 9. Global Casting Aluminum Alloys for Automobiles Market Size by Application (2020-2031) & (US$ Million)
Figure 10. Global Casting Aluminum Alloys for Automobiles Market Share by Application: 2024 VS 2031
Figure 11. Commercial Vehicles Case Studies
Figure 12. Passenger Vehicles Case Studies
Figure 13. Casting Aluminum Alloys for Automobiles Report Years Considered
Figure 14. Global Casting Aluminum Alloys for Automobiles Market Size (US$ Million), Year-over-Year: 2020-2031
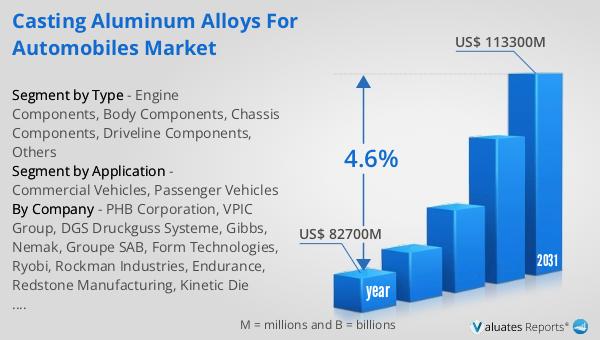
Figure 15. Global Casting Aluminum Alloys for Automobiles Market Size, (US$ Million), 2020 VS 2024 VS 2031
Figure 16. Global Casting Aluminum Alloys for Automobiles Market Share by Region: 2024 VS 2031
Figure 17. Global Casting Aluminum Alloys for Automobiles Market Share by Players in 2024
Figure 18. Global Casting Aluminum Alloys for Automobiles Market Share by Company Type (Tier 1, Tier 2, and Tier 3)
Figure 19. The Top 10 and 5 Players Market Share by Casting Aluminum Alloys for Automobiles Revenue in 2024
Figure 20. North America Casting Aluminum Alloys for Automobiles Market Size YoY Growth (2020-2031) & (US$ Million)
Figure 21. North America Casting Aluminum Alloys for Automobiles Market Share by Country (2020-2031)
Figure 22. United States Casting Aluminum Alloys for Automobiles Market Size YoY Growth (2020-2031) & (US$ Million)
Figure 23. Canada Casting Aluminum Alloys for Automobiles Market Size YoY Growth (2020-2031) & (US$ Million)
Figure 24. Europe Casting Aluminum Alloys for Automobiles Market Size YoY Growth (2020-2031) & (US$ Million)
Figure 25. Europe Casting Aluminum Alloys for Automobiles Market Share by Country (2020-2031)
Figure 26. Germany Casting Aluminum Alloys for Automobiles Market Size YoY Growth (2020-2031) & (US$ Million)
Figure 27. France Casting Aluminum Alloys for Automobiles Market Size YoY Growth (2020-2031) & (US$ Million)
Figure 28. U.K. Casting Aluminum Alloys for Automobiles Market Size YoY Growth (2020-2031) & (US$ Million)
Figure 29. Italy Casting Aluminum Alloys for Automobiles Market Size YoY Growth (2020-2031) & (US$ Million)
Figure 30. Russia Casting Aluminum Alloys for Automobiles Market Size YoY Growth (2020-2031) & (US$ Million)
Figure 31. Nordic Countries Casting Aluminum Alloys for Automobiles Market Size YoY Growth (2020-2031) & (US$ Million)
Figure 32. Asia-Pacific Casting Aluminum Alloys for Automobiles Market Size YoY Growth (2020-2031) & (US$ Million)
Figure 33. Asia-Pacific Casting Aluminum Alloys for Automobiles Market Share by Region (2020-2031)
Figure 34. China Casting Aluminum Alloys for Automobiles Market Size YoY Growth (2020-2031) & (US$ Million)
Figure 35. Japan Casting Aluminum Alloys for Automobiles Market Size YoY Growth (2020-2031) & (US$ Million)
Figure 36. South Korea Casting Aluminum Alloys for Automobiles Market Size YoY Growth (2020-2031) & (US$ Million)
Figure 37. Southeast Asia Casting Aluminum Alloys for Automobiles Market Size YoY Growth (2020-2031) & (US$ Million)
Figure 38. India Casting Aluminum Alloys for Automobiles Market Size YoY Growth (2020-2031) & (US$ Million)
Figure 39. Australia Casting Aluminum Alloys for Automobiles Market Size YoY Growth (2020-2031) & (US$ Million)
Figure 40. Latin America Casting Aluminum Alloys for Automobiles Market Size YoY Growth (2020-2031) & (US$ Million)
Figure 41. Latin America Casting Aluminum Alloys for Automobiles Market Share by Country (2020-2031)
Figure 42. Mexico Casting Aluminum Alloys for Automobiles Market Size YoY Growth (2020-2031) & (US$ Million)
Figure 43. Brazil Casting Aluminum Alloys for Automobiles Market Size YoY Growth (2020-2031) & (US$ Million)
Figure 44. Middle East & Africa Casting Aluminum Alloys for Automobiles Market Size YoY Growth (2020-2031) & (US$ Million)
Figure 45. Middle East & Africa Casting Aluminum Alloys for Automobiles Market Share by Country (2020-2031)
Figure 46. Turkey Casting Aluminum Alloys for Automobiles Market Size YoY Growth (2020-2031) & (US$ Million)
Figure 47. Saudi Arabia Casting Aluminum Alloys for Automobiles Market Size YoY Growth (2020-2031) & (US$ Million)
Figure 48. UAE Casting Aluminum Alloys for Automobiles Market Size YoY Growth (2020-2031) & (US$ Million)
Figure 49. PHB Corporation Revenue Growth Rate in Casting Aluminum Alloys for Automobiles Business (2020-2025)
Figure 50. VPIC Group Revenue Growth Rate in Casting Aluminum Alloys for Automobiles Business (2020-2025)
Figure 51. DGS Druckguss Systeme Revenue Growth Rate in Casting Aluminum Alloys for Automobiles Business (2020-2025)
Figure 52. Gibbs Revenue Growth Rate in Casting Aluminum Alloys for Automobiles Business (2020-2025)
Figure 53. Nemak Revenue Growth Rate in Casting Aluminum Alloys for Automobiles Business (2020-2025)
Figure 54. Groupe SAB Revenue Growth Rate in Casting Aluminum Alloys for Automobiles Business (2020-2025)
Figure 55. Form Technologies Revenue Growth Rate in Casting Aluminum Alloys for Automobiles Business (2020-2025)
Figure 56. Ryobi Revenue Growth Rate in Casting Aluminum Alloys for Automobiles Business (2020-2025)
Figure 57. Rockman Industries Revenue Growth Rate in Casting Aluminum Alloys for Automobiles Business (2020-2025)
Figure 58. Endurance Revenue Growth Rate in Casting Aluminum Alloys for Automobiles Business (2020-2025)
Figure 59. Redstone Manufacturing Revenue Growth Rate in Casting Aluminum Alloys for Automobiles Business (2020-2025)
Figure 60. Kinetic Die Casting Revenue Growth Rate in Casting Aluminum Alloys for Automobiles Business (2020-2025)
Figure 61. Acme Casting Revenue Growth Rate in Casting Aluminum Alloys for Automobiles Business (2020-2025)
Figure 62. Ahresty Corporation Revenue Growth Rate in Casting Aluminum Alloys for Automobiles Business (2020-2025)
Figure 63. Georg Fischer Revenue Growth Rate in Casting Aluminum Alloys for Automobiles Business (2020-2025)
Figure 64. Martinrea Honsel Revenue Growth Rate in Casting Aluminum Alloys for Automobiles Business (2020-2025)
Figure 65. Handtmann Revenue Growth Rate in Casting Aluminum Alloys for Automobiles Business (2020-2025)
Figure 66. Teksid Revenue Growth Rate in Casting Aluminum Alloys for Automobiles Business (2020-2025)
Figure 67. MK Tron Revenue Growth Rate in Casting Aluminum Alloys for Automobiles Business (2020-2025)
Figure 68. Sandhar Revenue Growth Rate in Casting Aluminum Alloys for Automobiles Business (2020-2025)
Figure 69. Shanghai Yongmaotai Automotive Technology Revenue Growth Rate in Casting Aluminum Alloys for Automobiles Business (2020-2025)
Figure 70. Zhejiang Deyi Precision Machinery Revenue Growth Rate in Casting Aluminum Alloys for Automobiles Business (2020-2025)
Figure 71. Guangdong Hongtu Technology Revenue Growth Rate in Casting Aluminum Alloys for Automobiles Business (2020-2025)
Figure 72. Guangdong Wencan Die Casting Revenue Growth Rate in Casting Aluminum Alloys for Automobiles Business (2020-2025)
Figure 73. Ningbo IKD Revenue Growth Rate in Casting Aluminum Alloys for Automobiles Business (2020-2025)
Figure 74. Ningbo Xusheng Group Revenue Growth Rate in Casting Aluminum Alloys for Automobiles Business (2020-2025)
Figure 75. Suzhou Yadelin Revenue Growth Rate in Casting Aluminum Alloys for Automobiles Business (2020-2025)
Figure 76. Jiangsu Rongtai Revenue Growth Rate in Casting Aluminum Alloys for Automobiles Business (2020-2025)
Figure 77. Guangdong Foryou Corporation Revenue Growth Rate in Casting Aluminum Alloys for Automobiles Business (2020-2025)
Figure 78. Bottom-up and Top-down Approaches for This Report
Figure 79. Data Triangulation
Figure 80. Key Executives Interviewed