
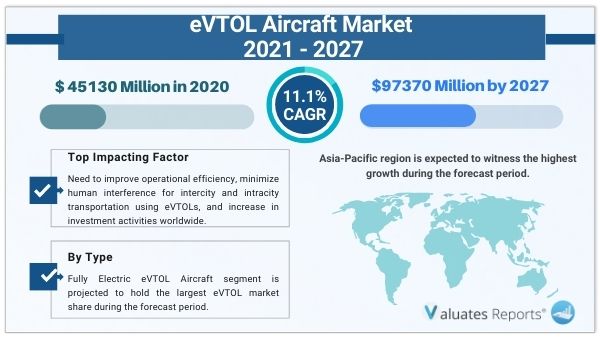
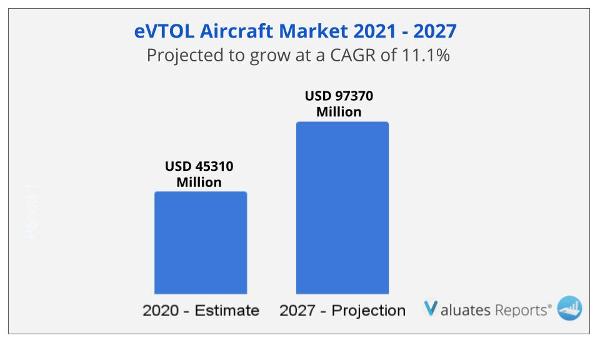
The global evtol aircraft market size was valued at US$ 45310 million in 2020 and is expected to reach US$ 97370 million by the end of 2027 with a CAGR of 11.1% during 2021-2027. Key drivers of the evtol aircraft market include the growing need for green energy, increase in operational efficiency, minimizing human interference for intercity, intracity transportation using evtol, and growing investment opportunities worldwide. An electric vertical take-off and landing aircraft(evtol) uses electric power to hover, take off and land vertically. The technology came out due to the growing need for urban air vehicles, congested airspaces, etc.
Other factors contributing to the growth of the market include increasing demand for an alternative mode of transport, growing usage of evtol aircraft for cargo applications, and growing need for green and noise-free aircraft. Also advances in batteries, rise in demand for unmanned aerial vehicles, and growing product launches and contracts are also fueling the growth of the evtol aircraft market during the forecast period. The evtol market is expected to rise further due to an increase in investments by key players and growing technological initiatives in the evtol aircraft market.
An increase in demand for an alternative mode of transport, a rise in congested airspaces, and growing environmental concerns will drive the growth of the market during the forecast period. The evtol market forecast will see a positive jump in the coming years and will witness exponential growth due to the growing need for green energy, achieving operational efficiency, and minimizing human interference. Thus, the evtol aircraft market will witness tremendous growth during the forecast period.
There has been an increase in investments from various sources for rapid expansion of evtol aircraft even during the covid 19 outbreak. The growth has been tremendous to support assembling and flight testing of evtol aircraft, developing electric power, and deploying UAM infrastructure among other things. Venture capital-backed startups, large technology companies funded initiatives, and traditional aircraft manufacturers and designers are all pouring money into the evtol market and the investment trend is expected to continue even further during the forecast period. Thus, the evtol aircraft market will witness exponential growth in the coming years due to the growing number of investments.
Evtol aircraft offer a host of benefits such as providing a faster mode of transportation, better convenience, smooth movement, improved safety and comfort, reduced noise, fewer pollution levels, and flexibility providing lucrative opportunities for the growth of the evtol aircraft market during the forecast period. A plethora of benefits will surge the growth of the market in the coming years.
Due to rising CO2 emissions, there is a growing consensus among aviation market players to cut down on their carbon footprint and shift to a more sustainable form of fuel for flying aircraft. Recent research and development initiatives in hybrid, electric, and hydrogen aircraft are allowing aviation companies to create eco-friendly fuel-run evtol aircraft. Hence evtol manufacturers use integrated, simulated, and dual-use models for running aircraft with reduced carbon emissions and less noise pollution. Thus growing need to shift to eco-friendly fuels and increasing research and development initiatives towards the same will fuel the growth of the evtol aircraft market during the forecast period.
Based on type, the fully electric evtol aircraft segment is expected to provide lucrative opportunities for growth in the evtol aircraft market share due to the growing production of evtol aircraft by key manufacturers, rising strategic collaborations, and contracts in the segment, etc.
eVTOL Aircraft Market Scope
|
Report Metric |
Details |
|
Report Name |
eVTOL Aircraft Market |
|
The Market size value in 2020 |
45310 Million USD |
|
The Revenue forecast in 2027 |
97370 Million USD |
|
Growth Rate |
CAGR of 11.1% from 2021 to 2027 |
|
Base year considered |
2020 |
|
Forecast period |
2021-2027 |
|
Forecast units |
Value (USD) |
|
Segments covered |
Type, End-User, Offerings, and Region |
|
Report coverage |
Revenue & volume forecast, company share, competitive landscape, growth factors, and trends |
|
Geographic regions covered |
North America, Europe, Asia Pacific, Latin America, Middle East & Africa |
|
Companies covered |
Airbus, Lilium, Bell Helicopter, Aurora Flight Sciences, Embraer, Ehang, Volocopter, Workhorse Group, Pipistrel, Kitty Hawk Corporation, Karem Aircraft, Lift Aircraft, etc. |
Ans. In 2020, the global eVTOL Aircraft market size was US$ 45310 million and it is expected to reach US$ 97370 million by the end of 2027.
Ans. Airbus, Lilium, Bell Helicopter, Aurora Flight Sciences, Embraer, Ehang, Volocopter, Workhorse Group, Pipistrel, Kitty Hawk Corporation, Karem Aircraft, Lift Aircraft, etc.
Ans. The the global eVTOL Aircraft market is expected to grow at a compound annual growth rate of 11.1% from 2021 to 2027.
Ans. Integrated Smart Toilet market is forecasted for the year 2021 to 2027.
Table of Contents
1.1 eVTOL Aircraft Product Introduction
1.2 Market by Type
1.2.1 Global eVTOL Aircraft Market Size Growth Rate by Type
1.2.2 Fully Electric eVTOL Aircraft
1.2.3 Hybrid eVTOL Aircraft
1.3 Market by Application
1.3.1 Global eVTOL Aircraft Market Size Growth Rate by Application
1.3.2 Civil
1.3.3 Military
1.4 Study Objectives
1.5 Years Considered
2 Executive Summary
2.1 Global eVTOL Aircraft Market Size, Estimates and Forecasts
2.1.1 Global eVTOL Aircraft Revenue 2016-2027
2.1.2 Global eVTOL Aircraft Sales 2016-2027
2.2 Global eVTOL Aircraft, Market Size by Region: 2016 VS 2021 VS 2027
2.3 eVTOL Aircraft Historical Market Size by Region (2016-2021)
2.3.1 Global eVTOL Aircraft Retrospective Market Scenario in Sales by Region: 2016-2021
2.3.2 Global eVTOL Aircraft Retrospective Market Scenario in Revenue by Region: 2016-2021
2.4 eVTOL Aircraft Market Estimates and Projections by Region (2022-2027)
2.4.1 Global eVTOL Aircraft Sales Forecast by Region (2022-2027)
2.4.2 Global eVTOL Aircraft Revenue Forecast by Region (2022-2027)
3 Global eVTOL Aircraft Competitor Landscape by Players
3.1 Global Top eVTOL Aircraft Manufacturers by Sales
3.1.1 Global eVTOL Aircraft Sales by Manufacturer (2016-2021)
3.1.2 Global eVTOL Aircraft Sales Market Share by Manufacturer (2016-2021)
3.2 Global Top eVTOL Aircraft Manufacturers by Revenue
3.2.1 Key eVTOL Aircraft Manufacturers Covered: Ranking by Revenue
3.2.2 Global eVTOL Aircraft Revenue by Manufacturers (2016-2021)
3.2.3 Global eVTOL Aircraft Revenue Share by Manufacturers (2016-2021)
3.2.4 Global eVTOL Aircraft Market Concentration Ratio (CR5 and HHI) (2016-2021)
3.2.5 Global Top 10 and Top 5 Companies by eVTOL Aircraft Revenue in 2020
3.2.6 Global eVTOL Aircraft Market Share by Company Type (Tier 1, Tier 2 and Tier 3)
3.3 Global eVTOL Aircraft Price by Manufacturers
3.4 Global eVTOL Aircraft Manufacturing Base Distribution, Product Types
3.4.1 eVTOL Aircraft Manufacturers Manufacturing Base Distribution, Headquarters
3.4.2 Manufacturers eVTOL Aircraft Product Type
3.4.3 Date of International Manufacturers Enter into eVTOL Aircraft Market
3.5 Manufacturers Mergers & Acquisitions, Expansion Plans
4 Breakdown Data by Type (2016-2027)
4.1 Global eVTOL Aircraft Market Size by Type (2016-2021)
4.1.1 Global eVTOL Aircraft Sales by Type (2016-2021)
4.1.2 Global eVTOL Aircraft Revenue by Type (2016-2021)
4.1.3 eVTOL Aircraft Average Selling Price (ASP) by Type (2016-2021)
4.2 Global eVTOL Aircraft Market Size Forecast by Type (2022-2027)
4.2.1 Global eVTOL Aircraft Sales Forecast by Type (2022-2027)
4.2.2 Global eVTOL Aircraft Revenue Forecast by Type (2022-2027)
4.2.3 eVTOL Aircraft Average Selling Price (ASP) Forecast by Type (2022-2027)
5 Breakdown Data by Application (2016-2027)
5.1 Global eVTOL Aircraft Market Size by Application (2016-2021)
5.1.1 Global eVTOL Aircraft Sales by Application (2016-2021)
5.1.2 Global eVTOL Aircraft Revenue by Application (2016-2021)
5.1.3 eVTOL Aircraft Price by Application (2016-2021)
5.2 eVTOL Aircraft Market Size Forecast by Application (2022-2027)
5.2.1 Global eVTOL Aircraft Sales Forecast by Application (2022-2027)
5.2.2 Global eVTOL Aircraft Revenue Forecast by Application (2022-2027)
5.2.3 Global eVTOL Aircraft Price Forecast by Application (2022-2027)
6 United States by Players, Type and Application
6.1 United States eVTOL Aircraft Market Size YoY Growth 2016-2027
6.1.1 United States eVTOL Aircraft Sales YoY Growth 2016-2027
6.1.2 United States eVTOL Aircraft Revenue YoY Growth 2016-2027
6.1.3 United States eVTOL Aircraft Market Share in Global Market 2016-2027
6.2 United States eVTOL Aircraft Market Size by Players (International and Local Players)
6.2.1 United States Top eVTOL Aircraft Players by Sales (2016-2021)
6.2.2 United States Top eVTOL Aircraft Players by Revenue (2016-2021)
6.3 United States eVTOL Aircraft Historic Market Review by Type (2016-2021)
6.3.1 United States eVTOL Aircraft Sales Market Share by Type (2016-2021)
6.3.2 United States eVTOL Aircraft Revenue Market Share by Type (2016-2021)
6.3.3 United States eVTOL Aircraft Price by Type (2016-2021)
6.4 United States eVTOL Aircraft Market Estimates and Forecasts by Type (2022-2027)
6.4.1 United States eVTOL Aircraft Sales Forecast by Type (2022-2027)
6.4.2 United States eVTOL Aircraft Revenue Forecast by Type (2022-2027)
6.4.3 United States eVTOL Aircraft Price Forecast by Type (2022-2027)
6.5 United States eVTOL Aircraft Historic Market Review by Application (2016-2021)
6.5.1 United States eVTOL Aircraft Sales Market Share by Application (2016-2021)
6.5.2 United States eVTOL Aircraft Revenue Market Share by Application (2016-2021)
6.5.3 United States eVTOL Aircraft Price by Application (2016-2021)
6.6 United States eVTOL Aircraft Market Estimates and Forecasts by Application (2022-2027)
6.6.1 United States eVTOL Aircraft Sales Forecast by Application (2022-2027)
6.6.2 United States eVTOL Aircraft Revenue Forecast by Application (2022-2027)
6.6.3 United States eVTOL Aircraft Price Forecast by Application (2022-2027)
7 North America
7.1 North America eVTOL Aircraft Market Size YoY Growth 2016-2027
7.2 North America eVTOL Aircraft Market Facts & Figures by Country
7.2.1 North America eVTOL Aircraft Sales by Country (2016-2021)
7.2.2 North America eVTOL Aircraft Revenue by Country (2016-2021)
7.2.3 U.S.
7.2.4 Canada
8 Asia Pacific
8.1 Asia Pacific eVTOL Aircraft Market Size YoY Growth 2016-2027
8.2 Asia Pacific eVTOL Aircraft Market Facts & Figures by Region
8.2.1 Asia Pacific eVTOL Aircraft Sales by Region (2016-2021)
8.2.2 Asia Pacific eVTOL Aircraft Revenue by Region (2016-2021)
8.2.3 China
8.2.4 Japan
8.2.5 South Korea
8.2.6 India
8.2.7 Australia
8.2.8 Australia
8.2.9 Indonesia
8.2.10 Thailand
8.2.11 Malaysia
8.2.12 Philippines
8.2.13 Vietnam
9 Europe
9.1 Europe eVTOL Aircraft Market Size YoY Growth 2016-2027
9.2 Europe eVTOL Aircraft Market Facts & Figures by Country
9.2.1 Europe eVTOL Aircraft Sales by Country (2016-2021)
9.2.2 Europe eVTOL Aircraft Revenue by Country (2016-2021)
9.2.3 Germany
9.2.4 France
9.2.5 U.K.
9.2.6 Italy
10 Latin America
10.1 Latin America eVTOL Aircraft Market Size YoY Growth 2016-2027
10.2 Latin America eVTOL Aircraft Market Facts & Figures by Country
10.2.1 Latin America eVTOL Aircraft Sales by Country (2016-2021)
10.2.2 Latin America eVTOL Aircraft Revenue by Country (2016-2021)
10.2.3 Mexico
10.2.4 Brazil
10.2.5 Argentina
11 Middle East and Africa
11.1 Middle East and Africa eVTOL Aircraft Market Size YoY Growth 2016-2027
11.2 Middle East and Africa eVTOL Aircraft Market Facts & Figures by Country
11.2.1 Middle East and Africa eVTOL Aircraft Sales by Country (2016-2021)
11.2.2 Middle East and Africa eVTOL Aircraft Revenue by Country (2016-2021)
11.2.3 Turkey
11.2.4 Saudi Arabia
11.2.5 U.A.E
12 Company Profiles
12.1 Airbus
12.1.1 Airbus Corporation Information
12.1.2 Airbus Description and Business Overview
12.1.3 Airbus eVTOL Aircraft Sales, Revenue and Gross Margin (2016-2021)
12.1.4 Airbus eVTOL Aircraft Products Offered
12.1.5 Airbus Recent Development
12.2 Lilium
12.2.1 Lilium Corporation Information
12.2.2 Lilium Description and Business Overview
12.2.3 Lilium eVTOL Aircraft Sales, Revenue and Gross Margin (2016-2021)
12.2.4 Lilium eVTOL Aircraft Products Offered
12.2.5 Lilium Recent Development
12.3 Bell Helicopter
12.3.1 Bell Helicopter Corporation Information
12.3.2 Bell Helicopter Description and Business Overview
12.3.3 Bell Helicopter eVTOL Aircraft Sales, Revenue and Gross Margin (2016-2021)
12.3.4 Bell Helicopter eVTOL Aircraft Products Offered
12.3.5 Bell Helicopter Recent Development
12.4 Aurora Flight Sciences
12.4.1 Aurora Flight Sciences Corporation Information
12.4.2 Aurora Flight Sciences Description and Business Overview
12.4.3 Aurora Flight Sciences eVTOL Aircraft Sales, Revenue and Gross Margin (2016-2021)
12.4.4 Aurora Flight Sciences eVTOL Aircraft Products Offered
12.4.5 Aurora Flight Sciences Recent Development
12.5 Embraer
12.5.1 Embraer Corporation Information
12.5.2 Embraer Description and Business Overview
12.5.3 Embraer eVTOL Aircraft Sales, Revenue and Gross Margin (2016-2021)
12.5.4 Embraer eVTOL Aircraft Products Offered
12.5.5 Embraer Recent Development
12.6 Ehang
12.6.1 Ehang Corporation Information
12.6.2 Ehang Description and Business Overview
12.6.3 Ehang eVTOL Aircraft Sales, Revenue and Gross Margin (2016-2021)
12.6.4 Ehang eVTOL Aircraft Products Offered
12.6.5 Ehang Recent Development
12.7 Volocopter
12.7.1 Volocopter Corporation Information
12.7.2 Volocopter Description and Business Overview
12.7.3 Volocopter eVTOL Aircraft Sales, Revenue and Gross Margin (2016-2021)
12.7.4 Volocopter eVTOL Aircraft Products Offered
12.7.5 Volocopter Recent Development
12.8 Workhorse Group
12.8.1 Workhorse Group Corporation Information
12.8.2 Workhorse Group Description and Business Overview
12.8.3 Workhorse Group eVTOL Aircraft Sales, Revenue and Gross Margin (2016-2021)
12.8.4 Workhorse Group eVTOL Aircraft Products Offered
12.8.5 Workhorse Group Recent Development
12.9 Pipistrel
12.9.1 Pipistrel Corporation Information
12.9.2 Pipistrel Description and Business Overview
12.9.3 Pipistrel eVTOL Aircraft Sales, Revenue and Gross Margin (2016-2021)
12.9.4 Pipistrel eVTOL Aircraft Products Offered
12.9.5 Pipistrel Recent Development
12.10 Kitty Hawk Corporation
12.10.1 Kitty Hawk Corporation Corporation Information
12.10.2 Kitty Hawk Corporation Description and Business Overview
12.10.3 Kitty Hawk Corporation eVTOL Aircraft Sales, Revenue and Gross Margin (2016-2021)
12.10.4 Kitty Hawk Corporation eVTOL Aircraft Products Offered
12.10.5 Kitty Hawk Corporation Recent Development
12.11 Airbus
12.11.1 Airbus Corporation Information
12.11.2 Airbus Description and Business Overview
12.11.3 Airbus eVTOL Aircraft Sales, Revenue and Gross Margin (2016-2021)
12.11.4 Airbus eVTOL Aircraft Products Offered
12.11.5 Airbus Recent Development
12.12 Lift Aircraft
12.12.1 Lift Aircraft Corporation Information
12.12.2 Lift Aircraft Description and Business Overview
12.12.3 Lift Aircraft eVTOL Aircraft Sales, Revenue and Gross Margin (2016-2021)
12.12.4 Lift Aircraft Products Offered
12.12.5 Lift Aircraft Recent Development
13 Market Opportunities, Challenges, Risks and Influences Factors Analysis
13.1 eVTOL Aircraft Industry Trends
13.2 eVTOL Aircraft Market Drivers
13.3 eVTOL Aircraft Market Challenges
13.4 eVTOL Aircraft Market Restraints
14 Value Chain and Sales Channels Analysis
14.1 Value Chain Analysis
14.2 eVTOL Aircraft Customers
14.3 Sales Channels Analysis
14.3.1 Sales Channels
14.3.2 Distributors
15 Research Findings and Conclusion
16 Appendix
16.1 Research Methodology
16.1.1 Methodology/Research Approach
16.1.2 Data Source
16.2 Author Details
16.3 Disclaimer
List of Tables
Table 1. Global eVTOL Aircraft Market Size Growth Rate by Type, 2016 VS 2021 VS 2027 (US$ Million)
Table 2. Major Manufacturers of Fully Electric eVTOL Aircraft
Table 3. Major Manufacturers of Hybrid eVTOL Aircraft
Table 4. Global eVTOL Aircraft Market Size Growth Rate by Application (2021-2027) & (Units)
Table 5. Global eVTOL Aircraft Market Size by Region (Units) & (US$ Million), 2016 VS 2021 VS 2027
Table 6. Global eVTOL Aircraft Sales by Regions (2016-2021) & (Units)
Table 7. Global eVTOL Aircraft Sales Market Share by Regions (2016-2021)
Table 8. Global eVTOL Aircraft Revenue by Regions (2016-2021) & (US$ Million)
Table 9. Global eVTOL Aircraft Sales Forecast by Region (2022-2027) & (Units)
Table 10. Global eVTOL Aircraft Sales Market Share Forecast by Region (2022-2027)
Table 11. Global eVTOL Aircraft Revenue Forecast by Region (2022-2027) & (US$ Million)
Table 12. Global eVTOL Aircraft Revenue Market Share Forecast by Region (2022-2027)
Table 13. Global eVTOL Aircraft Sales by Manufacturers (2016-2021) (Units)
Table 14. Global eVTOL Aircraft Sales Share by Manufacturers (2016-2021)
Table 15. Ranking of Global Top eVTOL Aircraft Manufacturers by Revenue (US$ Million) in 2020
Table 16. eVTOL Aircraft Revenue by Manufacturers (2016-2021) (US$ Million)
Table 17. eVTOL Aircraft Revenue Share by Manufacturers (2016-2021)
Table 18. Global eVTOL Aircraft Manufacturers Market Concentration Ratio (CR5 and HHI) & (2016-2021)
Table 19. Global eVTOL Aircraft by Company Type (Tier 1, Tier 2 and Tier 3) (based on the Revenue in eVTOL Aircraft as of 2020)
Table 20. Key Manufacturers eVTOL Aircraft Price (2016-2021) (K USD/Unit)
Table 21. eVTOL Aircraft Manufacturers Manufacturing Base Distribution and Headquarters
Table 22. Manufacturers eVTOL Aircraft Product Type
Table 23. Date of International Manufacturers Enter into eVTOL Aircraft Market
Table 24. Manufacturers Mergers & Acquisitions, Expansion Plans
Table 25. Global eVTOL Aircraft Sales by Type (2016-2021) (Units)
Table 26. Global eVTOL Aircraft Sales Share by Type (2016-2021)
Table 27. Global eVTOL Aircraft Revenue by Type (2016-2021) (US$ Million)
Table 28. Global eVTOL Aircraft Revenue Share by Type (2016-2021)
Table 29. eVTOL Aircraft Average Selling Price (ASP) by Type (2016-2021) & (K USD/Unit)
Table 30. Global eVTOL Aircraft Sales Forecast by Type (2022-2027) & (Units)
Table 31. Global eVTOL Aircraft Sales Market Share Forecast by Type (2022-2027)
Table 32. Global eVTOL Aircraft Revenue Forecast V (2022-2027) & (US$ Million)
Table 33. Global eVTOL Aircraft Revenue Market Share Forecast by Type (2022-2027)
Table 34. Global eVTOL Aircraft Average Selling Price (ASP) Forecast by Type (2022-2027) & (K USD/Unit)
Table 35. Global eVTOL Aircraft Sales by Application (2016-2021) (Units)
Table 36. Global eVTOL Aircraft Sales Share by Application (2016-2021)
Table 37. Global eVTOL Aircraft Revenue by Application (2016-2021) (US$ Million)
Table 38. Global eVTOL Aircraft Revenue Share by Application (2016-2021)
Table 39. eVTOL Aircraft Average Selling Price (ASP) by Application (2016-2021) & (K USD/Unit)
Table 40. Global eVTOL Aircraft Sales Forecast by Application (2022-2027) & (Units)
Table 41. Global eVTOL Aircraft Sales Market Share Forecast by Application (2022-2027)
Table 42. Global eVTOL Aircraft Revenue Forecast by Application (2022-2027) & (US$ Million)
Table 43. Global eVTOL Aircraft Revenue Market Share Forecast by Application (2022-2027)
Table 44. Global eVTOL Aircraft Average Selling Price (ASP) Forecast by Application (2022-2027) & (K USD/Unit)
Table 45. United States eVTOL Aircraft Sales (Units) of Key Companies (2016-2021)
Table 46. United States eVTOL Aircraft Sales Share by Company (2016-2021)
Table 47. United States eVTOL Aircraft Revenue (US$ Million) by Company (2016-2021)
Table 48. United States eVTOL Aircraft Revenue Share by Company (2016-2021)
Table 49. United States eVTOL Aircraft Sales (Units) by Type (2016-2021)
Table 50. United States eVTOL Aircraft Sales Share by Type (2016-2021)
Table 51. United States eVTOL Aircraft Revenue (US$ Million) Market Share by Type (2016-2021)
Table 52. United States eVTOL Aircraft Price (K USD/Unit) by Type (2016-2021)
Table 53. United States eVTOL Aircraft Sales (Units) by Type (2022-2027)
Table 54. United States eVTOL Aircraft Sales Share by Type (2022-2027)
Table 55. United States eVTOL Aircraft Revenue (US$ Million) Market Share by Type (2022-2027)
Table 56. United States eVTOL Aircraft Revenue Share by Type (2022-2027)
Table 57. United States eVTOL Aircraft Price (K USD/Unit) by Type (2022-2027)
Table 58. United States eVTOL Aircraft Sales (Units) by Application (2016-2021)
Table 59. United States eVTOL Aircraft Sales Share by Application (2016-2021)
Table 60. United States eVTOL Aircraft Revenue (US$ Million) Market Share by Application (2016-2021)
Table 61. United States eVTOL Aircraft Price (K USD/Unit) by Application (2016-2021)
Table 62. United States eVTOL Aircraft Sales (Units) by Application (2022-2027)
Table 63. United States eVTOL Aircraft Sales Share by Application (2022-2027)
Table 64. United States eVTOL Aircraft Revenue (US$ Million) Market Share by Application (2022-2027)
Table 65. United States eVTOL Aircraft Revenue Share by Application (2022-2027)
Table 66. United States eVTOL Aircraft Price (K USD/Unit) by Application (2022-2027)
Table 67. North America eVTOL Aircraft Sales by Country (2016-2021) & (Units)
Table 68. North America eVTOL Aircraft Sales Market Share by Country (2016-2021)
Table 69. North America eVTOL Aircraft Revenue by Country (2016-2021) & (US$ Million)
Table 70. North America eVTOL Aircraft Revenue Market Share by Country (2016-2021)
Table 71. Asia Pacific eVTOL Aircraft Sales by Region (2016-2021) & (Units)
Table 72. Asia Pacific eVTOL Aircraft Sales Market Share by Region (2016-2021)
Table 73. Asia Pacific eVTOL Aircraft Revenue by Region (2016-2021) & (US$ Million)
Table 74. Asia Pacific eVTOL Aircraft Revenue Market Share by Region (2016-2021)
Table 75. Europe eVTOL Aircraft Sales by Country (2016-2021) & (Units)
Table 76. Europe eVTOL Aircraft Sales Market Share by Country (2016-2021)
Table 77. Europe eVTOL Aircraft Revenue by Country (2016-2021) & (US$ Million)
Table 78. Europe eVTOL Aircraft Revenue Market Share by Country (2016-2021)
Table 79. Latin America eVTOL Aircraft Sales by Country (2016-2021) & (Units)
Table 80. Latin America eVTOL Aircraft Sales Market Share by Country (2016-2021)
Table 81. Latin Americaa eVTOL Aircraft Revenue by Country (2016-2021) & (US$ Million)
Table 82. Latin America eVTOL Aircraft Revenue Market Share by Country (2016-2021)
Table 83. Middle East and Africa eVTOL Aircraft Sales by Country (2016-2021) & (Units)
Table 84. Middle East and Africa eVTOL Aircraft Sales Market Share by Country (2016-2021)
Table 85. Middle East and Africa eVTOL Aircraft Revenue by Country (2016-2021) & (US$ Million)
Table 86. Middle East and Africa eVTOL Aircraft Revenue Market Share by Country (2016-2021)
Table 87. Airbus Corporation Information
Table 88. Airbus Description and Business Overview
Table 89. Airbus eVTOL Aircraft Sales (Units), Revenue (US$ Million), Price (K USD/Unit) and Gross Margin (2016-2021)
Table 90. Airbus eVTOL Aircraft Product
Table 91. Airbus Recent Development
Table 92. Lilium Corporation Information
Table 93. Lilium Description and Business Overview
Table 94. Lilium eVTOL Aircraft Sales (Units), Revenue (US$ Million), Price (K USD/Unit) and Gross Margin (2016-2021)
Table 95. Lilium Product
Table 96. Lilium Recent Development
Table 97. Bell Helicopter Corporation Information
Table 98. Bell Helicopter Description and Business Overview
Table 99. Bell Helicopter eVTOL Aircraft Sales (Units), Revenue (US$ Million), Price (K USD/Unit) and Gross Margin (2016-2021)
Table 100. Bell Helicopter Product
Table 101. Bell Helicopter Recent Development
Table 102. Aurora Flight Sciences Corporation Information
Table 103. Aurora Flight Sciences Description and Business Overview
Table 104. Aurora Flight Sciences eVTOL Aircraft Sales (Units), Revenue (US$ Million), Price (K USD/Unit) and Gross Margin (2016-2021)
Table 105. Aurora Flight Sciences Product
Table 106. Aurora Flight Sciences Recent Development
Table 107. Embraer Corporation Information
Table 108. Embraer Description and Business Overview
Table 109. Embraer eVTOL Aircraft Sales (Units), Revenue (US$ Million), Price (K USD/Unit) and Gross Margin (2016-2021)
Table 110. Embraer Product
Table 111. Embraer Recent Development
Table 112. Ehang Corporation Information
Table 113. Ehang Description and Business Overview
Table 114. Ehang eVTOL Aircraft Sales (Units), Revenue (US$ Million), Price (K USD/Unit) and Gross Margin (2016-2021)
Table 115. Ehang Product
Table 116. Ehang Recent Development
Table 117. Volocopter Corporation Information
Table 118. Volocopter Description and Business Overview
Table 119. Volocopter eVTOL Aircraft Sales (Units), Revenue (US$ Million), Price (K USD/Unit) and Gross Margin (2016-2021)
Table 120. Volocopter Product
Table 121. Volocopter Recent Development
Table 122. Workhorse Group Corporation Information
Table 123. Workhorse Group Description and Business Overview
Table 124. Workhorse Group eVTOL Aircraft Sales (Units), Revenue (US$ Million), Price (K USD/Unit) and Gross Margin (2016-2021)
Table 125. Workhorse Group Product
Table 126. Workhorse Group Recent Development
Table 127. Pipistrel Corporation Information
Table 128. Pipistrel Description and Business Overview
Table 129. Pipistrel eVTOL Aircraft Sales (Units), Revenue (US$ Million), Price (K USD/Unit) and Gross Margin (2016-2021)
Table 130. Pipistrel Product
Table 131. Pipistrel Recent Development
Table 132. Kitty Hawk Corporation Corporation Information
Table 133. Kitty Hawk Corporation Description and Business Overview
Table 134. Kitty Hawk Corporation eVTOL Aircraft Sales (Units), Revenue (US$ Million), Price (K USD/Unit) and Gross Margin (2016-2021)
Table 135. Kitty Hawk Corporation Product
Table 136. Kitty Hawk Corporation Recent Development
Table 137. Karem Aircraft Corporation Information
Table 138. Karem Aircraft Description and Business Overview
Table 139. Karem Aircraft eVTOL Aircraft Sales (Units), Revenue (US$ Million), Price (K USD/Unit) and Gross Margin (2016-2021)
Table 140. Karem Aircraft Product
Table 141. Karem Aircraft Recent Development
Table 142. Lift Aircraft Corporation Information
Table 143. Lift Aircraft Description and Business Overview
Table 144. Lift Aircraft eVTOL Aircraft Sales (Units), Revenue (US$ Million), Price (K USD/Unit) and Gross Margin (2016-2021)
Table 145. Lift Aircraft Product
Table 146. Lift Aircraft Recent Development
Table 147. eVTOL Aircraft Market Trends
Table 148. eVTOL Aircraft Market Drivers
Table 149. eVTOL Aircraft Market Challenges
Table 150. eVTOL Aircraft Market Restraints
Table 151. eVTOL Aircraft Customers List
Table 152. eVTOL Aircraft Distributors List
Table 153. Research Programs/Design for This Report
Table 154. Key Data Information from Secondary Sources
Table 155. Key Data Information from Primary Sources
List of Figures
Figure 1. eVTOL Aircraft Product Picture
Figure 2. Global eVTOL Aircraft Sales Market Share by Type in 2020 & 2027
Figure 3. Fully Electric eVTOL Aircraft Product Picture
Figure 4. Hybrid eVTOL Aircraft Product Picture
Figure 5. Global eVTOL Aircraft Sales Market Share by Application in 2020 & 2027
Figure 6. Civil
Figure 7. Military
Figure 8. eVTOL Aircraft Report Years Considered
Figure 9. Global eVTOL Aircraft Market Size, (US$ Million), 2016 VS 2021 VS 2027
Figure 10. Global eVTOL Aircraft Market Size 2016-2027 (US$ Million)
Figure 11. Global eVTOL Aircraft Sales 2016-2027 (Units)
Figure 12. Global eVTOL Aircraft Market Size Market Share by Region: 2021 Versus 2027
Figure 13. Global eVTOL Aircraft Sales Market Share by Region (2016-2021)
Figure 14. Global eVTOL Aircraft Sales Market Share by Region in 2020
Figure 15. Global eVTOL Aircraft Revenue Market Share by Region (2016-2021)
Figure 16. Global eVTOL Aircraft Revenue Market Share by Region in 2020
Figure 17. Global eVTOL Aircraft Sales Share by Manufacturer in 2020
Figure 18. The Top 10 and 5 Players Market Share by eVTOL Aircraft Revenue in 2020
Figure 19. eVTOL Aircraft Market Share by Company Type (Tier 1, Tier 2 and Tier 3): 2016 VS 2020
Figure 20. Global eVTOL Aircraft Sales Market Share by Type (2016-2021)
Figure 21. Global eVTOL Aircraft Sales Market Share by Type in 2020
Figure 22. Global eVTOL Aircraft Revenue Market Share by Type (2016-2021)
Figure 23. Global eVTOL Aircraft Revenue Market Share by Type in 2020
Figure 24. Global eVTOL Aircraft Sales Market Share by Application (2016-2021)
Figure 25. Global eVTOL Aircraft Sales Market Share by Application in 2020
Figure 26. Global eVTOL Aircraft Revenue Market Share by Application (2016-2021)
Figure 27. Global eVTOL Aircraft Revenue Market Share by Application in 2020
Figure 28. United States eVTOL Aircraft Sales Growth Rate 2016-2027 (Units)
Figure 29. United States eVTOL Aircraft Revenue Growth Rate 2016-2027 (US$ Million)
Figure 30. United States eVTOL Aircraft Market Share in Global Market 2016-2027
Figure 31. United States 5 and 10 Largest eVTOL Aircraft Players Market Share by Revenue in eVTOL Aircraft in 2020
Figure 32. United States eVTOL Aircraft Revenue Share by Type (2016-2021)
Figure 33. United States eVTOL Aircraft Revenue Growth Rate by Type in 2016 & 2020
Figure 34. United States eVTOL Aircraft Revenue Share by Application (2016-2021)
Figure 35. United States eVTOL Aircraft Revenue Growth Rate by Application in 2016 & 2020
Figure 36. North America eVTOL Aircraft Sales Growth Rate 2016-2021 (Units)
Figure 37. North America eVTOL Aircraft Revenue Growth Rate 2016-2021 (US$ Million)
Figure 38. North America eVTOL Aircraft Sales Market Share by Country in 2020
Figure 39. North America eVTOL Aircraft Revenue Market Share by Country in 2020
Figure 40. U.S. eVTOL Aircraft Sales Growth Rate (2016-2021) (Units)
Figure 41. U.S. eVTOL Aircraft Revenue Growth Rate (2016-2021) (US$ Million)
Figure 42. Canada eVTOL Aircraft Sales Growth Rate (2016-2021) (Units)
Figure 43. Canada eVTOL Aircraft Revenue Growth Rate (2016-2021) (US$ Million)
Figure 44. Europe eVTOL Aircraft Sales Growth Rate 2016-2021 (Units)
Figure 45. Europe eVTOL Aircraft Revenue Growth Rate 2016-2021 (US$ Million)
Figure 46. Europe eVTOL Aircraft Sales Market Share by Country in 2020
Figure 47. Europe eVTOL Aircraft Revenue Market Share by Country in 2020
Figure 48. Germany eVTOL Aircraft Sales Growth Rate (2016-2021) (Units)
Figure 49. Germany eVTOL Aircraft Revenue Growth Rate (2016-2021) (US$ Million)
Figure 50. France eVTOL Aircraft Sales Growth Rate (2016-2021) (Units)
Figure 51. France eVTOL Aircraft Revenue Growth Rate (2016-2021) (US$ Million)
Figure 52. U.K. eVTOL Aircraft Sales Growth Rate (2016-2021) (Units)
Figure 53. U.K. eVTOL Aircraft Revenue Growth Rate (2016-2021) (US$ Million)
Figure 54. Italy eVTOL Aircraft Sales Growth Rate (2016-2021) (Units)
Figure 55. Italy eVTOL Aircraft Revenue Growth Rate (2016-2021) (US$ Million)
Figure 56. Russia eVTOL Aircraft Sales Growth Rate (2016-2021) (Units)
Figure 57. Russia eVTOL Aircraft Revenue Growth Rate (2016-2021) (US$ Million)
Figure 58. Asia Pacific eVTOL Aircraft Sales Growth Rate 2016-2021 (Units)
Figure 59. Asia Pacific eVTOL Aircraft Revenue Growth Rate 2016-2021 (US$ Million)
Figure 60. Asia Pacific eVTOL Aircraft Sales Market Share by Region in 2020
Figure 61. Asia Pacific eVTOL Aircraft Revenue Market Share by Region in 2020
Figure 62. China eVTOL Aircraft Sales Growth Rate (2016-2021) (Units)
Figure 63. China eVTOL Aircraft Revenue Growth Rate (2016-2021) (US$ Million)
Figure 64. Japan eVTOL Aircraft Sales Growth Rate (2016-2021) (Units)
Figure 65. Japan eVTOL Aircraft Revenue Growth Rate (2016-2021) (US$ Million)
Figure 66. South Korea eVTOL Aircraft Sales Growth Rate (2016-2021) (Units)
Figure 67. South Korea eVTOL Aircraft Revenue Growth Rate (2016-2021) (US$ Million)
Figure 68. India eVTOL Aircraft Sales Growth Rate (2016-2021) (Units)
Figure 69. India eVTOL Aircraft Revenue Growth Rate (2016-2021) (US$ Million)
Figure 70. Australia eVTOL Aircraft Sales Growth Rate (2016-2021) (Units)
Figure 71. Australia eVTOL Aircraft Revenue Growth Rate (2016-2021) (US$ Million)
Figure 72. Taiwan eVTOL Aircraft Sales Growth Rate (2016-2021) (Units)
Figure 73. Taiwan eVTOL Aircraft Revenue Growth Rate (2016-2021) (US$ Million)
Figure 74. Indonesia eVTOL Aircraft Sales Growth Rate (2016-2021) (Units)
Figure 75. Indonesia eVTOL Aircraft Revenue Growth Rate (2016-2021) (US$ Million)
Figure 76. Thailand eVTOL Aircraft Sales Growth Rate (2016-2021) (Units)
Figure 77. Thailand eVTOL Aircraft Revenue Growth Rate (2016-2021) (US$ Million)
Figure 78. Malaysia eVTOL Aircraft Sales Growth Rate (2016-2021) (Units)
Figure 79. Malaysia eVTOL Aircraft Revenue Growth Rate (2016-2021) (US$ Million)
Figure 80. Philippines eVTOL Aircraft Sales Growth Rate (2016-2021) (Units)
Figure 81. Philippines eVTOL Aircraft Revenue Growth Rate (2016-2021) (US$ Million)
Figure 82. Vietnam eVTOL Aircraft Sales Growth Rate (2016-2021) (Units)
Figure 83. Vietnam eVTOL Aircraft Revenue Growth Rate (2016-2021) (US$ Million)
Figure 84. Latin America eVTOL Aircraft Sales Growth Rate 2016-2021 (Units)
Figure 85. Latin America eVTOL Aircraft Revenue Growth Rate 2016-2021 (US$ Million)
Figure 86. Latin America eVTOL Aircraft Sales Market Share by Country in 2020
Figure 87. Latin America eVTOL Aircraft Revenue Market Share by Country in 2020
Figure 88. Mexico eVTOL Aircraft Sales Growth Rate (2016-2021) (Units)
Figure 89. Mexico eVTOL Aircraft Revenue Growth Rate (2016-2021) (US$ Million)
Figure 90. Brazil eVTOL Aircraft Sales Growth Rate (2016-2021) (Units)
Figure 91. Brazil eVTOL Aircraft Revenue Growth Rate (2016-2021) (US$ Million)
Figure 92. Argentina eVTOL Aircraft Sales Growth Rate (2016-2021) (Units)
Figure 93. Argentina eVTOL Aircraft Revenue Growth Rate (2016-2021) (US$ Million)
Figure 94. Middle East and Africa eVTOL Aircraft Sales Growth Rate 2016-2021 (Units)
Figure 95. Middle East and Africa eVTOL Aircraft Revenue Growth Rate 2016-2021 (US$ Million)
Figure 96. Middle East and Africa eVTOL Aircraft Sales Market Share by Country in 2020
Figure 97. Middle East and Africa eVTOL Aircraft Revenue Market Share by Country in 2020
Figure 98. Turkey eVTOL Aircraft Sales Growth Rate (2016-2021) (Units)
Figure 99. Turkey eVTOL Aircraft Revenue Growth Rate (2016-2021) (US$ Million)
Figure 100. Saudi Arabia eVTOL Aircraft Sales Growth Rate (2016-2021) (Units)
Figure 101. Saudi Arabia eVTOL Aircraft Revenue Growth Rate (2016-2021) (US$ Million)
Figure 102. U.A.E eVTOL Aircraft Sales Growth Rate (2016-2021) (Units)
Figure 103. U.A.E eVTOL Aircraft Revenue Growth Rate (2016-2021) (US$ Million)
Figure 104. eVTOL Aircraft Value Chain
Figure 105. Channels of Distribution
Figure 106. Distributors Profiles
Figure 107. Bottom-up and Top-down Approaches for This Report
Figure 108. Data Triangulation
Figure 109. Key Executives Interviewed
$3900
$7800
