0
U.S. (TOLL FREE)
+1 (315) 215-3225
Automative

0
U.S. (TOLL FREE)
+1 (315) 215-3225
Global NVMe-oF SAN Systems (NVMe over Fabrics Storage Area Network Systems) Market Research Report 2026
Published Date: 2026-01-05
|
Report Code: QYRE-Auto-31R20128
Home | Market Reports | Computers & Electronics| Computer Hardware
Global NVMe oF SAN Systems NVMe over Fabrics Storage Area Network Systems Market Research Report 2026
BUY CHAPTERS

Global NVMe-oF SAN Systems (NVMe over Fabrics Storage Area Network Systems) Market Research Report 2026

Code: QYRE-Auto-31R20128
Report
2026-01-05
Pages:139
QYResearch
Buy Now with 15% Discount
DESCRIPTION
TABLE OF CONTENT
TABLES & FIGURES

NVMe-oF SAN Systems (NVMe over Fabrics Storage Area Network Systems) Market Size

The global NVMe-oF SAN Systems (NVMe over Fabrics Storage Area Network Systems) market was valued at US$ 9500 million in 2025 and is anticipated to reach US$ 54415 million by 2032, at a CAGR of 28.3% from 2026 to 2032.

NVMe-oF SAN Systems (NVMe over Fabrics Storage Area Network Systems) Market

NVMe-oF SAN Systems (NVMe over Fabrics Storage Area Network Systems) Market

NVMe-oF (Non-Volatile Memory Express over Fabrics) SAN Systems are high-performance storage area networks that extend the NVMe protocol across network fabrics (such as Ethernet, InfiniBand, or Fibre Channel) to provide low-latency, high-throughput access to remote NVMe SSDs, approaching local-disk performance. In 2025, global NVMe-oF SAN systems price is around US$ 50,000 per unit. Gross Profit Margin is about 45%. The NVMe-oF SAN systems industry chain starts with upstream suppliers of NVMe SSDs, controllers, network interface cards, switches, and CPUs. Midstream players design and manufacture NVMe-oF–enabled storage arrays and software-defined SAN platforms, integrating NVMe protocols with Fibre Channel or Ethernet fabrics. Downstream customers are mainly enterprises and cloud operators deploying these systems in data centers for high-performance, low-latency workloads such as databases, virtualization, and AI infrastructure.NVMe-oF SAN systems represent a structural upgrade rather than an incremental improvement over traditional SAN. As application latency sensitivity increases and NVMe becomes the default storage media, NVMe-oF will gradually replace SCSI-based architectures, especially in core data center environments. Vendors that combine mature SAN features with simple Ethernet-based NVMe-TCP deployments are likely to gain the widest adoption.
The North American market for NVMe-oF SAN Systems (NVMe over Fabrics Storage Area Network Systems) is projected to increase from US$ million in 2025 to US$ million by 2032, at a CAGR of % over 2026–2032.
The Asia-Pacific market for NVMe-oF SAN Systems (NVMe over Fabrics Storage Area Network Systems) is projected to rise from US$ million in 2025 to US$ million by 2032, at a CAGR of % over 2026–2032.
The global market for NVMe-oF SAN Systems (NVMe over Fabrics Storage Area Network Systems) in Enterprise Databases is estimated to increase from US$ million in 2025 to US$ million by 2032, at a CAGR of % from 2026 to 2032.
Major global companies of NVMe-oF SAN Systems (NVMe over Fabrics Storage Area Network Systems) include Dell Technologies, Hewlett Packard Enterprise, Netapp, Ibm, Huawei, Hitachi Vantara, Pure Storage, Inspur, Lenovo, Fujitsu, etc. In 2025, the world's top three vendors accounted for approximately % of revenue.
This report delivers a comprehensive overview of the global NVMe-oF SAN Systems (NVMe over Fabrics Storage Area Network Systems) market, with both quantitative and qualitative analyses, to help readers develop growth strategies, assess the competitive landscape, evaluate their position in the current market, and make informed business decisions regarding NVMe-oF SAN Systems (NVMe over Fabrics Storage Area Network Systems). The NVMe-oF SAN Systems (NVMe over Fabrics Storage Area Network Systems) market size, estimates, and forecasts are provided in terms of revenue (US$ millions), with 2025 as the base year and historical and forecast data for 2021–2032.
The report segments the global NVMe-oF SAN Systems (NVMe over Fabrics Storage Area Network Systems) market comprehensively. Regional market sizes by Type, by Application, by Fabric and Connectivity, and by player are also provided. For deeper insight, the report profiles the competitive landscape, key competitors, and their respective market rankings, and discusses technological trends and new product developments.
This report will assist NVMe-oF SAN Systems (NVMe over Fabrics Storage Area Network Systems) manufacturers, new entrants, and companies across the industry value chain with information on revenues, sales volume, and average prices for the overall market and its sub-segments, by company, by Type, by Application, and by region.
Market Segmentation

Scope of NVMe-oF SAN Systems (NVMe over Fabrics Storage Area Network Systems) Market Report

Report Metric Details
Report Name NVMe-oF SAN Systems (NVMe over Fabrics Storage Area Network Systems) Market
Accounted market size in 2025 US$ 9500 million
Forecasted market size in 2032 US$ 54415 million
CAGR 28.3%
Base Year 2025
Forecasted years 2026 - 2032
Segment by Type
  • All Flash
  • Software Defined
  • Disaggregated
  • Hyper Converged
  • Scale Out
Segment by Fabric and Connectivity
  • Fc NVMe San Systems
  • NVMe Tcp San Systems
  • NVMe Rdma Roce San Systems
  • NVMe Rdma Iwarp San Systems
  • Multi Protocol NVMe Of San Systems
Segment by Application
  • Enterprise Databases
  • Server Virtualization
  • Private Cloud Infrastructure
  • Mission Critical Applications
  • High Availability Clusters
  • AI and Machine Learning Workloads
By Region
  • North America (United States, Canada)
  • Europe (Germany, France, UK, Italy, Russia) Rest of Europe
  • Nordic Countries
  • Asia-Pacific (China, Japan, South Korea)
  • Southeast Asia (India, Australia)
  • Rest of Asia
  • Latin America (Mexico, Brazil)
  • Rest of Latin America
  • Middle East & Africa (Turkey, Saudi Arabia, UAE, Rest of MEA)
By Company Dell Technologies, Hewlett Packard Enterprise, Netapp, Ibm, Huawei, Hitachi Vantara, Pure Storage, Inspur, Lenovo, Fujitsu, Oracle, Broadcom, Marvell, Micron Technology, Samsung Electronics, Western Digital, Kioxia, Vast Data, Weka, Lightbits Labs
Forecast units USD million in value
Report coverage Revenue and volume forecast, company share, competitive landscape, growth factors and trends

Chapter Outline

  • Chapter 1: Defines the scope of the report and presents an executive summary of market segments (by Type, by Application, by Fabric and Connectivity, etc.), including the size of each segment and its future growth potential. It offers a high-level view of the current market and its likely evolution in the short, medium, and long term.
  • Chapter 2: Summarizes global and regional market size and outlines market dynamics and recent developments, including key drivers, restraints, challenges and risks for industry participants, and relevant policy analysis.
  • Chapter 3: Provides a detailed view of the competitive landscape for NVMe-oF SAN Systems (NVMe over Fabrics Storage Area Network Systems) companies, covering revenue share, development plans, and mergers and acquisitions.
  • Chapter 4: Analyzes segments by Type, detailing the size and growth potential of each segment to help readers identify blue-ocean opportunities.
  • Chapter 5: Analyzes segments by Application, detailing the size and growth potential of each downstream segment to help readers identify blue-ocean opportunities.
  • Chapter 6–10: Regional deep dives (North America, Europe, Asia Pacific, Latin America, Middle East & Africa) broken down by country. Each chapter quantifies market size and growth potential by region and key countries, and outlines market development, outlook, addressable space, and capacity.
  • Chapter 11: Profiles key players, presenting essential information on leading companies, including product/ service offerings, revenue, gross margin, product introductions/portfolios, recent developments, etc.
  • Chapter 12: Key findings and conclusions of the report.

FAQ for this report

How fast is NVMe-oF SAN Systems (NVMe over Fabrics Storage Area Network Systems) Market growing?

Ans: The NVMe-oF SAN Systems (NVMe over Fabrics Storage Area Network Systems) Market witnessing a CAGR of 28.3% during the forecast period 2026-2032.

What is the NVMe-oF SAN Systems (NVMe over Fabrics Storage Area Network Systems) Market size in 2032?

Ans: The NVMe-oF SAN Systems (NVMe over Fabrics Storage Area Network Systems) Market size in 2032 will be US$ 54415 million.

Who are the main players in the NVMe-oF SAN Systems (NVMe over Fabrics Storage Area Network Systems) Market report?

Ans: The main players in the NVMe-oF SAN Systems (NVMe over Fabrics Storage Area Network Systems) Market are Dell Technologies, Hewlett Packard Enterprise, Netapp, Ibm, Huawei, Hitachi Vantara, Pure Storage, Inspur, Lenovo, Fujitsu, Oracle, Broadcom, Marvell, Micron Technology, Samsung Electronics, Western Digital, Kioxia, Vast Data, Weka, Lightbits Labs

What are the Application segmentation covered in the NVMe-oF SAN Systems (NVMe over Fabrics Storage Area Network Systems) Market report?

Ans: The Applications covered in the NVMe-oF SAN Systems (NVMe over Fabrics Storage Area Network Systems) Market report are Enterprise Databases, Server Virtualization, Private Cloud Infrastructure, Mission Critical Applications, High Availability Clusters, AI and Machine Learning Workloads

What are the Type segmentation covered in the NVMe-oF SAN Systems (NVMe over Fabrics Storage Area Network Systems) Market report?

Ans: The Types covered in the NVMe-oF SAN Systems (NVMe over Fabrics Storage Area Network Systems) Market report are All Flash, Software Defined, Disaggregated, Hyper Converged, Scale Out

1 Report Overview
1.1 Study Scope
1.2 Market Analysis by Type
1.2.1 Global NVMe-oF SAN Systems (NVMe over Fabrics Storage Area Network Systems) Market Size Growth Rate by Type: 2021 vs 2025 vs 2032
1.2.2 All Flash
1.2.3 Software Defined
1.2.4 Disaggregated
1.2.5 Hyper Converged
1.2.6 Scale Out
1.3 Market by Fabric and Connectivity
1.3.1 Global NVMe-oF SAN Systems (NVMe over Fabrics Storage Area Network Systems) Market Size Growth Rate by Fabric and Connectivity: 2021 vs 2025 vs 2032
1.3.2 Fc NVMe San Systems
1.3.3 NVMe Tcp San Systems
1.3.4 NVMe Rdma Roce San Systems
1.3.5 NVMe Rdma Iwarp San Systems
1.3.6 Multi Protocol NVMe Of San Systems
1.4 Market by Application
1.4.1 Global NVMe-oF SAN Systems (NVMe over Fabrics Storage Area Network Systems) Market Growth by Application: 2021 vs 2025 vs 2032
1.4.2 Enterprise Databases
1.4.3 Server Virtualization
1.4.4 Private Cloud Infrastructure
1.4.5 Mission Critical Applications
1.4.6 High Availability Clusters
1.4.7 AI and Machine Learning Workloads
1.5 Assumptions and Limitations
1.6 Study Objectives
1.7 Years Considered
2 Global Growth Trends
2.1 Global NVMe-oF SAN Systems (NVMe over Fabrics Storage Area Network Systems) Market Perspective (2021–2032)
2.2 Global NVMe-oF SAN Systems (NVMe over Fabrics Storage Area Network Systems) Growth Trends by Region
2.2.1 Global NVMe-oF SAN Systems (NVMe over Fabrics Storage Area Network Systems) Market Size by Region: 2021 vs 2025 vs 2032
2.2.2 NVMe-oF SAN Systems (NVMe over Fabrics Storage Area Network Systems) Historic Market Size by Region (2021–2026)
2.2.3 NVMe-oF SAN Systems (NVMe over Fabrics Storage Area Network Systems) Forecasted Market Size by Region (2027–2032)
2.3 NVMe-oF SAN Systems (NVMe over Fabrics Storage Area Network Systems) Market Dynamics
2.3.1 NVMe-oF SAN Systems (NVMe over Fabrics Storage Area Network Systems) Industry Trends
2.3.2 NVMe-oF SAN Systems (NVMe over Fabrics Storage Area Network Systems) Market Drivers
2.3.3 NVMe-oF SAN Systems (NVMe over Fabrics Storage Area Network Systems) Market Challenges
2.3.4 NVMe-oF SAN Systems (NVMe over Fabrics Storage Area Network Systems) Market Restraints
3 Competition Landscape by Key Players
3.1 Global Top NVMe-oF SAN Systems (NVMe over Fabrics Storage Area Network Systems) Players by Revenue
3.1.1 Global Top NVMe-oF SAN Systems (NVMe over Fabrics Storage Area Network Systems) Players by Revenue (2021–2026)
3.1.2 Global NVMe-oF SAN Systems (NVMe over Fabrics Storage Area Network Systems) Revenue Market Share by Players (2021–2026)
3.2 Global Top NVMe-oF SAN Systems (NVMe over Fabrics Storage Area Network Systems) Players Market Share by Company Tier (Tier 1, Tier 2, Tier 3)
3.3 Global Key Players Ranking by NVMe-oF SAN Systems (NVMe over Fabrics Storage Area Network Systems) Revenue
3.4 Global NVMe-oF SAN Systems (NVMe over Fabrics Storage Area Network Systems) Market Concentration Ratio
3.4.1 Global NVMe-oF SAN Systems (NVMe over Fabrics Storage Area Network Systems) Market Concentration Ratio (CR5 and HHI)
3.4.2 Global Top 10 and Top 5 Companies by NVMe-oF SAN Systems (NVMe over Fabrics Storage Area Network Systems) Revenue in 2025
3.5 Global Key Players of NVMe-oF SAN Systems (NVMe over Fabrics Storage Area Network Systems) Head Offices and Areas Served
3.6 Global Key Players of NVMe-oF SAN Systems (NVMe over Fabrics Storage Area Network Systems), Products and Applications
3.7 Global Key Players of NVMe-oF SAN Systems (NVMe over Fabrics Storage Area Network Systems), Date of General Availability (GA)
3.8 Mergers and Acquisitions, Expansion Plans
4 NVMe-oF SAN Systems (NVMe over Fabrics Storage Area Network Systems) Breakdown Data by Type
4.1 Global NVMe-oF SAN Systems (NVMe over Fabrics Storage Area Network Systems) Historic Market Size by Type (2021–2026)
4.2 Global NVMe-oF SAN Systems (NVMe over Fabrics Storage Area Network Systems) Forecasted Market Size by Type (2027–2032)
5 NVMe-oF SAN Systems (NVMe over Fabrics Storage Area Network Systems) Breakdown Data by Application
5.1 Global NVMe-oF SAN Systems (NVMe over Fabrics Storage Area Network Systems) Historic Market Size by Application (2021–2026)
5.2 Global NVMe-oF SAN Systems (NVMe over Fabrics Storage Area Network Systems) Forecasted Market Size by Application (2027–2032)
6 North America
6.1 North America NVMe-oF SAN Systems (NVMe over Fabrics Storage Area Network Systems) Market Size (2021–2032)
6.2 North America NVMe-oF SAN Systems (NVMe over Fabrics Storage Area Network Systems) Market Growth Rate by Country: 2021 vs 2025 vs 2032
6.3 North America NVMe-oF SAN Systems (NVMe over Fabrics Storage Area Network Systems) Market Size by Country (2021–2026)
6.4 North America NVMe-oF SAN Systems (NVMe over Fabrics Storage Area Network Systems) Market Size by Country (2027–2032)
6.5 United States
6.6 Canada
7 Europe
7.1 Europe NVMe-oF SAN Systems (NVMe over Fabrics Storage Area Network Systems) Market Size (2021–2032)
7.2 Europe NVMe-oF SAN Systems (NVMe over Fabrics Storage Area Network Systems) Market Growth Rate by Country: 2021 vs 2025 vs 2032
7.3 Europe NVMe-oF SAN Systems (NVMe over Fabrics Storage Area Network Systems) Market Size by Country (2021–2026)
7.4 Europe NVMe-oF SAN Systems (NVMe over Fabrics Storage Area Network Systems) Market Size by Country (2027–2032)
7.5 Germany
7.6 France
7.7 U.K.
7.8 Italy
7.9 Russia
7.10 Ireland
8 Asia-Pacific
8.1 Asia-Pacific NVMe-oF SAN Systems (NVMe over Fabrics Storage Area Network Systems) Market Size (2021–2032)
8.2 Asia-Pacific NVMe-oF SAN Systems (NVMe over Fabrics Storage Area Network Systems) Market Growth Rate by Region: 2021 vs 2025 vs 2032
8.3 Asia-Pacific NVMe-oF SAN Systems (NVMe over Fabrics Storage Area Network Systems) Market Size by Region (2021–2026)
8.4 Asia-Pacific NVMe-oF SAN Systems (NVMe over Fabrics Storage Area Network Systems) Market Size by Region (2027–2032)
8.5 China
8.6 Japan
8.7 South Korea
8.8 Southeast Asia
8.9 India
8.10 Australia & New Zealand
9 Latin America
9.1 Latin America NVMe-oF SAN Systems (NVMe over Fabrics Storage Area Network Systems) Market Size (2021–2032)
9.2 Latin America NVMe-oF SAN Systems (NVMe over Fabrics Storage Area Network Systems) Market Growth Rate by Country: 2021 vs 2025 vs 2032
9.3 Latin America NVMe-oF SAN Systems (NVMe over Fabrics Storage Area Network Systems) Market Size by Country (2021–2026)
9.4 Latin America NVMe-oF SAN Systems (NVMe over Fabrics Storage Area Network Systems) Market Size by Country (2027–2032)
9.5 Mexico
9.6 Brazil
10 Middle East & Africa
10.1 Middle East & Africa NVMe-oF SAN Systems (NVMe over Fabrics Storage Area Network Systems) Market Size (2021–2032)
10.2 Middle East & Africa NVMe-oF SAN Systems (NVMe over Fabrics Storage Area Network Systems) Market Growth Rate by Country: 2021 vs 2025 vs 2032
10.3 Middle East & Africa NVMe-oF SAN Systems (NVMe over Fabrics Storage Area Network Systems) Market Size by Country (2021–2026)
10.4 Middle East & Africa NVMe-oF SAN Systems (NVMe over Fabrics Storage Area Network Systems) Market Size by Country (2027–2032)
10.5 Israel
10.6 Saudi Arabia
10.7 UAE
11 Key Players Profiles
11.1 Dell Technologies
11.1.1 Dell Technologies Company Details
11.1.2 Dell Technologies Business Overview
11.1.3 Dell Technologies NVMe-oF SAN Systems (NVMe over Fabrics Storage Area Network Systems) Introduction
11.1.4 Dell Technologies Revenue in NVMe-oF SAN Systems (NVMe over Fabrics Storage Area Network Systems) Business (2021–2026)
11.1.5 Dell Technologies Recent Development
11.2 Hewlett Packard Enterprise
11.2.1 Hewlett Packard Enterprise Company Details
11.2.2 Hewlett Packard Enterprise Business Overview
11.2.3 Hewlett Packard Enterprise NVMe-oF SAN Systems (NVMe over Fabrics Storage Area Network Systems) Introduction
11.2.4 Hewlett Packard Enterprise Revenue in NVMe-oF SAN Systems (NVMe over Fabrics Storage Area Network Systems) Business (2021–2026)
11.2.5 Hewlett Packard Enterprise Recent Development
11.3 Netapp
11.3.1 Netapp Company Details
11.3.2 Netapp Business Overview
11.3.3 Netapp NVMe-oF SAN Systems (NVMe over Fabrics Storage Area Network Systems) Introduction
11.3.4 Netapp Revenue in NVMe-oF SAN Systems (NVMe over Fabrics Storage Area Network Systems) Business (2021–2026)
11.3.5 Netapp Recent Development
11.4 Ibm
11.4.1 Ibm Company Details
11.4.2 Ibm Business Overview
11.4.3 Ibm NVMe-oF SAN Systems (NVMe over Fabrics Storage Area Network Systems) Introduction
11.4.4 Ibm Revenue in NVMe-oF SAN Systems (NVMe over Fabrics Storage Area Network Systems) Business (2021–2026)
11.4.5 Ibm Recent Development
11.5 Huawei
11.5.1 Huawei Company Details
11.5.2 Huawei Business Overview
11.5.3 Huawei NVMe-oF SAN Systems (NVMe over Fabrics Storage Area Network Systems) Introduction
11.5.4 Huawei Revenue in NVMe-oF SAN Systems (NVMe over Fabrics Storage Area Network Systems) Business (2021–2026)
11.5.5 Huawei Recent Development
11.6 Hitachi Vantara
11.6.1 Hitachi Vantara Company Details
11.6.2 Hitachi Vantara Business Overview
11.6.3 Hitachi Vantara NVMe-oF SAN Systems (NVMe over Fabrics Storage Area Network Systems) Introduction
11.6.4 Hitachi Vantara Revenue in NVMe-oF SAN Systems (NVMe over Fabrics Storage Area Network Systems) Business (2021–2026)
11.6.5 Hitachi Vantara Recent Development
11.7 Pure Storage
11.7.1 Pure Storage Company Details
11.7.2 Pure Storage Business Overview
11.7.3 Pure Storage NVMe-oF SAN Systems (NVMe over Fabrics Storage Area Network Systems) Introduction
11.7.4 Pure Storage Revenue in NVMe-oF SAN Systems (NVMe over Fabrics Storage Area Network Systems) Business (2021–2026)
11.7.5 Pure Storage Recent Development
11.8 Inspur
11.8.1 Inspur Company Details
11.8.2 Inspur Business Overview
11.8.3 Inspur NVMe-oF SAN Systems (NVMe over Fabrics Storage Area Network Systems) Introduction
11.8.4 Inspur Revenue in NVMe-oF SAN Systems (NVMe over Fabrics Storage Area Network Systems) Business (2021–2026)
11.8.5 Inspur Recent Development
11.9 Lenovo
11.9.1 Lenovo Company Details
11.9.2 Lenovo Business Overview
11.9.3 Lenovo NVMe-oF SAN Systems (NVMe over Fabrics Storage Area Network Systems) Introduction
11.9.4 Lenovo Revenue in NVMe-oF SAN Systems (NVMe over Fabrics Storage Area Network Systems) Business (2021–2026)
11.9.5 Lenovo Recent Development
11.10 Fujitsu
11.10.1 Fujitsu Company Details
11.10.2 Fujitsu Business Overview
11.10.3 Fujitsu NVMe-oF SAN Systems (NVMe over Fabrics Storage Area Network Systems) Introduction
11.10.4 Fujitsu Revenue in NVMe-oF SAN Systems (NVMe over Fabrics Storage Area Network Systems) Business (2021–2026)
11.10.5 Fujitsu Recent Development
11.11 Oracle
11.11.1 Oracle Company Details
11.11.2 Oracle Business Overview
11.11.3 Oracle NVMe-oF SAN Systems (NVMe over Fabrics Storage Area Network Systems) Introduction
11.11.4 Oracle Revenue in NVMe-oF SAN Systems (NVMe over Fabrics Storage Area Network Systems) Business (2021–2026)
11.11.5 Oracle Recent Development
11.12 Broadcom
11.12.1 Broadcom Company Details
11.12.2 Broadcom Business Overview
11.12.3 Broadcom NVMe-oF SAN Systems (NVMe over Fabrics Storage Area Network Systems) Introduction
11.12.4 Broadcom Revenue in NVMe-oF SAN Systems (NVMe over Fabrics Storage Area Network Systems) Business (2021–2026)
11.12.5 Broadcom Recent Development
11.13 Marvell
11.13.1 Marvell Company Details
11.13.2 Marvell Business Overview
11.13.3 Marvell NVMe-oF SAN Systems (NVMe over Fabrics Storage Area Network Systems) Introduction
11.13.4 Marvell Revenue in NVMe-oF SAN Systems (NVMe over Fabrics Storage Area Network Systems) Business (2021–2026)
11.13.5 Marvell Recent Development
11.14 Micron Technology
11.14.1 Micron Technology Company Details
11.14.2 Micron Technology Business Overview
11.14.3 Micron Technology NVMe-oF SAN Systems (NVMe over Fabrics Storage Area Network Systems) Introduction
11.14.4 Micron Technology Revenue in NVMe-oF SAN Systems (NVMe over Fabrics Storage Area Network Systems) Business (2021–2026)
11.14.5 Micron Technology Recent Development
11.15 Samsung Electronics
11.15.1 Samsung Electronics Company Details
11.15.2 Samsung Electronics Business Overview
11.15.3 Samsung Electronics NVMe-oF SAN Systems (NVMe over Fabrics Storage Area Network Systems) Introduction
11.15.4 Samsung Electronics Revenue in NVMe-oF SAN Systems (NVMe over Fabrics Storage Area Network Systems) Business (2021–2026)
11.15.5 Samsung Electronics Recent Development
11.16 Western Digital
11.16.1 Western Digital Company Details
11.16.2 Western Digital Business Overview
11.16.3 Western Digital NVMe-oF SAN Systems (NVMe over Fabrics Storage Area Network Systems) Introduction
11.16.4 Western Digital Revenue in NVMe-oF SAN Systems (NVMe over Fabrics Storage Area Network Systems) Business (2021–2026)
11.16.5 Western Digital Recent Development
11.17 Kioxia
11.17.1 Kioxia Company Details
11.17.2 Kioxia Business Overview
11.17.3 Kioxia NVMe-oF SAN Systems (NVMe over Fabrics Storage Area Network Systems) Introduction
11.17.4 Kioxia Revenue in NVMe-oF SAN Systems (NVMe over Fabrics Storage Area Network Systems) Business (2021–2026)
11.17.5 Kioxia Recent Development
11.18 Vast Data
11.18.1 Vast Data Company Details
11.18.2 Vast Data Business Overview
11.18.3 Vast Data NVMe-oF SAN Systems (NVMe over Fabrics Storage Area Network Systems) Introduction
11.18.4 Vast Data Revenue in NVMe-oF SAN Systems (NVMe over Fabrics Storage Area Network Systems) Business (2021–2026)
11.18.5 Vast Data Recent Development
11.19 Weka
11.19.1 Weka Company Details
11.19.2 Weka Business Overview
11.19.3 Weka NVMe-oF SAN Systems (NVMe over Fabrics Storage Area Network Systems) Introduction
11.19.4 Weka Revenue in NVMe-oF SAN Systems (NVMe over Fabrics Storage Area Network Systems) Business (2021–2026)
11.19.5 Weka Recent Development
11.20 Lightbits Labs
11.20.1 Lightbits Labs Company Details
11.20.2 Lightbits Labs Business Overview
11.20.3 Lightbits Labs NVMe-oF SAN Systems (NVMe over Fabrics Storage Area Network Systems) Introduction
11.20.4 Lightbits Labs Revenue in NVMe-oF SAN Systems (NVMe over Fabrics Storage Area Network Systems) Business (2021–2026)
11.20.5 Lightbits Labs Recent Development
12 Analyst's Viewpoints/Conclusions
13 Appendix
13.1 Research Methodology
13.1.1 Methodology/Research Approach
13.1.1.1 Research Programs/Design
13.1.1.2 Market Size Estimation
13.1.1.3 Market Breakdown and Data Triangulation
13.1.2 Data Source
13.1.2.1 Secondary Sources
13.1.2.2 Primary Sources
13.2 Author Details
13.3 Disclaimer
List of Tables
 Table 1. Global NVMe-oF SAN Systems (NVMe over Fabrics Storage Area Network Systems) Market Size Growth Rate by Type (US$ Million): 2021 vs 2025 vs 2032
 Table 2. Key Players of All Flash
 Table 3. Key Players of Software Defined
 Table 4. Key Players of Disaggregated
 Table 5. Key Players of Hyper Converged
 Table 6. Key Players of Scale Out
 Table 7. Global NVMe-oF SAN Systems (NVMe over Fabrics Storage Area Network Systems) Market Size Growth Rate by Fabric and Connectivity (US$ Million): 2021 vs 2025 vs 2032
 Table 8. Key Players of Fc NVMe San Systems
 Table 9. Key Players of NVMe Tcp San Systems
 Table 10. Key Players of NVMe Rdma Roce San Systems
 Table 11. Key Players of NVMe Rdma Iwarp San Systems
 Table 12. Key Players of Multi Protocol NVMe Of San Systems
 Table 13. Global NVMe-oF SAN Systems (NVMe over Fabrics Storage Area Network Systems) Market Size Growth by Application (US$ Million): 2021 vs 2025 vs 2032
 Table 14. Global NVMe-oF SAN Systems (NVMe over Fabrics Storage Area Network Systems) Market Size by Region (US$ Million): 2021 vs 2025 vs 2032
 Table 15. Global NVMe-oF SAN Systems (NVMe over Fabrics Storage Area Network Systems) Market Size by Region (US$ Million), 2021–2026
 Table 16. Global NVMe-oF SAN Systems (NVMe over Fabrics Storage Area Network Systems) Market Share by Region (2021–2026)
 Table 17. Global NVMe-oF SAN Systems (NVMe over Fabrics Storage Area Network Systems) Forecasted Market Size by Region (US$ Million), 2027–2032
 Table 18. Global NVMe-oF SAN Systems (NVMe over Fabrics Storage Area Network Systems) Market Share by Region (2027–2032)
 Table 19. NVMe-oF SAN Systems (NVMe over Fabrics Storage Area Network Systems) Market Trends
 Table 20. NVMe-oF SAN Systems (NVMe over Fabrics Storage Area Network Systems) Market Drivers
 Table 21. NVMe-oF SAN Systems (NVMe over Fabrics Storage Area Network Systems) Market Challenges
 Table 22. NVMe-oF SAN Systems (NVMe over Fabrics Storage Area Network Systems) Market Restraints
 Table 23. Global NVMe-oF SAN Systems (NVMe over Fabrics Storage Area Network Systems) Revenue by Players (US$ Million), 2021–2026
 Table 24. Global NVMe-oF SAN Systems (NVMe over Fabrics Storage Area Network Systems) Market Share by Players (2021–2026)
 Table 25. Global Top NVMe-oF SAN Systems (NVMe over Fabrics Storage Area Network Systems) Players by Tier (Tier 1, Tier 2, and Tier 3), based on NVMe-oF SAN Systems (NVMe over Fabrics Storage Area Network Systems) Revenue, 2025
 Table 26. Ranking of Global Top NVMe-oF SAN Systems (NVMe over Fabrics Storage Area Network Systems) Companies by Revenue (US$ Million) in 2025
 Table 27. Global 5 Largest Players Market Share by NVMe-oF SAN Systems (NVMe over Fabrics Storage Area Network Systems) Revenue (CR5 and HHI), 2021–2026
 Table 28. Global Key Players of NVMe-oF SAN Systems (NVMe over Fabrics Storage Area Network Systems), Headquarters and Area Served
 Table 29. Global Key Players of NVMe-oF SAN Systems (NVMe over Fabrics Storage Area Network Systems), Products and Applications
 Table 30. Global Key Players of NVMe-oF SAN Systems (NVMe over Fabrics Storage Area Network Systems), Date of General Availability (GA)
 Table 31. Mergers and Acquisitions, Expansion Plans
 Table 32. Global NVMe-oF SAN Systems (NVMe over Fabrics Storage Area Network Systems) Market Size by Type (US$ Million), 2021–2026
 Table 33. Global NVMe-oF SAN Systems (NVMe over Fabrics Storage Area Network Systems) Revenue Market Share by Type (2021–2026)
 Table 34. Global NVMe-oF SAN Systems (NVMe over Fabrics Storage Area Network Systems) Forecasted Market Size by Type (US$ Million), 2027–2032
 Table 35. Global NVMe-oF SAN Systems (NVMe over Fabrics Storage Area Network Systems) Revenue Market Share by Type (2027–2032)
 Table 36. Global NVMe-oF SAN Systems (NVMe over Fabrics Storage Area Network Systems) Market Size by Application (US$ Million), 2021–2026
 Table 37. Global NVMe-oF SAN Systems (NVMe over Fabrics Storage Area Network Systems) Revenue Market Share by Application (2021–2026)
 Table 38. Global NVMe-oF SAN Systems (NVMe over Fabrics Storage Area Network Systems) Forecasted Market Size by Application (US$ Million), 2027–2032
 Table 39. Global NVMe-oF SAN Systems (NVMe over Fabrics Storage Area Network Systems) Revenue Market Share by Application (2027–2032)
 Table 40. North America NVMe-oF SAN Systems (NVMe over Fabrics Storage Area Network Systems) Market Size Growth Rate by Country (US$ Million): 2021 vs 2025 vs 2032
 Table 41. North America NVMe-oF SAN Systems (NVMe over Fabrics Storage Area Network Systems) Market Size by Country (US$ Million), 2021–2026
 Table 42. North America NVMe-oF SAN Systems (NVMe over Fabrics Storage Area Network Systems) Market Size by Country (US$ Million), 2027–2032
 Table 43. Europe NVMe-oF SAN Systems (NVMe over Fabrics Storage Area Network Systems) Market Size Growth Rate by Country (US$ Million): 2021 vs 2025 vs 2032
 Table 44. Europe NVMe-oF SAN Systems (NVMe over Fabrics Storage Area Network Systems) Market Size by Country (US$ Million), 2021–2026
 Table 45. Europe NVMe-oF SAN Systems (NVMe over Fabrics Storage Area Network Systems) Market Size by Country (US$ Million), 2027–2032
 Table 46. Asia-Pacific NVMe-oF SAN Systems (NVMe over Fabrics Storage Area Network Systems) Market Size Growth Rate by Region (US$ Million): 2021 vs 2025 vs 2032
 Table 47. Asia-Pacific NVMe-oF SAN Systems (NVMe over Fabrics Storage Area Network Systems) Market Size by Region (US$ Million), 2021–2026
 Table 48. Asia-Pacific NVMe-oF SAN Systems (NVMe over Fabrics Storage Area Network Systems) Market Size by Region (US$ Million), 2027–2032
 Table 49. Latin America NVMe-oF SAN Systems (NVMe over Fabrics Storage Area Network Systems) Market Size Growth Rate by Country (US$ Million): 2021 vs 2025 vs 2032
 Table 50. Latin America NVMe-oF SAN Systems (NVMe over Fabrics Storage Area Network Systems) Market Size by Country (US$ Million), 2021–2026
 Table 51. Latin America NVMe-oF SAN Systems (NVMe over Fabrics Storage Area Network Systems) Market Size by Country (US$ Million), 2027–2032
 Table 52. Middle East & Africa NVMe-oF SAN Systems (NVMe over Fabrics Storage Area Network Systems) Market Size Growth Rate by Country (US$ Million): 2021 vs 2025 vs 2032
 Table 53. Middle East & Africa NVMe-oF SAN Systems (NVMe over Fabrics Storage Area Network Systems) Market Size by Country (US$ Million), 2021–2026
 Table 54. Middle East & Africa NVMe-oF SAN Systems (NVMe over Fabrics Storage Area Network Systems) Market Size by Country (US$ Million), 2027–2032
 Table 55. Dell Technologies Company Details
 Table 56. Dell Technologies Business Overview
 Table 57. Dell Technologies NVMe-oF SAN Systems (NVMe over Fabrics Storage Area Network Systems) Product
 Table 58. Dell Technologies Revenue in NVMe-oF SAN Systems (NVMe over Fabrics Storage Area Network Systems) Business (US$ Million), 2021–2026
 Table 59. Dell Technologies Recent Development
 Table 60. Hewlett Packard Enterprise Company Details
 Table 61. Hewlett Packard Enterprise Business Overview
 Table 62. Hewlett Packard Enterprise NVMe-oF SAN Systems (NVMe over Fabrics Storage Area Network Systems) Product
 Table 63. Hewlett Packard Enterprise Revenue in NVMe-oF SAN Systems (NVMe over Fabrics Storage Area Network Systems) Business (US$ Million), 2021–2026
 Table 64. Hewlett Packard Enterprise Recent Development
 Table 65. Netapp Company Details
 Table 66. Netapp Business Overview
 Table 67. Netapp NVMe-oF SAN Systems (NVMe over Fabrics Storage Area Network Systems) Product
 Table 68. Netapp Revenue in NVMe-oF SAN Systems (NVMe over Fabrics Storage Area Network Systems) Business (US$ Million), 2021–2026
 Table 69. Netapp Recent Development
 Table 70. Ibm Company Details
 Table 71. Ibm Business Overview
 Table 72. Ibm NVMe-oF SAN Systems (NVMe over Fabrics Storage Area Network Systems) Product
 Table 73. Ibm Revenue in NVMe-oF SAN Systems (NVMe over Fabrics Storage Area Network Systems) Business (US$ Million), 2021–2026
 Table 74. Ibm Recent Development
 Table 75. Huawei Company Details
 Table 76. Huawei Business Overview
 Table 77. Huawei NVMe-oF SAN Systems (NVMe over Fabrics Storage Area Network Systems) Product
 Table 78. Huawei Revenue in NVMe-oF SAN Systems (NVMe over Fabrics Storage Area Network Systems) Business (US$ Million), 2021–2026
 Table 79. Huawei Recent Development
 Table 80. Hitachi Vantara Company Details
 Table 81. Hitachi Vantara Business Overview
 Table 82. Hitachi Vantara NVMe-oF SAN Systems (NVMe over Fabrics Storage Area Network Systems) Product
 Table 83. Hitachi Vantara Revenue in NVMe-oF SAN Systems (NVMe over Fabrics Storage Area Network Systems) Business (US$ Million), 2021–2026
 Table 84. Hitachi Vantara Recent Development
 Table 85. Pure Storage Company Details
 Table 86. Pure Storage Business Overview
 Table 87. Pure Storage NVMe-oF SAN Systems (NVMe over Fabrics Storage Area Network Systems) Product
 Table 88. Pure Storage Revenue in NVMe-oF SAN Systems (NVMe over Fabrics Storage Area Network Systems) Business (US$ Million), 2021–2026
 Table 89. Pure Storage Recent Development
 Table 90. Inspur Company Details
 Table 91. Inspur Business Overview
 Table 92. Inspur NVMe-oF SAN Systems (NVMe over Fabrics Storage Area Network Systems) Product
 Table 93. Inspur Revenue in NVMe-oF SAN Systems (NVMe over Fabrics Storage Area Network Systems) Business (US$ Million), 2021–2026
 Table 94. Inspur Recent Development
 Table 95. Lenovo Company Details
 Table 96. Lenovo Business Overview
 Table 97. Lenovo NVMe-oF SAN Systems (NVMe over Fabrics Storage Area Network Systems) Product
 Table 98. Lenovo Revenue in NVMe-oF SAN Systems (NVMe over Fabrics Storage Area Network Systems) Business (US$ Million), 2021–2026
 Table 99. Lenovo Recent Development
 Table 100. Fujitsu Company Details
 Table 101. Fujitsu Business Overview
 Table 102. Fujitsu NVMe-oF SAN Systems (NVMe over Fabrics Storage Area Network Systems) Product
 Table 103. Fujitsu Revenue in NVMe-oF SAN Systems (NVMe over Fabrics Storage Area Network Systems) Business (US$ Million), 2021–2026
 Table 104. Fujitsu Recent Development
 Table 105. Oracle Company Details
 Table 106. Oracle Business Overview
 Table 107. Oracle NVMe-oF SAN Systems (NVMe over Fabrics Storage Area Network Systems) Product
 Table 108. Oracle Revenue in NVMe-oF SAN Systems (NVMe over Fabrics Storage Area Network Systems) Business (US$ Million), 2021–2026
 Table 109. Oracle Recent Development
 Table 110. Broadcom Company Details
 Table 111. Broadcom Business Overview
 Table 112. Broadcom NVMe-oF SAN Systems (NVMe over Fabrics Storage Area Network Systems) Product
 Table 113. Broadcom Revenue in NVMe-oF SAN Systems (NVMe over Fabrics Storage Area Network Systems) Business (US$ Million), 2021–2026
 Table 114. Broadcom Recent Development
 Table 115. Marvell Company Details
 Table 116. Marvell Business Overview
 Table 117. Marvell NVMe-oF SAN Systems (NVMe over Fabrics Storage Area Network Systems) Product
 Table 118. Marvell Revenue in NVMe-oF SAN Systems (NVMe over Fabrics Storage Area Network Systems) Business (US$ Million), 2021–2026
 Table 119. Marvell Recent Development
 Table 120. Micron Technology Company Details
 Table 121. Micron Technology Business Overview
 Table 122. Micron Technology NVMe-oF SAN Systems (NVMe over Fabrics Storage Area Network Systems) Product
 Table 123. Micron Technology Revenue in NVMe-oF SAN Systems (NVMe over Fabrics Storage Area Network Systems) Business (US$ Million), 2021–2026
 Table 124. Micron Technology Recent Development
 Table 125. Samsung Electronics Company Details
 Table 126. Samsung Electronics Business Overview
 Table 127. Samsung Electronics NVMe-oF SAN Systems (NVMe over Fabrics Storage Area Network Systems) Product
 Table 128. Samsung Electronics Revenue in NVMe-oF SAN Systems (NVMe over Fabrics Storage Area Network Systems) Business (US$ Million), 2021–2026
 Table 129. Samsung Electronics Recent Development
 Table 130. Western Digital Company Details
 Table 131. Western Digital Business Overview
 Table 132. Western Digital NVMe-oF SAN Systems (NVMe over Fabrics Storage Area Network Systems) Product
 Table 133. Western Digital Revenue in NVMe-oF SAN Systems (NVMe over Fabrics Storage Area Network Systems) Business (US$ Million), 2021–2026
 Table 134. Western Digital Recent Development
 Table 135. Kioxia Company Details
 Table 136. Kioxia Business Overview
 Table 137. Kioxia NVMe-oF SAN Systems (NVMe over Fabrics Storage Area Network Systems) Product
 Table 138. Kioxia Revenue in NVMe-oF SAN Systems (NVMe over Fabrics Storage Area Network Systems) Business (US$ Million), 2021–2026
 Table 139. Kioxia Recent Development
 Table 140. Vast Data Company Details
 Table 141. Vast Data Business Overview
 Table 142. Vast Data NVMe-oF SAN Systems (NVMe over Fabrics Storage Area Network Systems) Product
 Table 143. Vast Data Revenue in NVMe-oF SAN Systems (NVMe over Fabrics Storage Area Network Systems) Business (US$ Million), 2021–2026
 Table 144. Vast Data Recent Development
 Table 145. Weka Company Details
 Table 146. Weka Business Overview
 Table 147. Weka NVMe-oF SAN Systems (NVMe over Fabrics Storage Area Network Systems) Product
 Table 148. Weka Revenue in NVMe-oF SAN Systems (NVMe over Fabrics Storage Area Network Systems) Business (US$ Million), 2021–2026
 Table 149. Weka Recent Development
 Table 150. Lightbits Labs Company Details
 Table 151. Lightbits Labs Business Overview
 Table 152. Lightbits Labs NVMe-oF SAN Systems (NVMe over Fabrics Storage Area Network Systems) Product
 Table 153. Lightbits Labs Revenue in NVMe-oF SAN Systems (NVMe over Fabrics Storage Area Network Systems) Business (US$ Million), 2021–2026
 Table 154. Lightbits Labs Recent Development
 Table 155. Research Programs/Design for This Report
 Table 156. Key Data Information from Secondary Sources
 Table 157. Key Data Information from Primary Sources
 Table 158. Authors List of This Report


List of Figures
 Figure 1. NVMe-oF SAN Systems (NVMe over Fabrics Storage Area Network Systems) Picture
 Figure 2. Global NVMe-oF SAN Systems (NVMe over Fabrics Storage Area Network Systems) Market Size Comparison by Type (US$ Million), 2021–2032
 Figure 3. Global NVMe-oF SAN Systems (NVMe over Fabrics Storage Area Network Systems) Market Share by Type: 2025 vs 2032
 Figure 4. All Flash Features
 Figure 5. Software Defined Features
 Figure 6. Disaggregated Features
 Figure 7. Hyper Converged Features
 Figure 8. Scale Out Features
 Figure 9. Global NVMe-oF SAN Systems (NVMe over Fabrics Storage Area Network Systems) Market Size Comparison by Fabric and Connectivity (US$ Million), 2021–2032
 Figure 10. Fc NVMe San Systems Features
 Figure 11. NVMe Tcp San Systems Features
 Figure 12. NVMe Rdma Roce San Systems Features
 Figure 13. NVMe Rdma Iwarp San Systems Features
 Figure 14. Multi Protocol NVMe Of San Systems Features
 Figure 15. Global NVMe-oF SAN Systems (NVMe over Fabrics Storage Area Network Systems) Market Size by Application (US$ Million), 2021–2032
 Figure 16. Global NVMe-oF SAN Systems (NVMe over Fabrics Storage Area Network Systems) Market Share by Application: 2025 vs 2032
 Figure 17. Enterprise Databases Case Studies
 Figure 18. Server Virtualization Case Studies
 Figure 19. Private Cloud Infrastructure Case Studies
 Figure 20. Mission Critical Applications Case Studies
 Figure 21. High Availability Clusters Case Studies
 Figure 22. AI and Machine Learning Workloads Case Studies
 Figure 23. NVMe-oF SAN Systems (NVMe over Fabrics Storage Area Network Systems) Report Years Considered
 Figure 24. Global NVMe-oF SAN Systems (NVMe over Fabrics Storage Area Network Systems) Market Size (US$ Million), Year-over-Year: 2021–2032
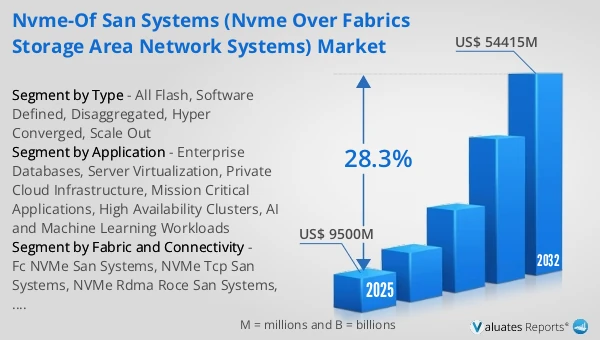
 Figure 25. Global NVMe-oF SAN Systems (NVMe over Fabrics Storage Area Network Systems) Market Size, (US$ Million), 2021 vs 2025 vs 2032
 Figure 26. Global NVMe-oF SAN Systems (NVMe over Fabrics Storage Area Network Systems) Market Share by Region: 2025 vs 2032
 Figure 27. Global NVMe-oF SAN Systems (NVMe over Fabrics Storage Area Network Systems) Market Share by Players in 2025
 Figure 28. Global NVMe-oF SAN Systems (NVMe over Fabrics Storage Area Network Systems) Market Share by Company Type (Tier 1, Tier 2, and Tier 3)
 Figure 29. The Top 10 and 5 Players Market Share by NVMe-oF SAN Systems (NVMe over Fabrics Storage Area Network Systems) Revenue in 2025
 Figure 30. North America NVMe-oF SAN Systems (NVMe over Fabrics Storage Area Network Systems) Market Size YoY Growth (US$ Million), 2021–2032
 Figure 31. North America NVMe-oF SAN Systems (NVMe over Fabrics Storage Area Network Systems) Market Share by Country (2021–2032)
 Figure 32. United States NVMe-oF SAN Systems (NVMe over Fabrics Storage Area Network Systems) Market Size YoY Growth (US$ Million), 2021–2032
 Figure 33. Canada NVMe-oF SAN Systems (NVMe over Fabrics Storage Area Network Systems) Market Size YoY Growth (US$ Million), 2021–2032
 Figure 34. Europe NVMe-oF SAN Systems (NVMe over Fabrics Storage Area Network Systems) Market Size YoY Growth (US$ Million), 2021–2032
 Figure 35. Europe NVMe-oF SAN Systems (NVMe over Fabrics Storage Area Network Systems) Market Share by Country (2021–2032)
 Figure 36. Germany NVMe-oF SAN Systems (NVMe over Fabrics Storage Area Network Systems) Market Size YoY Growth (US$ Million), 2021–2032
 Figure 37. France NVMe-oF SAN Systems (NVMe over Fabrics Storage Area Network Systems) Market Size YoY Growth (US$ Million), 2021–2032
 Figure 38. U.K. NVMe-oF SAN Systems (NVMe over Fabrics Storage Area Network Systems) Market Size YoY Growth (US$ Million), 2021–2032
 Figure 39. Italy NVMe-oF SAN Systems (NVMe over Fabrics Storage Area Network Systems) Market Size YoY Growth (US$ Million), 2021–2032
 Figure 40. Russia NVMe-oF SAN Systems (NVMe over Fabrics Storage Area Network Systems) Market Size YoY Growth (US$ Million), 2021–2032
 Figure 41. Ireland NVMe-oF SAN Systems (NVMe over Fabrics Storage Area Network Systems) Market Size YoY Growth (US$ Million), 2021–2032
 Figure 42. Asia-Pacific NVMe-oF SAN Systems (NVMe over Fabrics Storage Area Network Systems) Market Size YoY Growth (US$ Million), 2021–2032
 Figure 43. Asia-Pacific NVMe-oF SAN Systems (NVMe over Fabrics Storage Area Network Systems) Market Share by Region (2021–2032)
 Figure 44. China NVMe-oF SAN Systems (NVMe over Fabrics Storage Area Network Systems) Market Size YoY Growth (US$ Million), 2021–2032
 Figure 45. Japan NVMe-oF SAN Systems (NVMe over Fabrics Storage Area Network Systems) Market Size YoY Growth (US$ Million), 2021–2032
 Figure 46. South Korea NVMe-oF SAN Systems (NVMe over Fabrics Storage Area Network Systems) Market Size YoY Growth (US$ Million), 2021–2032
 Figure 47. Southeast Asia NVMe-oF SAN Systems (NVMe over Fabrics Storage Area Network Systems) Market Size YoY Growth (US$ Million), 2021–2032
 Figure 48. India NVMe-oF SAN Systems (NVMe over Fabrics Storage Area Network Systems) Market Size YoY Growth (US$ Million), 2021–2032
 Figure 49. Australia & New Zealand NVMe-oF SAN Systems (NVMe over Fabrics Storage Area Network Systems) Market Size YoY Growth (US$ Million), 2021–2032
 Figure 50. Latin America NVMe-oF SAN Systems (NVMe over Fabrics Storage Area Network Systems) Market Size YoY Growth (US$ Million), 2021–2032
 Figure 51. Latin America NVMe-oF SAN Systems (NVMe over Fabrics Storage Area Network Systems) Market Share by Country (2021–2032)
 Figure 52. Mexico NVMe-oF SAN Systems (NVMe over Fabrics Storage Area Network Systems) Market Size YoY Growth (US$ Million), 2021–2032
 Figure 53. Brazil NVMe-oF SAN Systems (NVMe over Fabrics Storage Area Network Systems) Market Size YoY Growth (US$ Million), 2021–2032
 Figure 54. Middle East & Africa NVMe-oF SAN Systems (NVMe over Fabrics Storage Area Network Systems) Market Size YoY Growth (US$ Million), 2021–2032
 Figure 55. Middle East & Africa NVMe-oF SAN Systems (NVMe over Fabrics Storage Area Network Systems) Market Share by Country (2021–2032)
 Figure 56. Israel NVMe-oF SAN Systems (NVMe over Fabrics Storage Area Network Systems) Market Size YoY Growth (US$ Million), 2021–2032
 Figure 57. Saudi Arabia NVMe-oF SAN Systems (NVMe over Fabrics Storage Area Network Systems) Market Size YoY Growth (US$ Million), 2021–2032
 Figure 58. UAE NVMe-oF SAN Systems (NVMe over Fabrics Storage Area Network Systems) Market Size YoY Growth (US$ Million), 2021–2032
 Figure 59. Dell Technologies Revenue Growth Rate in NVMe-oF SAN Systems (NVMe over Fabrics Storage Area Network Systems) Business (2021–2026)
 Figure 60. Hewlett Packard Enterprise Revenue Growth Rate in NVMe-oF SAN Systems (NVMe over Fabrics Storage Area Network Systems) Business (2021–2026)
 Figure 61. Netapp Revenue Growth Rate in NVMe-oF SAN Systems (NVMe over Fabrics Storage Area Network Systems) Business (2021–2026)
 Figure 62. Ibm Revenue Growth Rate in NVMe-oF SAN Systems (NVMe over Fabrics Storage Area Network Systems) Business (2021–2026)
 Figure 63. Huawei Revenue Growth Rate in NVMe-oF SAN Systems (NVMe over Fabrics Storage Area Network Systems) Business (2021–2026)
 Figure 64. Hitachi Vantara Revenue Growth Rate in NVMe-oF SAN Systems (NVMe over Fabrics Storage Area Network Systems) Business (2021–2026)
 Figure 65. Pure Storage Revenue Growth Rate in NVMe-oF SAN Systems (NVMe over Fabrics Storage Area Network Systems) Business (2021–2026)
 Figure 66. Inspur Revenue Growth Rate in NVMe-oF SAN Systems (NVMe over Fabrics Storage Area Network Systems) Business (2021–2026)
 Figure 67. Lenovo Revenue Growth Rate in NVMe-oF SAN Systems (NVMe over Fabrics Storage Area Network Systems) Business (2021–2026)
 Figure 68. Fujitsu Revenue Growth Rate in NVMe-oF SAN Systems (NVMe over Fabrics Storage Area Network Systems) Business (2021–2026)
 Figure 69. Oracle Revenue Growth Rate in NVMe-oF SAN Systems (NVMe over Fabrics Storage Area Network Systems) Business (2021–2026)
 Figure 70. Broadcom Revenue Growth Rate in NVMe-oF SAN Systems (NVMe over Fabrics Storage Area Network Systems) Business (2021–2026)
 Figure 71. Marvell Revenue Growth Rate in NVMe-oF SAN Systems (NVMe over Fabrics Storage Area Network Systems) Business (2021–2026)
 Figure 72. Micron Technology Revenue Growth Rate in NVMe-oF SAN Systems (NVMe over Fabrics Storage Area Network Systems) Business (2021–2026)
 Figure 73. Samsung Electronics Revenue Growth Rate in NVMe-oF SAN Systems (NVMe over Fabrics Storage Area Network Systems) Business (2021–2026)
 Figure 74. Western Digital Revenue Growth Rate in NVMe-oF SAN Systems (NVMe over Fabrics Storage Area Network Systems) Business (2021–2026)
 Figure 75. Kioxia Revenue Growth Rate in NVMe-oF SAN Systems (NVMe over Fabrics Storage Area Network Systems) Business (2021–2026)
 Figure 76. Vast Data Revenue Growth Rate in NVMe-oF SAN Systems (NVMe over Fabrics Storage Area Network Systems) Business (2021–2026)
 Figure 77. Weka Revenue Growth Rate in NVMe-oF SAN Systems (NVMe over Fabrics Storage Area Network Systems) Business (2021–2026)
 Figure 78. Lightbits Labs Revenue Growth Rate in NVMe-oF SAN Systems (NVMe over Fabrics Storage Area Network Systems) Business (2021–2026)
 Figure 79. Bottom-up and Top-down Approaches for This Report
 Figure 80. Data Triangulation
 Figure 81. Key Executives Interviewed
SELECT A FORMAT
Added to Cart
Electronic

$2900

Single User License
Electronic

$4350

Multi User License
Electronic

$5800

Enterprise License
Add to Cart
Buy Now (15% Discount)

OUR CUSTOMER

SIS Group of Schools

SIMILAR REPORTS