1 Shower Wall Panel Market Overview 1
1.1 Product Definition 1
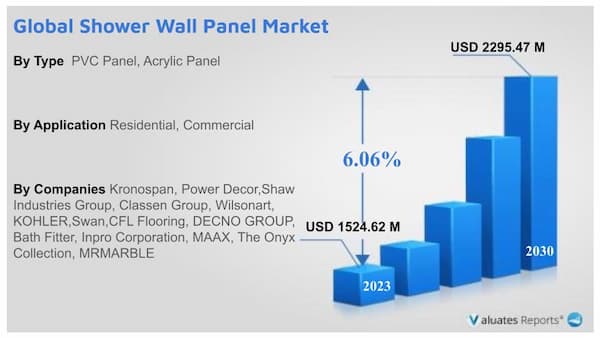
1.2 Shower Wall Panel by Type 1
1.2.1 Global Shower Wall Panel Market Value Comparison by Type (2024-2030) 1
1.2.2 PVC Panel 3
1.2.3 Acrylic Panel 3
1.2.4 Other 4
1.3 Shower Wall Panel by Application 4
1.3.1 Global Shower Wall Panel Market Value by Application (2024-2030) 4
1.3.2 Residential 6
1.3.3 Commercial 6
1.4 Global Shower Wall Panel Market Size Estimates and Forecasts 6
1.4.1 Global Shower Wall Panel Revenue 2019-2030 6
1.4.2 Global Shower Wall Panel Sales 2019-2030 8
1.5 Assumptions and Limitations 9
2 Shower Wall Panel Market Competition by Manufacturers 11
2.1 Global Shower Wall Panel Sales Market Share by Manufacturers (2020-2024) 11
2.2 Global Shower Wall Panel Revenue Market Share by Manufacturers (2020-2024) 14
2.3 Global Shower Wall Panel Average Price by Manufacturers (2020-2024) 16
2.4 Global Key Players of Shower Wall Panel, Industry Ranking in 2023 16
2.5 Global Key Manufacturers of Shower Wall Panel, Sales Area & Headquarters 17
2.6 Global Shower Wall Panel Market Competitive Situation and Trends 18
2.6.1 Global Shower Wall Panel Market Concentration Rate 18
2.6.2 The Global 5 and 10 Largest Shower Wall Panel Players Market Share by Revenue 19
2.6.3 Global Shower Wall Panel Market Share by Company Type (Tier 1, Tier 2, and Tier 3) 20
3 Global Shower Wall Panel Market Scenario by Region 21
3.1 Global Shower Wall Panel Market Size by Region: 2019 Versus 2023 Versus 2030 21
3.2 Global Shower Wall Panel Sales by Region: 2019-2030 22
3.2.1 Global Shower Wall Panel Sales by Region: 2019-2024 22
3.2.2 Global Shower Wall Panel Sales by Region: 2025-2030 22
3.3 Global Shower Wall Panel Revenue by Region: 2019-2030 23
3.3.1 Global Shower Wall Panel Revenue by Region: 2019-2024 23
3.3.2 Global Shower Wall Panel Revenue by Region: 2025-2030 24
3.4 North America Shower Wall Panel Market Facts & Figures by Country 24
3.4.1 North America Shower Wall Panel Sales by Country (2019-2030) 24
3.4.2 North America Shower Wall Panel Revenue by Country (2019-2030) 25
3.4.3 United States 26
3.4.4 Canada 26
3.4.5 Mexico 27
3.5 Europe Shower Wall Panel Market Facts & Figures by Country 27
3.5.1 Europe Shower Wall Panel Sales by Country (2019-2030) 27
3.5.2 Europe Shower Wall Panel Revenue by Country (2019-2030) 28
3.5.3 Germany 29
3.5.4 France 29
3.5.5 U.K. 30
3.5.6 Italy 31
3.5.7 Russia 31
3.6 Asia Pacific Shower Wall Panel Market Facts & Figures by Region 32
3.6.1 Asia Pacific Shower Wall Panel Sales by Region (2019-2030) 32
3.6.2 Asia Pacific Shower Wall Panel Revenue by Region (2019-2030) 32
3.6.3 China 34
3.6.4 Japan 34
3.6.5 South Korea 35
3.6.6 India 36
3.6.7 Australia 36
3.6.8 Southeast Asia 37
3.7 Latin America Shower Wall Panel Market Facts & Figures by Country 37
3.7.1 Latin America Shower Wall Panel Sales by Country (2019-2030) 37
3.7.2 Latin America Shower Wall Panel Revenue by Country 38
3.7.3 Brazil 39
3.7.4 Argentina 39
3.7.5 Colombia 40
3.8 Middle East and Africa Shower Wall Panel Market Facts & Figures by Country 40
3.8.1 Middle East and Africa Shower Wall Panel Sales by Country (2019-2030) 40
3.8.2 Middle East and Africa Shower Wall Panel Revenue by Country 41
3.8.3 Middle East 42
3.8.4 Africa 43
4 Segment by Type 44
4.1 Global Shower Wall Panel Sales by Type (2019-2030) 44
4.1.1 Global Shower Wall Panel Sales by Type (2019-2024) 44
4.1.2 Global Shower Wall Panel Sales by Type (2025-2030) 44
4.1.3 Global Shower Wall Panel Sales Market Share by Type (2019-2030) 44
4.2 Global Shower Wall Panel Revenue by Type (2019-2030) 45
4.2.1 Global Shower Wall Panel Revenue by Type (2019-2024) 45
4.2.2 Global Shower Wall Panel Revenue by Type (2025-2030) 46
4.2.3 Global Shower Wall Panel Revenue Market Share by Type (2019-2030) 46
4.3 Global Shower Wall Panel Price by Type (2019-2030) 47
5 Segment by Application 48
5.1 Global Shower Wall Panel Sales by Application (2019-2030) 48
5.1.1 Global Shower Wall Panel Sales by Application (2019-2024) 48
5.1.2 Global Shower Wall Panel Sales by Application (2025-2030) 48
5.1.3 Global Shower Wall Panel Sales Market Share by Application (2019-2030) 48
5.2 Global Shower Wall Panel Revenue by Application (2019-2030) 49
5.2.1 Global Shower Wall Panel Revenue by Application (2019-2024) 49
5.2.2 Global Shower Wall Panel Revenue by Application (2025-2030) 50
5.2.3 Global Shower Wall Panel Revenue Market Share by Application (2019-2030) 50
5.3 Global Shower Wall Panel Price by Application (2019-2030) 51
6 Key Companies Profiled 52
6.1 Kronospan 52
6.1.1 Kronospan Company Information 52
6.1.2 Kronospan Description and Business Overview 52
6.1.3 Kronospan Shower Wall Panel Sales, Revenue and Gross Margin (2020-2024) 52
6.1.4 Kronospan Shower Wall Panel Product Portfolio 53
6.2 Power Decor 53
6.2.1 Power Decor Company Information 53
6.2.2 Power Decor Description and Business Overview 54
6.2.3 Power Decor Shower Wall Panel Sales, Revenue and Gross Margin (2020-2024) 54
6.2.4 Power Decor Shower Wall Panel Product Portfolio 54
6.3 Shaw Industries Group 55
6.3.1 Shaw Industries Group Company Information 55
6.3.2 Shaw Industries Group Description and Business Overview 55
6.3.3 Shaw Industries Group Shower Wall Panel Sales, Revenue and Gross Margin (2020-2024) 55
6.3.4 Shaw Industries Group Shower Wall Panel Product Portfolio 56
6.4 Classen Group 56
6.4.1 Classen Group Company Information 56
6.4.2 Classen Group Description and Business Overview 57
6.4.3 Classen Group Shower Wall Panel Sales, Revenue and Gross Margin (2020-2024) 57
6.4.4 Classen Group Shower Wall Panel Product Portfolio 57
6.5 Wilsonart 58
6.5.1 Wilsonart Company Information 58
6.5.2 Wilsonart Description and Business Overview 59
6.5.3 Wilsonart Shower Wall Panel Sales, Revenue and Gross Margin (2020-2024) 59
6.5.4 Wilsonart Shower Wall Panel Product Portfolio 60
6.6 KOHLER 60
6.6.1 KOHLER Company Information 60
6.6.2 KOHLER Description and Business Overview 61
6.6.3 KOHLER Shower Wall Panel Sales, Revenue and Gross Margin (2020-2024) 61
6.6.4 KOHLER Shower Wall Panel Product Portfolio 62
6.7 Swan 62
6.7.1 Swan Company Information 62
6.7.2 Swan Description and Business Overview 63
6.7.3 Swan Shower Wall Panel Sales, Revenue and Gross Margin (2020-2024) 63
6.7.4 Swan Shower Wall Panel Product Portfolio 64
6.8 CFL Flooring 64
6.8.1 CFL Flooring Company Information 64
6.8.2 CFL Flooring Description and Business Overview 65
6.8.3 CFL Flooring Shower Wall Panel Sales, Revenue and Gross Margin (2020-2024) 65
6.8.4 CFL Flooring Shower Wall Panel Product Portfolio 66
6.9 DECNO GROUP 66
6.9.1 DECNO GROUP Company Information 66
6.9.2 DECNO GROUP Description and Business Overview 67
6.9.3 DECNO GROUP Shower Wall Panel Sales, Revenue and Gross Margin (2020-2024) 67
6.9.4 DECNO GROUP Shower Wall Panel Product Portfolio 68
6.10 Bath Fitter 68
6.10.1 Bath Fitter Company Information 68
6.10.2 Bath Fitter Description and Business Overview 69
6.10.3 Bath Fitter Shower Wall Panel Sales, Revenue and Gross Margin (2020-2024) 69
6.10.4 Bath Fitter Shower Wall Panel Product Portfolio 70
6.11 Inpro Corporation 70
6.11.1 Inpro Corporation Company Information 70
6.11.2 Inpro Corporation Description and Business Overview 71
6.11.3 Inpro Corporation Shower Wall Panel Sales, Revenue and Gross Margin (2020-2024) 71
6.11.4 Inpro Corporation Shower Wall Panel Product Portfolio 72
6.12 MAAX 72
6.12.1 MAAX Company Information 72
6.12.2 MAAX Description and Business Overview 73
6.12.3 MAAX Shower Wall Panel Sales, Revenue and Gross Margin (2020-2024) 73
6.12.4 MAAX Shower Wall Panel Product Portfolio 74
6.13 The Onyx Collection 74
6.13.1 The Onyx Collection Company Information 74
6.13.2 The Onyx Collection Description and Business Overview 75
6.13.3 The Onyx Collection Shower Wall Panel Sales, Revenue and Gross Margin (2020-2024) 75
6.13.4 The Onyx Collection Shower Wall Panel Product Portfolio 75
6.14 MRMARBLE 76
6.14.1 MRMARBLE Company Information 76
6.14.2 MRMARBLE Description and Business Overview 76
6.14.3 MRMARBLE Shower Wall Panel Sales, Revenue and Gross Margin (2020-2024) 77
6.14.4 MRMARBLE Shower Wall Panel Product Portfolio 77
7 Industry Chain and Sales Channels Analysis 78
7.1 Shower Wall Panel Industry Chain Analysis 78
7.2 Shower Wall Panel Key Raw Materials 78
7.2.1 Key Raw Materials 78
7.2.2 Raw Materials Key Suppliers 79
7.3 Shower Wall Panel Sales and Marketing 80
7.4 Shower Wall Panel Customers 80
8 Shower Wall Panel Market Dynamics 82
8.1 Shower Wall Panel Industry Trends 82
8.2 Shower Wall Panel Market Drivers 82
8.3 Shower Wall Panel Market Challenges 83
9 Research Findings and Conclusion 84
10 Methodology and Data Source 85
10.1 Methodology/Research Approach 85
10.1.1 Research Programs/Design 85
10.1.2 Market Size Estimation 86
10.1.3 Market Breakdown and Data Triangulation 87
10.2 Data Source 88
10.2.1 Secondary Sources 88
10.2.2 Primary Sources 89
10.3 Author List 91
10.4 Disclaimer 91
FEATURED COMPANIES
Multipanel
Starline
BerryAlloc
Showerwall
Q-Board
Splashwall
Vistelle
Mira Showers
Mermaid
CladdTech
List of Table
Table 1. Global Shower Wall Panel Market Value Comparison by Type (2024-2030) & (US$ Million) 1
Table 2. Global Shower Wall Panel Market Value by Application (2024-2030) & (US$ Million) 4
Table 3. Global Shower Wall Panel Market Competitive Situation by Manufacturers in 2023 11
Table 4. Global Shower Wall Panel Sales (K Sqm) of Key Manufacturers (2020-2024) 12
Table 5. Global Shower Wall Panel Sales Market Share by Manufacturers (2020-2024) 12
Table 6. Global Shower Wall Panel Revenue (US$ Million) by Manufacturers (2020-2024) 14
Table 7. Global Shower Wall Panel Revenue Share by Manufacturers (2020-2024) 14
Table 8. Global Market Shower Wall Panel Average Price (US$/Sqm) of Key Manufacturers (2020-2024) 16
Table 9. Global Key Players of Shower Wall Panel, Industry Ranking, 2022 VS 2023 VS 2024 16
Table 10. Global Key Manufacturers of Shower Wall Panel, Sales Area & Headquarters 17
Table 11. Global Manufacturers Market Concentration Ratio (CR5) 18
Table 12. Global Shower Wall Panel by Company Type (Tier 1, Tier 2, and Tier 3) & (based on the Revenue in Shower Wall Panel as of 2023) 20
Table 13. Global Shower Wall Panel Market Size by Region (US$ Million): 2019 VS 2023 VS 2030 21
Table 14. Global Shower Wall Panel Sales by Region (2019-2024) & (K Sqm) 22
Table 15. Global Shower Wall Panel Sales Market Share by Region (2019-2024) 22
Table 16. Global Shower Wall Panel Sales by Region (2025-2030) & (K Sqm) 22
Table 17. Global Shower Wall Panel Sales Market Share by Region (2025-2030) 23
Table 18. Global Shower Wall Panel Revenue by Region (2019-2024) & (US$ Million) 23
Table 19. Global Shower Wall Panel Revenue Market Share by Region (2019-2024) 23
Table 20. Global Shower Wall Panel Revenue by Region (2025-2030) & (US$ Million) 24
Table 21. Global Shower Wall Panel Revenue Market Share by Region (2025-2030) 24
Table 22. North America Shower Wall Panel Sales by Country (2019-2024) & (K Sqm) 24
Table 23. North America Shower Wall Panel Sales by Country (2025-2030) & (K Sqm) 25
Table 24. North America Shower Wall Panel Revenue by Country (2019-2024) & (US$ Million) 25
Table 25. North America Shower Wall Panel Revenue by Country (2025-2030) & (US$ Million) 25
Table 26. Europe Shower Wall Panel Sales by Country (2019-2024) & (K Sqm) 27
Table 27. Europe Shower Wall Panel Sales by Country (2025-2030) & (K Sqm) 28
Table 28. Europe Shower Wall Panel Revenue by Country (2019-2024) & (US$ Million) 28
Table 29. Europe Shower Wall Panel Revenue by Country (2025-2030) & (US$ Million) 28
Table 30. Asia Pacific Shower Wall Panel Sales by Region (2019-2024) & (K Sqm) 32
Table 31. Asia Pacific Shower Wall Panel Sales by Region (2025-2030) & (K Sqm) 32
Table 32. Asia Pacific Shower Wall Panel Revenue by Region (2019-2024) & (US$ Million) 32
Table 33. Asia Pacific Shower Wall Panel Revenue by Region (2025-2030) & (US$ Million) 33
Table 34. Latin America Shower Wall Panel Sales by Country (2019-2024) & (K Sqm) 37
Table 35. Latin America Shower Wall Panel Sales by Country (2025-2030) & (K Sqm) 37
Table 36. Latin America Shower Wall Panel Revenue by Country (2019-2024) & (US$ Million) 38
Table 37. Latin America Shower Wall Panel Revenue Market Share by Country (2019-2024) 38
Table 38. Middle East and Africa Shower Wall Panel Sales by Country (2019-2024) & (K Sqm) 40
Table 39. Middle East and Africa Shower Wall Panel Sales by Country (2025-2030) & (K Sqm) 40
Table 40. Middle East and Africa Shower Wall Panel Revenue by Country (2019-2024) & (US$ Million) 41
Table 41. Middle East and Africa Shower Wall Panel Revenue by Country (2025-2030) & (US$ Million) 41
Table 42. Global Shower Wall Panel Sales (K Sqm) by Type (2019-2024) 44
Table 43. Global Shower Wall Panel Sales (K Sqm) by Type (2025-2030) 44
Table 44. Global Shower Wall Panel Sales Market Share by Type (2019-2024) 44
Table 45. Global Shower Wall Panel Sales Market Share by Type (2025-2030) 45
Table 46. Global Shower Wall Panel Revenue (US$ Million) by Type (2019-2024) 45
Table 47. Global Shower Wall Panel Revenue (US$ Million) by Type (2025-2030) 46
Table 48. Global Shower Wall Panel Revenue Market Share by Type (2019-2024) 46
Table 49. Global Shower Wall Panel Revenue Market Share by Type (2025-2030) 46
Table 50. Global Shower Wall Panel Price (US$/Sqm) by Type (2019-2024) 47
Table 51. Global Shower Wall Panel Price (US$/Sqm) by Type (2025-2030) 47
Table 52. Global Shower Wall Panel Sales (K Sqm) by Application (2019-2024) 48
Table 53. Global Shower Wall Panel Sales (K Sqm) by Application (2025-2030) 48
Table 54. Global Shower Wall Panel Sales Market Share by Application (2019-2024) 48
Table 55. Global Shower Wall Panel Sales Market Share by Application (2025-2030) 48
Table 56. Global Shower Wall Panel Revenue (US$ Million) by Application (2019-2024) 49
Table 57. Global Shower Wall Panel Revenue (US$ Million) by Application (2025-2030) 50
Table 58. Global Shower Wall Panel Revenue Market Share by Application (2019-2024) 50
Table 59. Global Shower Wall Panel Revenue Market Share by Application (2025-2030) 50
Table 60. Global Shower Wall Panel Price (US$/Sqm) by Application (2019-2024) 51
Table 61. Global Shower Wall Panel Price (US$/Sqm) by Application (2025-2030) 51
Table 62. Kronospan Company Information 52
Table 63. Kronospan Shower Wall Panel Sales (K Sqm), Revenue (US$ Million), Price (US$/Sqm) and Gross Margin (2020-2024) 52
Table 64. Kronospan Shower Wall Panel Product 53
Table 65. Power Decor Company Information 53
Table 66. Power Decor Shower Wall Panel Sales (K Sqm), Revenue (US$ Million), Price (US$/Sqm) and Gross Margin (2020-2024) 54
Table 67. Power Decor Shower Wall Panel Product 54
Table 68. Shaw Industries Group Company Information 55
Table 69. Shaw Industries Group Shower Wall Panel Sales (K Sqm), Revenue (US$ Million), Price (US$/Sqm) and Gross Margin (2020-2024) 55
Table 70. Shaw Industries Group Shower Wall Panel Product 56
Table 71. Classen Group Company Information 56
Table 72. Classen Group Shower Wall Panel Sales (K Sqm), Revenue (US$ Million), Price (US$/Sqm) and Gross Margin (2020-2024) 57
Table 73. Classen Group Shower Wall Panel Product 57
Table 74. Wilsonart Company Information 58
Table 75. Wilsonart Shower Wall Panel Sales (K Sqm), Revenue (US$ Million), Price (US$/Sqm) and Gross Margin (2020-2024) 59
Table 76. Wilsonart Shower Wall Panel Product 60
Table 77. KOHLER Company Information 60
Table 78. KOHLER Shower Wall Panel Sales (K Sqm), Revenue (US$ Million), Price (US$/Sqm) and Gross Margin (2020-2024) 61
Table 79. KOHLER Shower Wall Panel Product 62
Table 80. Swan Company Information 62
Table 81. Swan Shower Wall Panel Sales (K Sqm), Revenue (US$ Million), Price (US$/Sqm) and Gross Margin (2020-2024) 63
Table 82. Swan Shower Wall Panel Product 64
Table 83. CFL Flooring Company Information 64
Table 84. CFL Flooring Shower Wall Panel Sales (K Sqm), Revenue (US$ Million), Price (US$/Sqm) and Gross Margin (2020-2024) 65
Table 85. CFL Flooring Shower Wall Panel Product 66
Table 86. DECNO GROUP Company Information 66
Table 87. DECNO GROUP Shower Wall Panel Sales (K Sqm), Revenue (US$ Million), Price (US$/Sqm) and Gross Margin (2020-2024) 67
Table 88. DECNO GROUP Shower Wall Panel Product 68
Table 89. Bath Fitter Company Information 68
Table 90. Bath Fitter Shower Wall Panel Sales (K Sqm), Revenue (US$ Million), Price (US$/Sqm) and Gross Margin (2020-2024) 69
Table 91. Bath Fitter Shower Wall Panel Product 70
Table 92. Inpro Corporation Company Information 70
Table 93. Inpro Corporation Shower Wall Panel Sales (K Sqm), Revenue (US$ Million), Price (US$/Sqm) and Gross Margin (2020-2024) 71
Table 94. Inpro Corporation Shower Wall Panel Product 72
Table 95. MAAX Company Information 72
Table 96. MAAX Shower Wall Panel Sales (K Sqm), Revenue (US$ Million), Price (US$/Sqm) and Gross Margin (2020-2024) 73
Table 97. MAAX Shower Wall Panel Product 74
Table 98. The Onyx Collection Company Information 74
Table 99. The Onyx Collection Shower Wall Panel Sales (K Sqm), Revenue (US$ Million), Price (US$/Sqm) and Gross Margin (2020-2024) 75
Table 100. The Onyx Collection Shower Wall Panel Product 75
Table 101. MRMARBLE Company Information 76
Table 102. MRMARBLE Shower Wall Panel Sales (K Sqm), Revenue (US$ Million), Price (US$/Sqm) and Gross Margin (2020-2024) 77
Table 103. MRMARBLE Shower Wall Panel Product 77
Table 104. Polyvinyl Chloride Key Suppliers Lists 79
Table 105. Shower Wall Panel Distributors List 80
Table 106. Shower Wall Panel Customers List 80
Table 107. Shower Wall Panel Market Trends 82
Table 108. Shower Wall Panel Market Challenges 83
Table 109. Research Programs/Design for This Report 85
Table 110. Key Data Information from Secondary Sources 89
Table 111. Key Data Information from Primary Sources 90
Table 112. Authors List of This Report 91
List of Figures
Figure 1. Global Shower Wall Panel Market Value Comparison by Type (2024-2030) & (US$ Million) 2
Figure 2. Global Shower Wall Panel Market Share by Type: 2023 & 2030 2
Figure 3. PVC Panel Product Picture 3
Figure 4. Acrylic Panel Product Picture 4
Figure 5. Global Shower Wall Panel Market Value by Application (2024-2030) & (US$ Million) 5
Figure 6. Global Shower Wall Panel Market Share by Application: 2023 & 2030 6
Figure 7. Global Shower Wall Panel Revenue, (US$ Million), 2019 VS 2023 VS 2030 7
Figure 8. Global Shower Wall Panel Market Size (2019-2030) & (US$ Million) 8
Figure 9. Global Shower Wall Panel Sales (2019-2030) & (K Sqm) 8
Figure 10. Shower Wall Panel Report Years Considered 10
Figure 11. Shower Wall Panel Sales Share by Manufacturers in 2023 13
Figure 12. Global Shower Wall Panel Revenue Share by Manufacturers in 2023 15
Figure 13. Global 5 Largest Shower Wall Panel Players: Market Share by Revenue in Shower Wall Panel in 2023 19
Figure 14. Global 10 Largest Shower Wall Panel Players: Market Share by Revenue in Shower Wall Panel in 2023 19
Figure 15. United States Shower Wall Panel Revenue Growth Rate (2019-2030) & (US$ Million) 26
Figure 16. Canada Shower Wall Panel Revenue Growth Rate (2019-2030) & (US$ Million) 26
Figure 17. Mexico Shower Wall Panel Revenue Growth Rate (2019-2030) & (US$ Million) 27
Figure 18. Germany Shower Wall Panel Revenue Growth Rate (2019-2030) & (US$ Million) 29
Figure 19. France Shower Wall Panel Revenue Growth Rate (2019-2030) & (US$ Million) 29
Figure 20. U.K. Shower Wall Panel Revenue Growth Rate (2019-2030) & (US$ Million) 30
Figure 21. Italy Shower Wall Panel Revenue Growth Rate (2019-2030) & (US$ Million) 31
Figure 22. Russia Shower Wall Panel Revenue Growth Rate (2019-2030) & (US$ Million) 31
Figure 23. China Shower Wall Panel Revenue Growth Rate (2019-2030) & (US$ Million) 34
Figure 24. Japan Shower Wall Panel Revenue Growth Rate (2019-2030) & (US$ Million) 34
Figure 25. South Korea Shower Wall Panel Revenue Growth Rate (2019-2030) & (US$ Million) 35
Figure 26. India Shower Wall Panel Revenue Growth Rate (2019-2030) & (US$ Million) 36
Figure 27. Australia Shower Wall Panel Revenue Growth Rate (2019-2030) & (US$ Million) 36
Figure 28. Southeast Asia Shower Wall Panel Revenue Growth Rate (2019-2030) & (US$ Million) 37
Figure 29. Brazil Shower Wall Panel Revenue Growth Rate (2019-2030) & (US$ Million) 39
Figure 30. Argentina Shower Wall Panel Revenue Growth Rate (2019-2030) & (US$ Million) 39
Figure 31. Colombia Shower Wall Panel Revenue Growth Rate (2019-2030) & (US$ Million) 40
Figure 32. Middle East Shower Wall Panel Revenue Growth Rate (2019-2030) & (US$ Million) 42
Figure 33. Africa Shower Wall Panel Revenue Growth Rate (2019-2030) & (US$ Million) 43
Figure 34. Global Sales Market Share of Shower Wall Panel by Type (2019-2030) 45
Figure 35. Global Revenue Market Share of Shower Wall Panel by Type (2019-2030) 47
Figure 36. Global Sales Market Share of Shower Wall Panel by Application (2019-2030) 49
Figure 37. Global Revenue Market Share of Shower Wall Panel by Application (2019-2030) 51
Figure 38. Shower Wall Panel Value Chain 78
Figure 39. Bottom-up and Top-down Approaches for This Report 87
Figure 40. Data Triangulation 88
Figure 41. Key Executives Interviewed 90