List of Tables
Table 1. Global Lighting System for Surface Inspection Market Size Growth Rate by Type (US$ Million): 2020 VS 2024 VS 2031
Table 2. Key Players of Ring Lighting
Table 3. Key Players of Bar Lighting
Table 4. Key Players of Co-axial Lighting
Table 5. Key Players of Dome Lighting
Table 6. Key Players of Back Lighting
Table 7. Key Players of Other
Table 8. Global Lighting System for Surface Inspection Market Size Growth Rate by Modulation Method (US$ Million): 2020 VS 2024 VS 2031
Table 9. Key Players of Continuous Lighting
Table 10. Key Players of Strobe/Pulse Lighting
Table 11. Global Lighting System for Surface Inspection Market Size Growth Rate by Reflective Properties (US$ Million): 2020 VS 2024 VS 2031
Table 12. Key Players of Bright Field Lighting
Table 13. Key Players of Dark Field Lighting
Table 14. Key Players of Backlighting
Table 15. Global Lighting System for Surface Inspection Market Size Growth Rate by Light Wavelength (US$ Million): 2020 VS 2024 VS 2031
Table 16. Key Players of Monochromatic Lighting
Table 17. Key Players of White Light (Composite Light) Lighting
Table 18. Global Lighting System for Surface Inspection Market Size Growth by Application (US$ Million): 2020 VS 2024 VS 2031
Table 19. Global Lighting System for Surface Inspection Market Size by Region (US$ Million): 2020 VS 2024 VS 2031
Table 20. Global Lighting System for Surface Inspection Market Size by Region (2020-2025) & (US$ Million)
Table 21. Global Lighting System for Surface Inspection Market Share by Region (2020-2025)
Table 22. Global Lighting System for Surface Inspection Forecasted Market Size by Region (2026-2031) & (US$ Million)
Table 23. Global Lighting System for Surface Inspection Market Share by Region (2026-2031)
Table 24. Lighting System for Surface Inspection Market Trends
Table 25. Lighting System for Surface Inspection Market Drivers
Table 26. Lighting System for Surface Inspection Market Challenges
Table 27. Lighting System for Surface Inspection Market Restraints
Table 28. Global Lighting System for Surface Inspection Revenue by Players (2020-2025) & (US$ Million)
Table 29. Global Lighting System for Surface Inspection Market Share by Players (2020-2025)
Table 30. Global Top Lighting System for Surface Inspection Players by Company Type (Tier 1, Tier 2, and Tier 3) & (based on the Revenue in Lighting System for Surface Inspection as of 2024)
Table 31. Ranking of Global Top Lighting System for Surface Inspection Companies by Revenue (US$ Million) in 2024
Table 32. Global 5 Largest Players Market Share by Lighting System for Surface Inspection Revenue (CR5 and HHI) & (2020-2025)
Table 33. Global Key Players of Lighting System for Surface Inspection, Headquarters and Area Served
Table 34. Global Key Players of Lighting System for Surface Inspection, Product and Application
Table 35. Global Key Players of Lighting System for Surface Inspection, Date of Enter into This Industry
Table 36. Mergers & Acquisitions, Expansion Plans
Table 37. Global Lighting System for Surface Inspection Market Size by Type (2020-2025) & (US$ Million)
Table 38. Global Lighting System for Surface Inspection Revenue Market Share by Type (2020-2025)
Table 39. Global Lighting System for Surface Inspection Forecasted Market Size by Type (2026-2031) & (US$ Million)
Table 40. Global Lighting System for Surface Inspection Revenue Market Share by Type (2026-2031)
Table 41. Global Lighting System for Surface Inspection Market Size by Application (2020-2025) & (US$ Million)
Table 42. Global Lighting System for Surface Inspection Revenue Market Share by Application (2020-2025)
Table 43. Global Lighting System for Surface Inspection Forecasted Market Size by Application (2026-2031) & (US$ Million)
Table 44. Global Lighting System for Surface Inspection Revenue Market Share by Application (2026-2031)
Table 45. North America Lighting System for Surface Inspection Market Size Growth Rate by Country (US$ Million): 2020 VS 2024 VS 2031
Table 46. North America Lighting System for Surface Inspection Market Size by Country (2020-2025) & (US$ Million)
Table 47. North America Lighting System for Surface Inspection Market Size by Country (2026-2031) & (US$ Million)
Table 48. Europe Lighting System for Surface Inspection Market Size Growth Rate by Country (US$ Million): 2020 VS 2024 VS 2031
Table 49. Europe Lighting System for Surface Inspection Market Size by Country (2020-2025) & (US$ Million)
Table 50. Europe Lighting System for Surface Inspection Market Size by Country (2026-2031) & (US$ Million)
Table 51. Asia-Pacific Lighting System for Surface Inspection Market Size Growth Rate by Region (US$ Million): 2020 VS 2024 VS 2031
Table 52. Asia-Pacific Lighting System for Surface Inspection Market Size by Region (2020-2025) & (US$ Million)
Table 53. Asia-Pacific Lighting System for Surface Inspection Market Size by Region (2026-2031) & (US$ Million)
Table 54. Latin America Lighting System for Surface Inspection Market Size Growth Rate by Country (US$ Million): 2020 VS 2024 VS 2031
Table 55. Latin America Lighting System for Surface Inspection Market Size by Country (2020-2025) & (US$ Million)
Table 56. Latin America Lighting System for Surface Inspection Market Size by Country (2026-2031) & (US$ Million)
Table 57. Middle East & Africa Lighting System for Surface Inspection Market Size Growth Rate by Country (US$ Million): 2020 VS 2024 VS 2031
Table 58. Middle East & Africa Lighting System for Surface Inspection Market Size by Country (2020-2025) & (US$ Million)
Table 59. Middle East & Africa Lighting System for Surface Inspection Market Size by Country (2026-2031) & (US$ Million)
Table 60. VIRELUX Company Details
Table 61. VIRELUX Business Overview
Table 62. VIRELUX Lighting System for Surface Inspection Product
Table 63. VIRELUX Revenue in Lighting System for Surface Inspection Business (2020-2025) & (US$ Million)
Table 64. VIRELUX Recent Development
Table 65. Ludwig Leuchten Company Details
Table 66. Ludwig Leuchten Business Overview
Table 67. Ludwig Leuchten Lighting System for Surface Inspection Product
Table 68. Ludwig Leuchten Revenue in Lighting System for Surface Inspection Business (2020-2025) & (US$ Million)
Table 69. Ludwig Leuchten Recent Development
Table 70. Banner Engineering Company Details
Table 71. Banner Engineering Business Overview
Table 72. Banner Engineering Lighting System for Surface Inspection Product
Table 73. Banner Engineering Revenue in Lighting System for Surface Inspection Business (2020-2025) & (US$ Million)
Table 74. Banner Engineering Recent Development
Table 75. Wintriss Surface Inspection Company Details
Table 76. Wintriss Surface Inspection Business Overview
Table 77. Wintriss Surface Inspection Lighting System for Surface Inspection Product
Table 78. Wintriss Surface Inspection Revenue in Lighting System for Surface Inspection Business (2020-2025) & (US$ Million)
Table 79. Wintriss Surface Inspection Recent Development
Table 80. Oligo Company Details
Table 81. Oligo Business Overview
Table 82. Oligo Lighting System for Surface Inspection Product
Table 83. Oligo Revenue in Lighting System for Surface Inspection Business (2020-2025) & (US$ Million)
Table 84. Oligo Recent Development
Table 85. Jung Leuchten Company Details
Table 86. Jung Leuchten Business Overview
Table 87. Jung Leuchten Lighting System for Surface Inspection Product
Table 88. Jung Leuchten Revenue in Lighting System for Surface Inspection Business (2020-2025) & (US$ Million)
Table 89. Jung Leuchten Recent Development
Table 90. Metaphase Technologies Inc. Company Details
Table 91. Metaphase Technologies Inc. Business Overview
Table 92. Metaphase Technologies Inc. Lighting System for Surface Inspection Product
Table 93. Metaphase Technologies Inc. Revenue in Lighting System for Surface Inspection Business (2020-2025) & (US$ Million)
Table 94. Metaphase Technologies Inc. Recent Development
Table 95. Gardasoft Company Details
Table 96. Gardasoft Business Overview
Table 97. Gardasoft Lighting System for Surface Inspection Product
Table 98. Gardasoft Revenue in Lighting System for Surface Inspection Business (2020-2025) & (US$ Million)
Table 99. Gardasoft Recent Development
Table 100. Sugawara Laboratories Inc. Company Details
Table 101. Sugawara Laboratories Inc. Business Overview
Table 102. Sugawara Laboratories Inc. Lighting System for Surface Inspection Product
Table 103. Sugawara Laboratories Inc. Revenue in Lighting System for Surface Inspection Business (2020-2025) & (US$ Million)
Table 104. Sugawara Laboratories Inc. Recent Development
Table 105. OPTEX FA CO.,LTD. Company Details
Table 106. OPTEX FA CO.,LTD. Business Overview
Table 107. OPTEX FA CO.,LTD. Lighting System for Surface Inspection Product
Table 108. OPTEX FA CO.,LTD. Revenue in Lighting System for Surface Inspection Business (2020-2025) & (US$ Million)
Table 109. OPTEX FA CO.,LTD. Recent Development
Table 110. Opto Engineering Company Details
Table 111. Opto Engineering Business Overview
Table 112. Opto Engineering Lighting System for Surface Inspection Product
Table 113. Opto Engineering Revenue in Lighting System for Surface Inspection Business (2020-2025) & (US$ Million)
Table 114. Opto Engineering Recent Development
Table 115. Phlox Corp. Company Details
Table 116. Phlox Corp. Business Overview
Table 117. Phlox Corp. Lighting System for Surface Inspection Product
Table 118. Phlox Corp. Revenue in Lighting System for Surface Inspection Business (2020-2025) & (US$ Million)
Table 119. Phlox Corp. Recent Development
Table 120. Smart Vision Lights Company Details
Table 121. Smart Vision Lights Business Overview
Table 122. Smart Vision Lights Lighting System for Surface Inspection Product
Table 123. Smart Vision Lights Revenue in Lighting System for Surface Inspection Business (2020-2025) & (US$ Million)
Table 124. Smart Vision Lights Recent Development
Table 125. ADVANCED ILLUMINATION Company Details
Table 126. ADVANCED ILLUMINATION Business Overview
Table 127. ADVANCED ILLUMINATION Lighting System for Surface Inspection Product
Table 128. ADVANCED ILLUMINATION Revenue in Lighting System for Surface Inspection Business (2020-2025) & (US$ Million)
Table 129. ADVANCED ILLUMINATION Recent Development
Table 130. KEYENCE Company Details
Table 131. KEYENCE Business Overview
Table 132. KEYENCE Lighting System for Surface Inspection Product
Table 133. KEYENCE Revenue in Lighting System for Surface Inspection Business (2020-2025) & (US$ Million)
Table 134. KEYENCE Recent Development
Table 135. STEMMER IMAGING AG Company Details
Table 136. STEMMER IMAGING AG Business Overview
Table 137. STEMMER IMAGING AG Lighting System for Surface Inspection Product
Table 138. STEMMER IMAGING AG Revenue in Lighting System for Surface Inspection Business (2020-2025) & (US$ Million)
Table 139. STEMMER IMAGING AG Recent Development
Table 140. Vital Vision Technology Pte Ltd Company Details
Table 141. Vital Vision Technology Pte Ltd Business Overview
Table 142. Vital Vision Technology Pte Ltd Lighting System for Surface Inspection Product
Table 143. Vital Vision Technology Pte Ltd Revenue in Lighting System for Surface Inspection Business (2020-2025) & (US$ Million)
Table 144. Vital Vision Technology Pte Ltd Recent Development
Table 145. Spectrum Illumination Company Details
Table 146. Spectrum Illumination Business Overview
Table 147. Spectrum Illumination Lighting System for Surface Inspection Product
Table 148. Spectrum Illumination Revenue in Lighting System for Surface Inspection Business (2020-2025) & (US$ Million)
Table 149. Spectrum Illumination Recent Development
Table 150. CCS Inc. Company Details
Table 151. CCS Inc. Business Overview
Table 152. CCS Inc. Lighting System for Surface Inspection Product
Table 153. CCS Inc. Revenue in Lighting System for Surface Inspection Business (2020-2025) & (US$ Million)
Table 154. CCS Inc. Recent Development
Table 155. LOTS Company Details
Table 156. LOTS Business Overview
Table 157. LOTS Lighting System for Surface Inspection Product
Table 158. LOTS Revenue in Lighting System for Surface Inspection Business (2020-2025) & (US$ Million)
Table 159. LOTS Recent Development
Table 160. Cognex Company Details
Table 161. Cognex Business Overview
Table 162. Cognex Lighting System for Surface Inspection Product
Table 163. Cognex Revenue in Lighting System for Surface Inspection Business (2020-2025) & (US$ Million)
Table 164. Cognex Recent Development
Table 165. ProPhotonix Company Details
Table 166. ProPhotonix Business Overview
Table 167. ProPhotonix Lighting System for Surface Inspection Product
Table 168. ProPhotonix Revenue in Lighting System for Surface Inspection Business (2020-2025) & (US$ Million)
Table 169. ProPhotonix Recent Development
Table 170. Research Programs/Design for This Report
Table 171. Key Data Information from Secondary Sources
Table 172. Key Data Information from Primary Sources
Table 173. Authors List of This Report
List of Figures
Figure 1. Lighting System for Surface Inspection Picture
Figure 2. Global Lighting System for Surface Inspection Market Size Comparison by Type (2020-2031) & (US$ Million)
Figure 3. Global Lighting System for Surface Inspection Market Share by Type: 2024 VS 2031
Figure 4. Ring Lighting Features
Figure 5. Bar Lighting Features
Figure 6. Co-axial Lighting Features
Figure 7. Dome Lighting Features
Figure 8. Back Lighting Features
Figure 9. Other Features
Figure 10. Global Lighting System for Surface Inspection Market Size Comparison by Modulation Method (2020-2031) & (US$ Million)
Figure 11. Continuous Lighting Features
Figure 12. Strobe/Pulse Lighting Features
Figure 13. Global Lighting System for Surface Inspection Market Size Comparison by Reflective Properties (2020-2031) & (US$ Million)
Figure 14. Bright Field Lighting Features
Figure 15. Dark Field Lighting Features
Figure 16. Backlighting Features
Figure 17. Global Lighting System for Surface Inspection Market Size Comparison by Light Wavelength (2020-2031) & (US$ Million)
Figure 18. Monochromatic Lighting Features
Figure 19. White Light (Composite Light) Lighting Features
Figure 20. Global Lighting System for Surface Inspection Market Size by Application (2020-2031) & (US$ Million)
Figure 21. Global Lighting System for Surface Inspection Market Share by Application: 2024 VS 2031
Figure 22. Automotive Case Studies
Figure 23. Aerospace Case Studies
Figure 24. Household Electrical Appliances Case Studies
Figure 25. Electronics and Semiconductors Case Studies
Figure 26. Other Case Studies
Figure 27. Lighting System for Surface Inspection Report Years Considered
Figure 28. Global Lighting System for Surface Inspection Market Size (US$ Million), Year-over-Year: 2020-2031
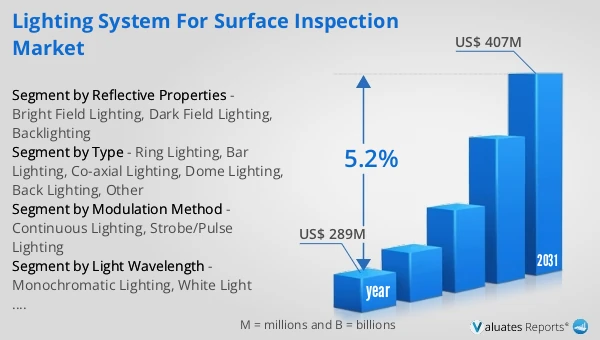
Figure 29. Global Lighting System for Surface Inspection Market Size, (US$ Million), 2020 VS 2024 VS 2031
Figure 30. Global Lighting System for Surface Inspection Market Share by Region: 2024 VS 2031
Figure 31. Global Lighting System for Surface Inspection Market Share by Players in 2024
Figure 32. Global Lighting System for Surface Inspection Market Share by Company Type (Tier 1, Tier 2, and Tier 3)
Figure 33. The Top 10 and 5 Players Market Share by Lighting System for Surface Inspection Revenue in 2024
Figure 34. North America Lighting System for Surface Inspection Market Size YoY Growth (2020-2031) & (US$ Million)
Figure 35. North America Lighting System for Surface Inspection Market Share by Country (2020-2031)
Figure 36. United States Lighting System for Surface Inspection Market Size YoY Growth (2020-2031) & (US$ Million)
Figure 37. Canada Lighting System for Surface Inspection Market Size YoY Growth (2020-2031) & (US$ Million)
Figure 38. Europe Lighting System for Surface Inspection Market Size YoY Growth (2020-2031) & (US$ Million)
Figure 39. Europe Lighting System for Surface Inspection Market Share by Country (2020-2031)
Figure 40. Germany Lighting System for Surface Inspection Market Size YoY Growth (2020-2031) & (US$ Million)
Figure 41. France Lighting System for Surface Inspection Market Size YoY Growth (2020-2031) & (US$ Million)
Figure 42. U.K. Lighting System for Surface Inspection Market Size YoY Growth (2020-2031) & (US$ Million)
Figure 43. Italy Lighting System for Surface Inspection Market Size YoY Growth (2020-2031) & (US$ Million)
Figure 44. Russia Lighting System for Surface Inspection Market Size YoY Growth (2020-2031) & (US$ Million)
Figure 45. Ireland Lighting System for Surface Inspection Market Size YoY Growth (2020-2031) & (US$ Million)
Figure 46. Asia-Pacific Lighting System for Surface Inspection Market Size YoY Growth (2020-2031) & (US$ Million)
Figure 47. Asia-Pacific Lighting System for Surface Inspection Market Share by Region (2020-2031)
Figure 48. China Lighting System for Surface Inspection Market Size YoY Growth (2020-2031) & (US$ Million)
Figure 49. Japan Lighting System for Surface Inspection Market Size YoY Growth (2020-2031) & (US$ Million)
Figure 50. South Korea Lighting System for Surface Inspection Market Size YoY Growth (2020-2031) & (US$ Million)
Figure 51. Southeast Asia Lighting System for Surface Inspection Market Size YoY Growth (2020-2031) & (US$ Million)
Figure 52. India Lighting System for Surface Inspection Market Size YoY Growth (2020-2031) & (US$ Million)
Figure 53. Australia & New Zealand Lighting System for Surface Inspection Market Size YoY Growth (2020-2031) & (US$ Million)
Figure 54. Latin America Lighting System for Surface Inspection Market Size YoY Growth (2020-2031) & (US$ Million)
Figure 55. Latin America Lighting System for Surface Inspection Market Share by Country (2020-2031)
Figure 56. Mexico Lighting System for Surface Inspection Market Size YoY Growth (2020-2031) & (US$ Million)
Figure 57. Brazil Lighting System for Surface Inspection Market Size YoY Growth (2020-2031) & (US$ Million)
Figure 58. Middle East & Africa Lighting System for Surface Inspection Market Size YoY Growth (2020-2031) & (US$ Million)
Figure 59. Middle East & Africa Lighting System for Surface Inspection Market Share by Country (2020-2031)
Figure 60. Israel Lighting System for Surface Inspection Market Size YoY Growth (2020-2031) & (US$ Million)
Figure 61. Saudi Arabia Lighting System for Surface Inspection Market Size YoY Growth (2020-2031) & (US$ Million)
Figure 62. UAE Lighting System for Surface Inspection Market Size YoY Growth (2020-2031) & (US$ Million)
Figure 63. VIRELUX Revenue Growth Rate in Lighting System for Surface Inspection Business (2020-2025)
Figure 64. Ludwig Leuchten Revenue Growth Rate in Lighting System for Surface Inspection Business (2020-2025)
Figure 65. Banner Engineering Revenue Growth Rate in Lighting System for Surface Inspection Business (2020-2025)
Figure 66. Wintriss Surface Inspection Revenue Growth Rate in Lighting System for Surface Inspection Business (2020-2025)
Figure 67. Oligo Revenue Growth Rate in Lighting System for Surface Inspection Business (2020-2025)
Figure 68. Jung Leuchten Revenue Growth Rate in Lighting System for Surface Inspection Business (2020-2025)
Figure 69. Metaphase Technologies Inc. Revenue Growth Rate in Lighting System for Surface Inspection Business (2020-2025)
Figure 70. Gardasoft Revenue Growth Rate in Lighting System for Surface Inspection Business (2020-2025)
Figure 71. Sugawara Laboratories Inc. Revenue Growth Rate in Lighting System for Surface Inspection Business (2020-2025)
Figure 72. OPTEX FA CO.,LTD. Revenue Growth Rate in Lighting System for Surface Inspection Business (2020-2025)
Figure 73. Opto Engineering Revenue Growth Rate in Lighting System for Surface Inspection Business (2020-2025)
Figure 74. Phlox Corp. Revenue Growth Rate in Lighting System for Surface Inspection Business (2020-2025)
Figure 75. Smart Vision Lights Revenue Growth Rate in Lighting System for Surface Inspection Business (2020-2025)
Figure 76. ADVANCED ILLUMINATION Revenue Growth Rate in Lighting System for Surface Inspection Business (2020-2025)
Figure 77. KEYENCE Revenue Growth Rate in Lighting System for Surface Inspection Business (2020-2025)
Figure 78. STEMMER IMAGING AG Revenue Growth Rate in Lighting System for Surface Inspection Business (2020-2025)
Figure 79. Vital Vision Technology Pte Ltd Revenue Growth Rate in Lighting System for Surface Inspection Business (2020-2025)
Figure 80. Spectrum Illumination Revenue Growth Rate in Lighting System for Surface Inspection Business (2020-2025)
Figure 81. CCS Inc. Revenue Growth Rate in Lighting System for Surface Inspection Business (2020-2025)
Figure 82. LOTS Revenue Growth Rate in Lighting System for Surface Inspection Business (2020-2025)
Figure 83. Cognex Revenue Growth Rate in Lighting System for Surface Inspection Business (2020-2025)
Figure 84. ProPhotonix Revenue Growth Rate in Lighting System for Surface Inspection Business (2020-2025)
Figure 85. Bottom-up and Top-down Approaches for This Report
Figure 86. Data Triangulation
Figure 87. Key Executives Interviewed