List of Tables
Table 1. Global Rotating Equipment Repair Market Size Growth Rate by Type (US$ Million): 2021 vs 2025 vs 2032
Table 2. Key Players of Pump Repair
Table 3. Key Players of Compressor Repair
Table 4. Key Players of Turbine Repair
Table 5. Key Players of Motor Repair
Table 6. Key Players of Others
Table 7. Global Rotating Equipment Repair Market Size Growth by Application (US$ Million): 2021 vs 2025 vs 2032
Table 8. Global Rotating Equipment Repair Market Size by Region (US$ Million): 2021 vs 2025 vs 2032
Table 9. Global Rotating Equipment Repair Market Size by Region (US$ Million), 2021–2026
Table 10. Global Rotating Equipment Repair Market Share by Region (2021–2026)
Table 11. Global Rotating Equipment Repair Forecasted Market Size by Region (US$ Million), 2027–2032
Table 12. Global Rotating Equipment Repair Market Share by Region (2027–2032)
Table 13. Rotating Equipment Repair Market Trends
Table 14. Rotating Equipment Repair Market Drivers
Table 15. Rotating Equipment Repair Market Challenges
Table 16. Rotating Equipment Repair Market Restraints
Table 17. Global Rotating Equipment Repair Revenue by Players (US$ Million), 2021–2026
Table 18. Global Rotating Equipment Repair Market Share by Players (2021–2026)
Table 19. Global Top Rotating Equipment Repair Players by Tier (Tier 1, Tier 2, and Tier 3), based on Rotating Equipment Repair Revenue, 2025
Table 20. Ranking of Global Top Rotating Equipment Repair Companies by Revenue (US$ Million) in 2025
Table 21. Global 5 Largest Players Market Share by Rotating Equipment Repair Revenue (CR5 and HHI), 2021–2026
Table 22. Global Key Players of Rotating Equipment Repair, Headquarters and Area Served
Table 23. Global Key Players of Rotating Equipment Repair, Products and Applications
Table 24. Global Key Players of Rotating Equipment Repair, Date of General Availability (GA)
Table 25. Mergers and Acquisitions, Expansion Plans
Table 26. Global Rotating Equipment Repair Market Size by Type (US$ Million), 2021–2026
Table 27. Global Rotating Equipment Repair Revenue Market Share by Type (2021–2026)
Table 28. Global Rotating Equipment Repair Forecasted Market Size by Type (US$ Million), 2027–2032
Table 29. Global Rotating Equipment Repair Revenue Market Share by Type (2027–2032)
Table 30. Global Rotating Equipment Repair Market Size by Application (US$ Million), 2021–2026
Table 31. Global Rotating Equipment Repair Revenue Market Share by Application (2021–2026)
Table 32. Global Rotating Equipment Repair Forecasted Market Size by Application (US$ Million), 2027–2032
Table 33. Global Rotating Equipment Repair Revenue Market Share by Application (2027–2032)
Table 34. North America Rotating Equipment Repair Market Size Growth Rate by Country (US$ Million): 2021 vs 2025 vs 2032
Table 35. North America Rotating Equipment Repair Market Size by Country (US$ Million), 2021–2026
Table 36. North America Rotating Equipment Repair Market Size by Country (US$ Million), 2027–2032
Table 37. Europe Rotating Equipment Repair Market Size Growth Rate by Country (US$ Million): 2021 vs 2025 vs 2032
Table 38. Europe Rotating Equipment Repair Market Size by Country (US$ Million), 2021–2026
Table 39. Europe Rotating Equipment Repair Market Size by Country (US$ Million), 2027–2032
Table 40. Asia-Pacific Rotating Equipment Repair Market Size Growth Rate by Region (US$ Million): 2021 vs 2025 vs 2032
Table 41. Asia-Pacific Rotating Equipment Repair Market Size by Region (US$ Million), 2021–2026
Table 42. Asia-Pacific Rotating Equipment Repair Market Size by Region (US$ Million), 2027–2032
Table 43. Latin America Rotating Equipment Repair Market Size Growth Rate by Country (US$ Million): 2021 vs 2025 vs 2032
Table 44. Latin America Rotating Equipment Repair Market Size by Country (US$ Million), 2021–2026
Table 45. Latin America Rotating Equipment Repair Market Size by Country (US$ Million), 2027–2032
Table 46. Middle East & Africa Rotating Equipment Repair Market Size Growth Rate by Country (US$ Million): 2021 vs 2025 vs 2032
Table 47. Middle East & Africa Rotating Equipment Repair Market Size by Country (US$ Million), 2021–2026
Table 48. Middle East & Africa Rotating Equipment Repair Market Size by Country (US$ Million), 2027–2032
Table 49. Siemens Company Details
Table 50. Siemens Business Overview
Table 51. Siemens Rotating Equipment Repair Product
Table 52. Siemens Revenue in Rotating Equipment Repair Business (US$ Million), 2021–2026
Table 53. Siemens Recent Development
Table 54. General Electric Company Details
Table 55. General Electric Business Overview
Table 56. General Electric Rotating Equipment Repair Product
Table 57. General Electric Revenue in Rotating Equipment Repair Business (US$ Million), 2021–2026
Table 58. General Electric Recent Development
Table 59. Sulzer Company Details
Table 60. Sulzer Business Overview
Table 61. Sulzer Rotating Equipment Repair Product
Table 62. Sulzer Revenue in Rotating Equipment Repair Business (US$ Million), 2021–2026
Table 63. Sulzer Recent Development
Table 64. MAN Energy Solutions Company Details
Table 65. MAN Energy Solutions Business Overview
Table 66. MAN Energy Solutions Rotating Equipment Repair Product
Table 67. MAN Energy Solutions Revenue in Rotating Equipment Repair Business (US$ Million), 2021–2026
Table 68. MAN Energy Solutions Recent Development
Table 69. Mitsubishi Hitachi Power Systems Company Details
Table 70. Mitsubishi Hitachi Power Systems Business Overview
Table 71. Mitsubishi Hitachi Power Systems Rotating Equipment Repair Product
Table 72. Mitsubishi Hitachi Power Systems Revenue in Rotating Equipment Repair Business (US$ Million), 2021–2026
Table 73. Mitsubishi Hitachi Power Systems Recent Development
Table 74. Ansaldo Energia Company Details
Table 75. Ansaldo Energia Business Overview
Table 76. Ansaldo Energia Rotating Equipment Repair Product
Table 77. Ansaldo Energia Revenue in Rotating Equipment Repair Business (US$ Million), 2021–2026
Table 78. Ansaldo Energia Recent Development
Table 79. KSB Company Details
Table 80. KSB Business Overview
Table 81. KSB Rotating Equipment Repair Product
Table 82. KSB Revenue in Rotating Equipment Repair Business (US$ Million), 2021–2026
Table 83. KSB Recent Development
Table 84. ABB Company Details
Table 85. ABB Business Overview
Table 86. ABB Rotating Equipment Repair Product
Table 87. ABB Revenue in Rotating Equipment Repair Business (US$ Million), 2021–2026
Table 88. ABB Recent Development
Table 89. Dongfang Turbine Company Details
Table 90. Dongfang Turbine Business Overview
Table 91. Dongfang Turbine Rotating Equipment Repair Product
Table 92. Dongfang Turbine Revenue in Rotating Equipment Repair Business (US$ Million), 2021–2026
Table 93. Dongfang Turbine Recent Development
Table 94. Grundfos Company Details
Table 95. Grundfos Business Overview
Table 96. Grundfos Rotating Equipment Repair Product
Table 97. Grundfos Revenue in Rotating Equipment Repair Business (US$ Million), 2021–2026
Table 98. Grundfos Recent Development
Table 99. Shanghai Electric Company Details
Table 100. Shanghai Electric Business Overview
Table 101. Shanghai Electric Rotating Equipment Repair Product
Table 102. Shanghai Electric Revenue in Rotating Equipment Repair Business (US$ Million), 2021–2026
Table 103. Shanghai Electric Recent Development
Table 104. Elliot Group Company Details
Table 105. Elliot Group Business Overview
Table 106. Elliot Group Rotating Equipment Repair Product
Table 107. Elliot Group Revenue in Rotating Equipment Repair Business (US$ Million), 2021–2026
Table 108. Elliot Group Recent Development
Table 109. Atlas Copco Company Details
Table 110. Atlas Copco Business Overview
Table 111. Atlas Copco Rotating Equipment Repair Product
Table 112. Atlas Copco Revenue in Rotating Equipment Repair Business (US$ Million), 2021–2026
Table 113. Atlas Copco Recent Development
Table 114. Arcline Company Details
Table 115. Arcline Business Overview
Table 116. Arcline Rotating Equipment Repair Product
Table 117. Arcline Revenue in Rotating Equipment Repair Business (US$ Million), 2021–2026
Table 118. Arcline Recent Development
Table 119. Wolong Company Details
Table 120. Wolong Business Overview
Table 121. Wolong Rotating Equipment Repair Product
Table 122. Wolong Revenue in Rotating Equipment Repair Business (US$ Million), 2021–2026
Table 123. Wolong Recent Development
Table 124. EthosEnergy Company Details
Table 125. EthosEnergy Business Overview
Table 126. EthosEnergy Rotating Equipment Repair Product
Table 127. EthosEnergy Revenue in Rotating Equipment Repair Business (US$ Million), 2021–2026
Table 128. EthosEnergy Recent Development
Table 129. Kawasaki Heavy Industries Company Details
Table 130. Kawasaki Heavy Industries Business Overview
Table 131. Kawasaki Heavy Industries Rotating Equipment Repair Product
Table 132. Kawasaki Heavy Industries Revenue in Rotating Equipment Repair Business (US$ Million), 2021–2026
Table 133. Kawasaki Heavy Industries Recent Development
Table 134. Toshiba Energy Systems & Solutions Corporation Company Details
Table 135. Toshiba Energy Systems & Solutions Corporation Business Overview
Table 136. Toshiba Energy Systems & Solutions Corporation Rotating Equipment Repair Product
Table 137. Toshiba Energy Systems & Solutions Corporation Revenue in Rotating Equipment Repair Business (US$ Million), 2021–2026
Table 138. Toshiba Energy Systems & Solutions Corporation Recent Development
Table 139. Stork Company Details
Table 140. Stork Business Overview
Table 141. Stork Rotating Equipment Repair Product
Table 142. Stork Revenue in Rotating Equipment Repair Business (US$ Million), 2021–2026
Table 143. Stork Recent Development
Table 144. Hangzhou Steam Turbine Company Details
Table 145. Hangzhou Steam Turbine Business Overview
Table 146. Hangzhou Steam Turbine Rotating Equipment Repair Product
Table 147. Hangzhou Steam Turbine Revenue in Rotating Equipment Repair Business (US$ Million), 2021–2026
Table 148. Hangzhou Steam Turbine Recent Development
Table 149. Flowserve Company Details
Table 150. Flowserve Business Overview
Table 151. Flowserve Rotating Equipment Repair Product
Table 152. Flowserve Revenue in Rotating Equipment Repair Business (US$ Million), 2021–2026
Table 153. Flowserve Recent Development
Table 154. Kobelco Company Details
Table 155. Kobelco Business Overview
Table 156. Kobelco Rotating Equipment Repair Product
Table 157. Kobelco Revenue in Rotating Equipment Repair Business (US$ Million), 2021–2026
Table 158. Kobelco Recent Development
Table 159. Howden Company Details
Table 160. Howden Business Overview
Table 161. Howden Rotating Equipment Repair Product
Table 162. Howden Revenue in Rotating Equipment Repair Business (US$ Million), 2021–2026
Table 163. Howden Recent Development
Table 164. Conhagen Rotating Equipment Specialists Company Details
Table 165. Conhagen Rotating Equipment Specialists Business Overview
Table 166. Conhagen Rotating Equipment Specialists Rotating Equipment Repair Product
Table 167. Conhagen Rotating Equipment Specialists Revenue in Rotating Equipment Repair Business (US$ Million), 2021–2026
Table 168. Conhagen Rotating Equipment Specialists Recent Development
Table 169. Houghton International Company Details
Table 170. Houghton International Business Overview
Table 171. Houghton International Rotating Equipment Repair Product
Table 172. Houghton International Revenue in Rotating Equipment Repair Business (US$ Million), 2021–2026
Table 173. Houghton International Recent Development
Table 174. Research Programs/Design for This Report
Table 175. Key Data Information from Secondary Sources
Table 176. Key Data Information from Primary Sources
Table 177. Authors List of This Report
List of Figures
Figure 1. Rotating Equipment Repair Picture
Figure 2. Global Rotating Equipment Repair Market Size Comparison by Type (US$ Million), 2021–2032
Figure 3. Global Rotating Equipment Repair Market Share by Type: 2025 vs 2032
Figure 4. Pump Repair Features
Figure 5. Compressor Repair Features
Figure 6. Turbine Repair Features
Figure 7. Motor Repair Features
Figure 8. Others Features
Figure 9. Global Rotating Equipment Repair Market Size by Application (US$ Million), 2021–2032
Figure 10. Global Rotating Equipment Repair Market Share by Application: 2025 vs 2032
Figure 11. Oil & Gas Case Studies
Figure 12. Power Generation Case Studies
Figure 13. Mining Case Studies
Figure 14. Others Case Studies
Figure 15. Rotating Equipment Repair Report Years Considered
Figure 16. Global Rotating Equipment Repair Market Size (US$ Million), Year-over-Year: 2021–2032
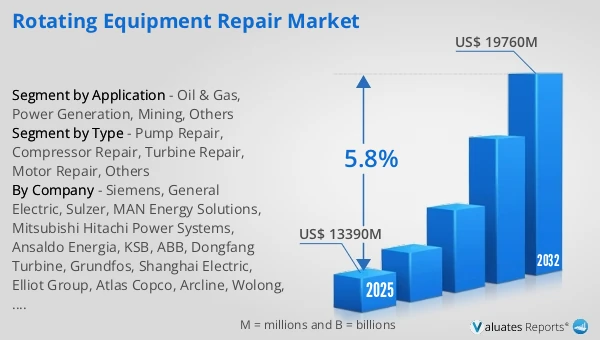
Figure 17. Global Rotating Equipment Repair Market Size, (US$ Million), 2021 vs 2025 vs 2032
Figure 18. Global Rotating Equipment Repair Market Share by Region: 2025 vs 2032
Figure 19. Global Rotating Equipment Repair Market Share by Players in 2025
Figure 20. Global Rotating Equipment Repair Market Share by Company Type (Tier 1, Tier 2, and Tier 3)
Figure 21. The Top 10 and 5 Players Market Share by Rotating Equipment Repair Revenue in 2025
Figure 22. North America Rotating Equipment Repair Market Size YoY Growth (US$ Million), 2021–2032
Figure 23. North America Rotating Equipment Repair Market Share by Country (2021–2032)
Figure 24. United States Rotating Equipment Repair Market Size YoY Growth (US$ Million), 2021–2032
Figure 25. Canada Rotating Equipment Repair Market Size YoY Growth (US$ Million), 2021–2032
Figure 26. Europe Rotating Equipment Repair Market Size YoY Growth (US$ Million), 2021–2032
Figure 27. Europe Rotating Equipment Repair Market Share by Country (2021–2032)
Figure 28. Germany Rotating Equipment Repair Market Size YoY Growth (US$ Million), 2021–2032
Figure 29. France Rotating Equipment Repair Market Size YoY Growth (US$ Million), 2021–2032
Figure 30. U.K. Rotating Equipment Repair Market Size YoY Growth (US$ Million), 2021–2032
Figure 31. Italy Rotating Equipment Repair Market Size YoY Growth (US$ Million), 2021–2032
Figure 32. Russia Rotating Equipment Repair Market Size YoY Growth (US$ Million), 2021–2032
Figure 33. Ireland Rotating Equipment Repair Market Size YoY Growth (US$ Million), 2021–2032
Figure 34. Asia-Pacific Rotating Equipment Repair Market Size YoY Growth (US$ Million), 2021–2032
Figure 35. Asia-Pacific Rotating Equipment Repair Market Share by Region (2021–2032)
Figure 36. China Rotating Equipment Repair Market Size YoY Growth (US$ Million), 2021–2032
Figure 37. Japan Rotating Equipment Repair Market Size YoY Growth (US$ Million), 2021–2032
Figure 38. South Korea Rotating Equipment Repair Market Size YoY Growth (US$ Million), 2021–2032
Figure 39. Southeast Asia Rotating Equipment Repair Market Size YoY Growth (US$ Million), 2021–2032
Figure 40. India Rotating Equipment Repair Market Size YoY Growth (US$ Million), 2021–2032
Figure 41. Australia & New Zealand Rotating Equipment Repair Market Size YoY Growth (US$ Million), 2021–2032
Figure 42. Latin America Rotating Equipment Repair Market Size YoY Growth (US$ Million), 2021–2032
Figure 43. Latin America Rotating Equipment Repair Market Share by Country (2021–2032)
Figure 44. Mexico Rotating Equipment Repair Market Size YoY Growth (US$ Million), 2021–2032
Figure 45. Brazil Rotating Equipment Repair Market Size YoY Growth (US$ Million), 2021–2032
Figure 46. Middle East & Africa Rotating Equipment Repair Market Size YoY Growth (US$ Million), 2021–2032
Figure 47. Middle East & Africa Rotating Equipment Repair Market Share by Country (2021–2032)
Figure 48. Israel Rotating Equipment Repair Market Size YoY Growth (US$ Million), 2021–2032
Figure 49. Saudi Arabia Rotating Equipment Repair Market Size YoY Growth (US$ Million), 2021–2032
Figure 50. UAE Rotating Equipment Repair Market Size YoY Growth (US$ Million), 2021–2032
Figure 51. Siemens Revenue Growth Rate in Rotating Equipment Repair Business (2021–2026)
Figure 52. General Electric Revenue Growth Rate in Rotating Equipment Repair Business (2021–2026)
Figure 53. Sulzer Revenue Growth Rate in Rotating Equipment Repair Business (2021–2026)
Figure 54. MAN Energy Solutions Revenue Growth Rate in Rotating Equipment Repair Business (2021–2026)
Figure 55. Mitsubishi Hitachi Power Systems Revenue Growth Rate in Rotating Equipment Repair Business (2021–2026)
Figure 56. Ansaldo Energia Revenue Growth Rate in Rotating Equipment Repair Business (2021–2026)
Figure 57. KSB Revenue Growth Rate in Rotating Equipment Repair Business (2021–2026)
Figure 58. ABB Revenue Growth Rate in Rotating Equipment Repair Business (2021–2026)
Figure 59. Dongfang Turbine Revenue Growth Rate in Rotating Equipment Repair Business (2021–2026)
Figure 60. Grundfos Revenue Growth Rate in Rotating Equipment Repair Business (2021–2026)
Figure 61. Shanghai Electric Revenue Growth Rate in Rotating Equipment Repair Business (2021–2026)
Figure 62. Elliot Group Revenue Growth Rate in Rotating Equipment Repair Business (2021–2026)
Figure 63. Atlas Copco Revenue Growth Rate in Rotating Equipment Repair Business (2021–2026)
Figure 64. Arcline Revenue Growth Rate in Rotating Equipment Repair Business (2021–2026)
Figure 65. Wolong Revenue Growth Rate in Rotating Equipment Repair Business (2021–2026)
Figure 66. EthosEnergy Revenue Growth Rate in Rotating Equipment Repair Business (2021–2026)
Figure 67. Kawasaki Heavy Industries Revenue Growth Rate in Rotating Equipment Repair Business (2021–2026)
Figure 68. Toshiba Energy Systems & Solutions Corporation Revenue Growth Rate in Rotating Equipment Repair Business (2021–2026)
Figure 69. Stork Revenue Growth Rate in Rotating Equipment Repair Business (2021–2026)
Figure 70. Hangzhou Steam Turbine Revenue Growth Rate in Rotating Equipment Repair Business (2021–2026)
Figure 71. Flowserve Revenue Growth Rate in Rotating Equipment Repair Business (2021–2026)
Figure 72. Kobelco Revenue Growth Rate in Rotating Equipment Repair Business (2021–2026)
Figure 73. Howden Revenue Growth Rate in Rotating Equipment Repair Business (2021–2026)
Figure 74. Conhagen Rotating Equipment Specialists Revenue Growth Rate in Rotating Equipment Repair Business (2021–2026)
Figure 75. Houghton International Revenue Growth Rate in Rotating Equipment Repair Business (2021–2026)
Figure 76. Bottom-up and Top-down Approaches for This Report
Figure 77. Data Triangulation
Figure 78. Key Executives Interviewed