List of Tables
Table 1. Global Shallow Water Decommissioning Service Market Size Growth Rate by Type (US$ Million): 2021 vs 2025 vs 2032
Table 2. Key Players of Well Plugging and Abandonment
Table 3. Key Players of Conductor Removal
Table 4. Key Players of Mobilization and Demobilization of Derrick Barges
Table 5. Key Players of Platform Removal
Table 6. Key Players of Pipeline and Power Cable Decommissioning
Table 7. Key Players of Materials Disposal
Table 8. Global Shallow Water Decommissioning Service Market Size Growth Rate by Disposal Methods (US$ Million): 2021 vs 2025 vs 2032
Table 9. Key Players of Complete Removal
Table 10. Key Players of Partial Removal
Table 11. Key Players of On-Site Conversion
Table 12. Key Players of Relocation to Another Location
Table 13. Key Players of Others
Table 14. Global Shallow Water Decommissioning Service Market Size Growth Rate by Facilities (US$ Million): 2021 vs 2025 vs 2032
Table 15. Key Players of Fixed Platforms Decommissioning
Table 16. Key Players of Pipelines and Wellhead Facilities Decommissioning
Table 17. Key Players of Auxiliary Facilities Decommissioning
Table 18. Key Players of Others
Table 19. Global Shallow Water Decommissioning Service Market Size Growth by Application (US$ Million): 2021 vs 2025 vs 2032
Table 20. Global Shallow Water Decommissioning Service Market Size by Region (US$ Million): 2021 vs 2025 vs 2032
Table 21. Global Shallow Water Decommissioning Service Market Size by Region (US$ Million), 2021–2026
Table 22. Global Shallow Water Decommissioning Service Market Share by Region (2021–2026)
Table 23. Global Shallow Water Decommissioning Service Forecasted Market Size by Region (US$ Million), 2027–2032
Table 24. Global Shallow Water Decommissioning Service Market Share by Region (2027–2032)
Table 25. Shallow Water Decommissioning Service Market Trends
Table 26. Shallow Water Decommissioning Service Market Drivers
Table 27. Shallow Water Decommissioning Service Market Challenges
Table 28. Shallow Water Decommissioning Service Market Restraints
Table 29. Global Shallow Water Decommissioning Service Revenue by Players (US$ Million), 2021–2026
Table 30. Global Shallow Water Decommissioning Service Market Share by Players (2021–2026)
Table 31. Global Top Shallow Water Decommissioning Service Players by Tier (Tier 1, Tier 2, and Tier 3), based on Shallow Water Decommissioning Service Revenue, 2025
Table 32. Ranking of Global Top Shallow Water Decommissioning Service Companies by Revenue (US$ Million) in 2025
Table 33. Global 5 Largest Players Market Share by Shallow Water Decommissioning Service Revenue (CR5 and HHI), 2021–2026
Table 34. Global Key Players of Shallow Water Decommissioning Service, Headquarters and Area Served
Table 35. Global Key Players of Shallow Water Decommissioning Service, Products and Applications
Table 36. Global Key Players of Shallow Water Decommissioning Service, Date of General Availability (GA)
Table 37. Mergers and Acquisitions, Expansion Plans
Table 38. Global Shallow Water Decommissioning Service Market Size by Type (US$ Million), 2021–2026
Table 39. Global Shallow Water Decommissioning Service Revenue Market Share by Type (2021–2026)
Table 40. Global Shallow Water Decommissioning Service Forecasted Market Size by Type (US$ Million), 2027–2032
Table 41. Global Shallow Water Decommissioning Service Revenue Market Share by Type (2027–2032)
Table 42. Global Shallow Water Decommissioning Service Market Size by Application (US$ Million), 2021–2026
Table 43. Global Shallow Water Decommissioning Service Revenue Market Share by Application (2021–2026)
Table 44. Global Shallow Water Decommissioning Service Forecasted Market Size by Application (US$ Million), 2027–2032
Table 45. Global Shallow Water Decommissioning Service Revenue Market Share by Application (2027–2032)
Table 46. North America Shallow Water Decommissioning Service Market Size Growth Rate by Country (US$ Million): 2021 vs 2025 vs 2032
Table 47. North America Shallow Water Decommissioning Service Market Size by Country (US$ Million), 2021–2026
Table 48. North America Shallow Water Decommissioning Service Market Size by Country (US$ Million), 2027–2032
Table 49. Europe Shallow Water Decommissioning Service Market Size Growth Rate by Country (US$ Million): 2021 vs 2025 vs 2032
Table 50. Europe Shallow Water Decommissioning Service Market Size by Country (US$ Million), 2021–2026
Table 51. Europe Shallow Water Decommissioning Service Market Size by Country (US$ Million), 2027–2032
Table 52. Asia-Pacific Shallow Water Decommissioning Service Market Size Growth Rate by Region (US$ Million): 2021 vs 2025 vs 2032
Table 53. Asia-Pacific Shallow Water Decommissioning Service Market Size by Region (US$ Million), 2021–2026
Table 54. Asia-Pacific Shallow Water Decommissioning Service Market Size by Region (US$ Million), 2027–2032
Table 55. Latin America Shallow Water Decommissioning Service Market Size Growth Rate by Country (US$ Million): 2021 vs 2025 vs 2032
Table 56. Latin America Shallow Water Decommissioning Service Market Size by Country (US$ Million), 2021–2026
Table 57. Latin America Shallow Water Decommissioning Service Market Size by Country (US$ Million), 2027–2032
Table 58. Middle East & Africa Shallow Water Decommissioning Service Market Size Growth Rate by Country (US$ Million): 2021 vs 2025 vs 2032
Table 59. Middle East & Africa Shallow Water Decommissioning Service Market Size by Country (US$ Million), 2021–2026
Table 60. Middle East & Africa Shallow Water Decommissioning Service Market Size by Country (US$ Million), 2027–2032
Table 61. Exxon Mobil Company Details
Table 62. Exxon Mobil Business Overview
Table 63. Exxon Mobil Shallow Water Decommissioning Service Product
Table 64. Exxon Mobil Revenue in Shallow Water Decommissioning Service Business (US$ Million), 2021–2026
Table 65. Exxon Mobil Recent Development
Table 66. Royal Dutch Shell Company Details
Table 67. Royal Dutch Shell Business Overview
Table 68. Royal Dutch Shell Shallow Water Decommissioning Service Product
Table 69. Royal Dutch Shell Revenue in Shallow Water Decommissioning Service Business (US$ Million), 2021–2026
Table 70. Royal Dutch Shell Recent Development
Table 71. John Wood Group Plc Company Details
Table 72. John Wood Group Plc Business Overview
Table 73. John Wood Group Plc Shallow Water Decommissioning Service Product
Table 74. John Wood Group Plc Revenue in Shallow Water Decommissioning Service Business (US$ Million), 2021–2026
Table 75. John Wood Group Plc Recent Development
Table 76. Helix Energy Solutions Company Details
Table 77. Helix Energy Solutions Business Overview
Table 78. Helix Energy Solutions Shallow Water Decommissioning Service Product
Table 79. Helix Energy Solutions Revenue in Shallow Water Decommissioning Service Business (US$ Million), 2021–2026
Table 80. Helix Energy Solutions Recent Development
Table 81. Chevron Company Details
Table 82. Chevron Business Overview
Table 83. Chevron Shallow Water Decommissioning Service Product
Table 84. Chevron Revenue in Shallow Water Decommissioning Service Business (US$ Million), 2021–2026
Table 85. Chevron Recent Development
Table 86. British Petroleum Company Details
Table 87. British Petroleum Business Overview
Table 88. British Petroleum Shallow Water Decommissioning Service Product
Table 89. British Petroleum Revenue in Shallow Water Decommissioning Service Business (US$ Million), 2021–2026
Table 90. British Petroleum Recent Development
Table 91. Equinor Company Details
Table 92. Equinor Business Overview
Table 93. Equinor Shallow Water Decommissioning Service Product
Table 94. Equinor Revenue in Shallow Water Decommissioning Service Business (US$ Million), 2021–2026
Table 95. Equinor Recent Development
Table 96. Technifmc Company Details
Table 97. Technifmc Business Overview
Table 98. Technifmc Shallow Water Decommissioning Service Product
Table 99. Technifmc Revenue in Shallow Water Decommissioning Service Business (US$ Million), 2021–2026
Table 100. Technifmc Recent Development
Table 101. Unique Group Company Details
Table 102. Unique Group Business Overview
Table 103. Unique Group Shallow Water Decommissioning Service Product
Table 104. Unique Group Revenue in Shallow Water Decommissioning Service Business (US$ Million), 2021–2026
Table 105. Unique Group Recent Development
Table 106. Acteon Company Details
Table 107. Acteon Business Overview
Table 108. Acteon Shallow Water Decommissioning Service Product
Table 109. Acteon Revenue in Shallow Water Decommissioning Service Business (US$ Million), 2021–2026
Table 110. Acteon Recent Development
Table 111. Veolia Company Details
Table 112. Veolia Business Overview
Table 113. Veolia Shallow Water Decommissioning Service Product
Table 114. Veolia Revenue in Shallow Water Decommissioning Service Business (US$ Million), 2021–2026
Table 115. Veolia Recent Development
Table 116. Bluestream Company Details
Table 117. Bluestream Business Overview
Table 118. Bluestream Shallow Water Decommissioning Service Product
Table 119. Bluestream Revenue in Shallow Water Decommissioning Service Business (US$ Million), 2021–2026
Table 120. Bluestream Recent Development
Table 121. DEME Group Company Details
Table 122. DEME Group Business Overview
Table 123. DEME Group Shallow Water Decommissioning Service Product
Table 124. DEME Group Revenue in Shallow Water Decommissioning Service Business (US$ Million), 2021–2026
Table 125. DEME Group Recent Development
Table 126. Stowen Group Company Details
Table 127. Stowen Group Business Overview
Table 128. Stowen Group Shallow Water Decommissioning Service Product
Table 129. Stowen Group Revenue in Shallow Water Decommissioning Service Business (US$ Million), 2021–2026
Table 130. Stowen Group Recent Development
Table 131. Research Programs/Design for This Report
Table 132. Key Data Information from Secondary Sources
Table 133. Key Data Information from Primary Sources
Table 134. Authors List of This Report
List of Figures
Figure 1. Shallow Water Decommissioning Service Picture
Figure 2. Global Shallow Water Decommissioning Service Market Size Comparison by Type (US$ Million), 2021–2032
Figure 3. Global Shallow Water Decommissioning Service Market Share by Type: 2025 vs 2032
Figure 4. Well Plugging and Abandonment Features
Figure 5. Conductor Removal Features
Figure 6. Mobilization and Demobilization of Derrick Barges Features
Figure 7. Platform Removal Features
Figure 8. Pipeline and Power Cable Decommissioning Features
Figure 9. Materials Disposal Features
Figure 10. Global Shallow Water Decommissioning Service Market Size Comparison by Disposal Methods (US$ Million), 2021–2032
Figure 11. Complete Removal Features
Figure 12. Partial Removal Features
Figure 13. On-Site Conversion Features
Figure 14. Relocation to Another Location Features
Figure 15. Others Features
Figure 16. Global Shallow Water Decommissioning Service Market Size Comparison by Facilities (US$ Million), 2021–2032
Figure 17. Fixed Platforms Decommissioning Features
Figure 18. Pipelines and Wellhead Facilities Decommissioning Features
Figure 19. Auxiliary Facilities Decommissioning Features
Figure 20. Others Features
Figure 21. Global Shallow Water Decommissioning Service Market Size by Application (US$ Million), 2021–2032
Figure 22. Global Shallow Water Decommissioning Service Market Share by Application: 2025 vs 2032
Figure 23. Topside Decommissioning Case Studies
Figure 24. Substructure Decommissioning Case Studies
Figure 25. Sub infrastructure Decommissioning Case Studies
Figure 26. Shallow Water Decommissioning Service Report Years Considered
Figure 27. Global Shallow Water Decommissioning Service Market Size (US$ Million), Year-over-Year: 2021–2032
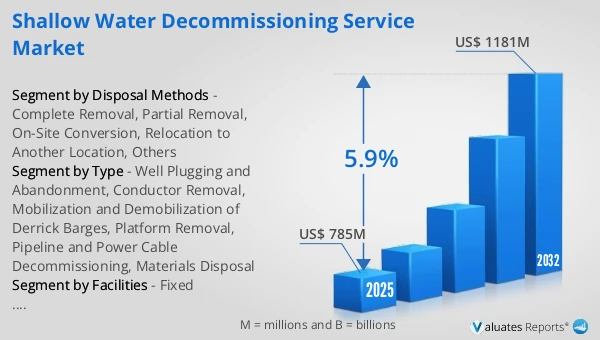
Figure 28. Global Shallow Water Decommissioning Service Market Size, (US$ Million), 2021 vs 2025 vs 2032
Figure 29. Global Shallow Water Decommissioning Service Market Share by Region: 2025 vs 2032
Figure 30. Global Shallow Water Decommissioning Service Market Share by Players in 2025
Figure 31. Global Shallow Water Decommissioning Service Market Share by Company Type (Tier 1, Tier 2, and Tier 3)
Figure 32. The Top 10 and 5 Players Market Share by Shallow Water Decommissioning Service Revenue in 2025
Figure 33. North America Shallow Water Decommissioning Service Market Size YoY Growth (US$ Million), 2021–2032
Figure 34. North America Shallow Water Decommissioning Service Market Share by Country (2021–2032)
Figure 35. United States Shallow Water Decommissioning Service Market Size YoY Growth (US$ Million), 2021–2032
Figure 36. Canada Shallow Water Decommissioning Service Market Size YoY Growth (US$ Million), 2021–2032
Figure 37. Europe Shallow Water Decommissioning Service Market Size YoY Growth (US$ Million), 2021–2032
Figure 38. Europe Shallow Water Decommissioning Service Market Share by Country (2021–2032)
Figure 39. Germany Shallow Water Decommissioning Service Market Size YoY Growth (US$ Million), 2021–2032
Figure 40. France Shallow Water Decommissioning Service Market Size YoY Growth (US$ Million), 2021–2032
Figure 41. U.K. Shallow Water Decommissioning Service Market Size YoY Growth (US$ Million), 2021–2032
Figure 42. Italy Shallow Water Decommissioning Service Market Size YoY Growth (US$ Million), 2021–2032
Figure 43. Russia Shallow Water Decommissioning Service Market Size YoY Growth (US$ Million), 2021–2032
Figure 44. Ireland Shallow Water Decommissioning Service Market Size YoY Growth (US$ Million), 2021–2032
Figure 45. Asia-Pacific Shallow Water Decommissioning Service Market Size YoY Growth (US$ Million), 2021–2032
Figure 46. Asia-Pacific Shallow Water Decommissioning Service Market Share by Region (2021–2032)
Figure 47. China Shallow Water Decommissioning Service Market Size YoY Growth (US$ Million), 2021–2032
Figure 48. Japan Shallow Water Decommissioning Service Market Size YoY Growth (US$ Million), 2021–2032
Figure 49. South Korea Shallow Water Decommissioning Service Market Size YoY Growth (US$ Million), 2021–2032
Figure 50. Southeast Asia Shallow Water Decommissioning Service Market Size YoY Growth (US$ Million), 2021–2032
Figure 51. India Shallow Water Decommissioning Service Market Size YoY Growth (US$ Million), 2021–2032
Figure 52. Australia & New Zealand Shallow Water Decommissioning Service Market Size YoY Growth (US$ Million), 2021–2032
Figure 53. Latin America Shallow Water Decommissioning Service Market Size YoY Growth (US$ Million), 2021–2032
Figure 54. Latin America Shallow Water Decommissioning Service Market Share by Country (2021–2032)
Figure 55. Mexico Shallow Water Decommissioning Service Market Size YoY Growth (US$ Million), 2021–2032
Figure 56. Brazil Shallow Water Decommissioning Service Market Size YoY Growth (US$ Million), 2021–2032
Figure 57. Middle East & Africa Shallow Water Decommissioning Service Market Size YoY Growth (US$ Million), 2021–2032
Figure 58. Middle East & Africa Shallow Water Decommissioning Service Market Share by Country (2021–2032)
Figure 59. Israel Shallow Water Decommissioning Service Market Size YoY Growth (US$ Million), 2021–2032
Figure 60. Saudi Arabia Shallow Water Decommissioning Service Market Size YoY Growth (US$ Million), 2021–2032
Figure 61. UAE Shallow Water Decommissioning Service Market Size YoY Growth (US$ Million), 2021–2032
Figure 62. Exxon Mobil Revenue Growth Rate in Shallow Water Decommissioning Service Business (2021–2026)
Figure 63. Royal Dutch Shell Revenue Growth Rate in Shallow Water Decommissioning Service Business (2021–2026)
Figure 64. John Wood Group Plc Revenue Growth Rate in Shallow Water Decommissioning Service Business (2021–2026)
Figure 65. Helix Energy Solutions Revenue Growth Rate in Shallow Water Decommissioning Service Business (2021–2026)
Figure 66. Chevron Revenue Growth Rate in Shallow Water Decommissioning Service Business (2021–2026)
Figure 67. British Petroleum Revenue Growth Rate in Shallow Water Decommissioning Service Business (2021–2026)
Figure 68. Equinor Revenue Growth Rate in Shallow Water Decommissioning Service Business (2021–2026)
Figure 69. Technifmc Revenue Growth Rate in Shallow Water Decommissioning Service Business (2021–2026)
Figure 70. Unique Group Revenue Growth Rate in Shallow Water Decommissioning Service Business (2021–2026)
Figure 71. Acteon Revenue Growth Rate in Shallow Water Decommissioning Service Business (2021–2026)
Figure 72. Veolia Revenue Growth Rate in Shallow Water Decommissioning Service Business (2021–2026)
Figure 73. Bluestream Revenue Growth Rate in Shallow Water Decommissioning Service Business (2021–2026)
Figure 74. DEME Group Revenue Growth Rate in Shallow Water Decommissioning Service Business (2021–2026)
Figure 75. Stowen Group Revenue Growth Rate in Shallow Water Decommissioning Service Business (2021–2026)
Figure 76. Bottom-up and Top-down Approaches for This Report
Figure 77. Data Triangulation
Figure 78. Key Executives Interviewed