List of Tables
Table 1. Global Biomanufacturing in Food and Nutrition Market Size Growth Rate by Type (US$ Million): 2021 vs 2025 vs 2032
Table 2. Key Players of Amino Acids
Table 3. Key Players of Pigments
Table 4. Key Players of Enzymes
Table 5. Key Players of Flavors
Table 6. Key Players of Fatty acids
Table 7. Key Players of Proteins
Table 8. Key Players of Biopreservatives
Table 9. Global Biomanufacturing in Food and Nutrition Market Size Growth Rate by Function (US$ Million): 2021 vs 2025 vs 2032
Table 10. Key Players of Acidity Regulators
Table 11. Key Players of Preservatives
Table 12. Key Players of Defoamers
Table 13. Key Players of Spices
Table 14. Key Players of Sweeteners
Table 15. Key Players of Nutritional Supplements
Table 16. Key Players of Enzymes
Table 17. Global Biomanufacturing in Food and Nutrition Market Size Growth Rate by Process (US$ Million): 2021 vs 2025 vs 2032
Table 18. Key Players of Bio-fermentation
Table 19. Key Players of Enzymatic Hydrolysis
Table 20. Global Biomanufacturing in Food and Nutrition Market Size Growth by Application (US$ Million): 2021 vs 2025 vs 2032
Table 21. Global Biomanufacturing in Food and Nutrition Market Size by Region (US$ Million): 2021 vs 2025 vs 2032
Table 22. Global Biomanufacturing in Food and Nutrition Market Size by Region (US$ Million), 2021–2026
Table 23. Global Biomanufacturing in Food and Nutrition Market Share by Region (2021–2026)
Table 24. Global Biomanufacturing in Food and Nutrition Forecasted Market Size by Region (US$ Million), 2027–2032
Table 25. Global Biomanufacturing in Food and Nutrition Market Share by Region (2027–2032)
Table 26. Biomanufacturing in Food and Nutrition Market Trends
Table 27. Biomanufacturing in Food and Nutrition Market Drivers
Table 28. Biomanufacturing in Food and Nutrition Market Challenges
Table 29. Biomanufacturing in Food and Nutrition Market Restraints
Table 30. Global Biomanufacturing in Food and Nutrition Revenue by Players (US$ Million), 2021–2026
Table 31. Global Biomanufacturing in Food and Nutrition Market Share by Players (2021–2026)
Table 32. Global Top Biomanufacturing in Food and Nutrition Players by Tier (Tier 1, Tier 2, and Tier 3), based on Biomanufacturing in Food and Nutrition Revenue, 2025
Table 33. Ranking of Global Top Biomanufacturing in Food and Nutrition Companies by Revenue (US$ Million) in 2025
Table 34. Global 5 Largest Players Market Share by Biomanufacturing in Food and Nutrition Revenue (CR5 and HHI), 2021–2026
Table 35. Global Key Players of Biomanufacturing in Food and Nutrition, Headquarters and Area Served
Table 36. Global Key Players of Biomanufacturing in Food and Nutrition, Products and Applications
Table 37. Global Key Players of Biomanufacturing in Food and Nutrition, Date of General Availability (GA)
Table 38. Mergers and Acquisitions, Expansion Plans
Table 39. Global Biomanufacturing in Food and Nutrition Market Size by Type (US$ Million), 2021–2026
Table 40. Global Biomanufacturing in Food and Nutrition Revenue Market Share by Type (2021–2026)
Table 41. Global Biomanufacturing in Food and Nutrition Forecasted Market Size by Type (US$ Million), 2027–2032
Table 42. Global Biomanufacturing in Food and Nutrition Revenue Market Share by Type (2027–2032)
Table 43. Global Biomanufacturing in Food and Nutrition Market Size by Application (US$ Million), 2021–2026
Table 44. Global Biomanufacturing in Food and Nutrition Revenue Market Share by Application (2021–2026)
Table 45. Global Biomanufacturing in Food and Nutrition Forecasted Market Size by Application (US$ Million), 2027–2032
Table 46. Global Biomanufacturing in Food and Nutrition Revenue Market Share by Application (2027–2032)
Table 47. North America Biomanufacturing in Food and Nutrition Market Size Growth Rate by Country (US$ Million): 2021 vs 2025 vs 2032
Table 48. North America Biomanufacturing in Food and Nutrition Market Size by Country (US$ Million), 2021–2026
Table 49. North America Biomanufacturing in Food and Nutrition Market Size by Country (US$ Million), 2027–2032
Table 50. Europe Biomanufacturing in Food and Nutrition Market Size Growth Rate by Country (US$ Million): 2021 vs 2025 vs 2032
Table 51. Europe Biomanufacturing in Food and Nutrition Market Size by Country (US$ Million), 2021–2026
Table 52. Europe Biomanufacturing in Food and Nutrition Market Size by Country (US$ Million), 2027–2032
Table 53. Asia-Pacific Biomanufacturing in Food and Nutrition Market Size Growth Rate by Region (US$ Million): 2021 vs 2025 vs 2032
Table 54. Asia-Pacific Biomanufacturing in Food and Nutrition Market Size by Region (US$ Million), 2021–2026
Table 55. Asia-Pacific Biomanufacturing in Food and Nutrition Market Size by Region (US$ Million), 2027–2032
Table 56. Latin America Biomanufacturing in Food and Nutrition Market Size Growth Rate by Country (US$ Million): 2021 vs 2025 vs 2032
Table 57. Latin America Biomanufacturing in Food and Nutrition Market Size by Country (US$ Million), 2021–2026
Table 58. Latin America Biomanufacturing in Food and Nutrition Market Size by Country (US$ Million), 2027–2032
Table 59. Middle East & Africa Biomanufacturing in Food and Nutrition Market Size Growth Rate by Country (US$ Million): 2021 vs 2025 vs 2032
Table 60. Middle East & Africa Biomanufacturing in Food and Nutrition Market Size by Country (US$ Million), 2021–2026
Table 61. Middle East & Africa Biomanufacturing in Food and Nutrition Market Size by Country (US$ Million), 2027–2032
Table 62. Novozymes Company Details
Table 63. Novozymes Business Overview
Table 64. Novozymes Biomanufacturing in Food and Nutrition Product
Table 65. Novozymes Revenue in Biomanufacturing in Food and Nutrition Business (US$ Million), 2021–2026
Table 66. Novozymes Recent Development
Table 67. DSM Company Details
Table 68. DSM Business Overview
Table 69. DSM Biomanufacturing in Food and Nutrition Product
Table 70. DSM Revenue in Biomanufacturing in Food and Nutrition Business (US$ Million), 2021–2026
Table 71. DSM Recent Development
Table 72. Meihua Holdings Group Company Details
Table 73. Meihua Holdings Group Business Overview
Table 74. Meihua Holdings Group Biomanufacturing in Food and Nutrition Product
Table 75. Meihua Holdings Group Revenue in Biomanufacturing in Food and Nutrition Business (US$ Million), 2021–2026
Table 76. Meihua Holdings Group Recent Development
Table 77. Ingredion Incorporated Company Details
Table 78. Ingredion Incorporated Business Overview
Table 79. Ingredion Incorporated Biomanufacturing in Food and Nutrition Product
Table 80. Ingredion Incorporated Revenue in Biomanufacturing in Food and Nutrition Business (US$ Million), 2021–2026
Table 81. Ingredion Incorporated Recent Development
Table 82. Lesaffre Company Details
Table 83. Lesaffre Business Overview
Table 84. Lesaffre Biomanufacturing in Food and Nutrition Product
Table 85. Lesaffre Revenue in Biomanufacturing in Food and Nutrition Business (US$ Million), 2021–2026
Table 86. Lesaffre Recent Development
Table 87. Angel Yeast Company Details
Table 88. Angel Yeast Business Overview
Table 89. Angel Yeast Biomanufacturing in Food and Nutrition Product
Table 90. Angel Yeast Revenue in Biomanufacturing in Food and Nutrition Business (US$ Million), 2021–2026
Table 91. Angel Yeast Recent Development
Table 92. International Flavors & Fragrances Inc. Company Details
Table 93. International Flavors & Fragrances Inc. Business Overview
Table 94. International Flavors & Fragrances Inc. Biomanufacturing in Food and Nutrition Product
Table 95. International Flavors & Fragrances Inc. Revenue in Biomanufacturing in Food and Nutrition Business (US$ Million), 2021–2026
Table 96. International Flavors & Fragrances Inc. Recent Development
Table 97. Corbion Company Details
Table 98. Corbion Business Overview
Table 99. Corbion Biomanufacturing in Food and Nutrition Product
Table 100. Corbion Revenue in Biomanufacturing in Food and Nutrition Business (US$ Million), 2021–2026
Table 101. Corbion Recent Development
Table 102. Tate & Lyle Company Details
Table 103. Tate & Lyle Business Overview
Table 104. Tate & Lyle Biomanufacturing in Food and Nutrition Product
Table 105. Tate & Lyle Revenue in Biomanufacturing in Food and Nutrition Business (US$ Million), 2021–2026
Table 106. Tate & Lyle Recent Development
Table 107. FrieslandCampina Ingredients Company Details
Table 108. FrieslandCampina Ingredients Business Overview
Table 109. FrieslandCampina Ingredients Biomanufacturing in Food and Nutrition Product
Table 110. FrieslandCampina Ingredients Revenue in Biomanufacturing in Food and Nutrition Business (US$ Million), 2021–2026
Table 111. FrieslandCampina Ingredients Recent Development
Table 112. Takasago International Company Details
Table 113. Takasago International Business Overview
Table 114. Takasago International Biomanufacturing in Food and Nutrition Product
Table 115. Takasago International Revenue in Biomanufacturing in Food and Nutrition Business (US$ Million), 2021–2026
Table 116. Takasago International Recent Development
Table 117. CSPC Pharmaceutical Group Company Details
Table 118. CSPC Pharmaceutical Group Business Overview
Table 119. CSPC Pharmaceutical Group Biomanufacturing in Food and Nutrition Product
Table 120. CSPC Pharmaceutical Group Revenue in Biomanufacturing in Food and Nutrition Business (US$ Million), 2021–2026
Table 121. CSPC Pharmaceutical Group Recent Development
Table 122. Cargill Company Details
Table 123. Cargill Business Overview
Table 124. Cargill Biomanufacturing in Food and Nutrition Product
Table 125. Cargill Revenue in Biomanufacturing in Food and Nutrition Business (US$ Million), 2021–2026
Table 126. Cargill Recent Development
Table 127. Amano Enzyme Company Details
Table 128. Amano Enzyme Business Overview
Table 129. Amano Enzyme Biomanufacturing in Food and Nutrition Product
Table 130. Amano Enzyme Revenue in Biomanufacturing in Food and Nutrition Business (US$ Million), 2021–2026
Table 131. Amano Enzyme Recent Development
Table 132. Baolingbao Biology Co Company Details
Table 133. Baolingbao Biology Co Business Overview
Table 134. Baolingbao Biology Co Biomanufacturing in Food and Nutrition Product
Table 135. Baolingbao Biology Co Revenue in Biomanufacturing in Food and Nutrition Business (US$ Million), 2021–2026
Table 136. Baolingbao Biology Co Recent Development
Table 137. Luwei Pharmaceutical Group Company Details
Table 138. Luwei Pharmaceutical Group Business Overview
Table 139. Luwei Pharmaceutical Group Biomanufacturing in Food and Nutrition Product
Table 140. Luwei Pharmaceutical Group Revenue in Biomanufacturing in Food and Nutrition Business (US$ Million), 2021–2026
Table 141. Luwei Pharmaceutical Group Recent Development
Table 142. Lallemand Company Details
Table 143. Lallemand Business Overview
Table 144. Lallemand Biomanufacturing in Food and Nutrition Product
Table 145. Lallemand Revenue in Biomanufacturing in Food and Nutrition Business (US$ Million), 2021–2026
Table 146. Lallemand Recent Development
Table 147. Shandong Sanyuan Biotechnology Company Details
Table 148. Shandong Sanyuan Biotechnology Business Overview
Table 149. Shandong Sanyuan Biotechnology Biomanufacturing in Food and Nutrition Product
Table 150. Shandong Sanyuan Biotechnology Revenue in Biomanufacturing in Food and Nutrition Business (US$ Million), 2021–2026
Table 151. Shandong Sanyuan Biotechnology Recent Development
Table 152. Shandong Bailong Chuangyuan Bio-Tech Company Details
Table 153. Shandong Bailong Chuangyuan Bio-Tech Business Overview
Table 154. Shandong Bailong Chuangyuan Bio-Tech Biomanufacturing in Food and Nutrition Product
Table 155. Shandong Bailong Chuangyuan Bio-Tech Revenue in Biomanufacturing in Food and Nutrition Business (US$ Million), 2021–2026
Table 156. Shandong Bailong Chuangyuan Bio-Tech Recent Development
Table 157. Zhejiang Shengda Bio-Pharm Company Details
Table 158. Zhejiang Shengda Bio-Pharm Business Overview
Table 159. Zhejiang Shengda Bio-Pharm Biomanufacturing in Food and Nutrition Product
Table 160. Zhejiang Shengda Bio-Pharm Revenue in Biomanufacturing in Food and Nutrition Business (US$ Million), 2021–2026
Table 161. Zhejiang Shengda Bio-Pharm Recent Development
Table 162. CABIO Biotech Company Details
Table 163. CABIO Biotech Business Overview
Table 164. CABIO Biotech Biomanufacturing in Food and Nutrition Product
Table 165. CABIO Biotech Revenue in Biomanufacturing in Food and Nutrition Business (US$ Million), 2021–2026
Table 166. CABIO Biotech Recent Development
Table 167. Syensqo Company Details
Table 168. Syensqo Business Overview
Table 169. Syensqo Biomanufacturing in Food and Nutrition Product
Table 170. Syensqo Revenue in Biomanufacturing in Food and Nutrition Business (US$ Million), 2021–2026
Table 171. Syensqo Recent Development
Table 172. BASF Company Details
Table 173. BASF Business Overview
Table 174. BASF Biomanufacturing in Food and Nutrition Product
Table 175. BASF Revenue in Biomanufacturing in Food and Nutrition Business (US$ Million), 2021–2026
Table 176. BASF Recent Development
Table 177. Xiamen Oamic BIOTECH Co Company Details
Table 178. Xiamen Oamic BIOTECH Co Business Overview
Table 179. Xiamen Oamic BIOTECH Co Biomanufacturing in Food and Nutrition Product
Table 180. Xiamen Oamic BIOTECH Co Revenue in Biomanufacturing in Food and Nutrition Business (US$ Million), 2021–2026
Table 181. Xiamen Oamic BIOTECH Co Recent Development
Table 182. Symrise AG Company Details
Table 183. Symrise AG Business Overview
Table 184. Symrise AG Biomanufacturing in Food and Nutrition Product
Table 185. Symrise AG Revenue in Biomanufacturing in Food and Nutrition Business (US$ Million), 2021–2026
Table 186. Symrise AG Recent Development
Table 187. JNC Corporation Company Details
Table 188. JNC Corporation Business Overview
Table 189. JNC Corporation Biomanufacturing in Food and Nutrition Product
Table 190. JNC Corporation Revenue in Biomanufacturing in Food and Nutrition Business (US$ Million), 2021–2026
Table 191. JNC Corporation Recent Development
Table 192. Perfect Day, Inc Company Details
Table 193. Perfect Day, Inc Business Overview
Table 194. Perfect Day, Inc Biomanufacturing in Food and Nutrition Product
Table 195. Perfect Day, Inc Revenue in Biomanufacturing in Food and Nutrition Business (US$ Million), 2021–2026
Table 196. Perfect Day, Inc Recent Development
Table 197. Agropur Company Details
Table 198. Agropur Business Overview
Table 199. Agropur Biomanufacturing in Food and Nutrition Product
Table 200. Agropur Revenue in Biomanufacturing in Food and Nutrition Business (US$ Million), 2021–2026
Table 201. Agropur Recent Development
Table 202. Zhejiang NHU Company Company Details
Table 203. Zhejiang NHU Company Business Overview
Table 204. Zhejiang NHU Company Biomanufacturing in Food and Nutrition Product
Table 205. Zhejiang NHU Company Revenue in Biomanufacturing in Food and Nutrition Business (US$ Million), 2021–2026
Table 206. Zhejiang NHU Company Recent Development
Table 207. Arla Foods Ingredients Company Details
Table 208. Arla Foods Ingredients Business Overview
Table 209. Arla Foods Ingredients Biomanufacturing in Food and Nutrition Product
Table 210. Arla Foods Ingredients Revenue in Biomanufacturing in Food and Nutrition Business (US$ Million), 2021–2026
Table 211. Arla Foods Ingredients Recent Development
Table 212. VTR Biotech Company Details
Table 213. VTR Biotech Business Overview
Table 214. VTR Biotech Biomanufacturing in Food and Nutrition Product
Table 215. VTR Biotech Revenue in Biomanufacturing in Food and Nutrition Business (US$ Million), 2021–2026
Table 216. VTR Biotech Recent Development
Table 217. Lushang Freda Pharmaceutical Co Company Details
Table 218. Lushang Freda Pharmaceutical Co Business Overview
Table 219. Lushang Freda Pharmaceutical Co Biomanufacturing in Food and Nutrition Product
Table 220. Lushang Freda Pharmaceutical Co Revenue in Biomanufacturing in Food and Nutrition Business (US$ Million), 2021–2026
Table 221. Lushang Freda Pharmaceutical Co Recent Development
Table 222. VACURE Biotechnology Co Company Details
Table 223. VACURE Biotechnology Co Business Overview
Table 224. VACURE Biotechnology Co Biomanufacturing in Food and Nutrition Product
Table 225. VACURE Biotechnology Co Revenue in Biomanufacturing in Food and Nutrition Business (US$ Million), 2021–2026
Table 226. VACURE Biotechnology Co Recent Development
Table 227. Chihon Biotechnology Co Company Details
Table 228. Chihon Biotechnology Co Business Overview
Table 229. Chihon Biotechnology Co Biomanufacturing in Food and Nutrition Product
Table 230. Chihon Biotechnology Co Revenue in Biomanufacturing in Food and Nutrition Business (US$ Million), 2021–2026
Table 231. Chihon Biotechnology Co Recent Development
Table 232. Qingdao Vland Biotech Company Details
Table 233. Qingdao Vland Biotech Business Overview
Table 234. Qingdao Vland Biotech Biomanufacturing in Food and Nutrition Product
Table 235. Qingdao Vland Biotech Revenue in Biomanufacturing in Food and Nutrition Business (US$ Million), 2021–2026
Table 236. Qingdao Vland Biotech Recent Development
Table 237. Hubei Guangji Pharmaceutical Company Details
Table 238. Hubei Guangji Pharmaceutical Business Overview
Table 239. Hubei Guangji Pharmaceutical Biomanufacturing in Food and Nutrition Product
Table 240. Hubei Guangji Pharmaceutical Revenue in Biomanufacturing in Food and Nutrition Business (US$ Million), 2021–2026
Table 241. Hubei Guangji Pharmaceutical Recent Development
Table 242. Yifan Pharmaceutical Company Details
Table 243. Yifan Pharmaceutical Business Overview
Table 244. Yifan Pharmaceutical Biomanufacturing in Food and Nutrition Product
Table 245. Yifan Pharmaceutical Revenue in Biomanufacturing in Food and Nutrition Business (US$ Million), 2021–2026
Table 246. Yifan Pharmaceutical Recent Development
Table 247. LCY Group Company Details
Table 248. LCY Group Business Overview
Table 249. LCY Group Biomanufacturing in Food and Nutrition Product
Table 250. LCY Group Revenue in Biomanufacturing in Food and Nutrition Business (US$ Million), 2021–2026
Table 251. LCY Group Recent Development
Table 252. Jiangxi Fushine Pharmaceutical Company Details
Table 253. Jiangxi Fushine Pharmaceutical Business Overview
Table 254. Jiangxi Fushine Pharmaceutical Biomanufacturing in Food and Nutrition Product
Table 255. Jiangxi Fushine Pharmaceutical Revenue in Biomanufacturing in Food and Nutrition Business (US$ Million), 2021–2026
Table 256. Jiangxi Fushine Pharmaceutical Recent Development
Table 257. FUJI OIL CO Company Details
Table 258. FUJI OIL CO Business Overview
Table 259. FUJI OIL CO Biomanufacturing in Food and Nutrition Product
Table 260. FUJI OIL CO Revenue in Biomanufacturing in Food and Nutrition Business (US$ Million), 2021–2026
Table 261. FUJI OIL CO Recent Development
Table 262. Research Programs/Design for This Report
Table 263. Key Data Information from Secondary Sources
Table 264. Key Data Information from Primary Sources
Table 265. Authors List of This Report
List of Figures
Figure 1. Biomanufacturing in Food and Nutrition Picture
Figure 2. Global Biomanufacturing in Food and Nutrition Market Size Comparison by Type (US$ Million), 2021–2032
Figure 3. Global Biomanufacturing in Food and Nutrition Market Share by Type: 2025 vs 2032
Figure 4. Amino Acids Features
Figure 5. Pigments Features
Figure 6. Enzymes Features
Figure 7. Flavors Features
Figure 8. Fatty acids Features
Figure 9. Proteins Features
Figure 10. Biopreservatives Features
Figure 11. Yeast Extract Features
Figure 12. Vitamins Features
Figure 13. Global Biomanufacturing in Food and Nutrition Market Size Comparison by Function (US$ Million), 2021–2032
Figure 14. Acidity Regulators Features
Figure 15. Preservatives Features
Figure 16. Defoamers Features
Figure 17. Spices Features
Figure 18. Sweeteners Features
Figure 19. Nutritional Supplements Features
Figure 20. Enzymes Features
Figure 21. Flavor Enhancers Features
Figure 22. Others Features
Figure 23. Global Biomanufacturing in Food and Nutrition Market Size Comparison by Process (US$ Million), 2021–2032
Figure 24. Bio-fermentation Features
Figure 25. Enzymatic Hydrolysis Features
Figure 26. Global Biomanufacturing in Food and Nutrition Market Size by Application (US$ Million), 2021–2032
Figure 27. Global Biomanufacturing in Food and Nutrition Market Share by Application: 2025 vs 2032
Figure 28. General Food Case Studies
Figure 29. Fermented Food Case Studies
Figure 30. Functional Health Food Case Studies
Figure 31. Special Medical Food Case Studies
Figure 32. Infant Formula Food Case Studies
Figure 33. Biomanufacturing in Food and Nutrition Report Years Considered
Figure 34. Global Biomanufacturing in Food and Nutrition Market Size (US$ Million), Year-over-Year: 2021–2032
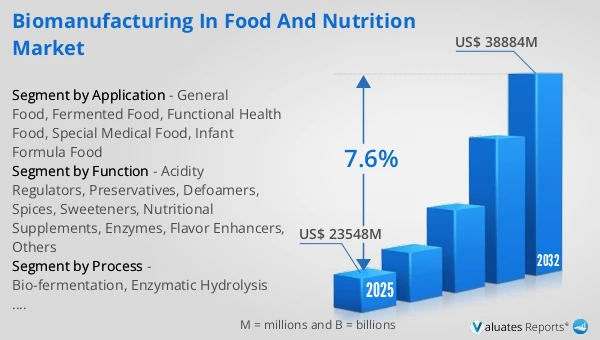
Figure 35. Global Biomanufacturing in Food and Nutrition Market Size, (US$ Million), 2021 vs 2025 vs 2032
Figure 36. Global Biomanufacturing in Food and Nutrition Market Share by Region: 2025 vs 2032
Figure 37. Global Biomanufacturing in Food and Nutrition Market Share by Players in 2025
Figure 38. Global Biomanufacturing in Food and Nutrition Market Share by Company Type (Tier 1, Tier 2, and Tier 3)
Figure 39. The Top 10 and 5 Players Market Share by Biomanufacturing in Food and Nutrition Revenue in 2025
Figure 40. North America Biomanufacturing in Food and Nutrition Market Size YoY Growth (US$ Million), 2021–2032
Figure 41. North America Biomanufacturing in Food and Nutrition Market Share by Country (2021–2032)
Figure 42. United States Biomanufacturing in Food and Nutrition Market Size YoY Growth (US$ Million), 2021–2032
Figure 43. Canada Biomanufacturing in Food and Nutrition Market Size YoY Growth (US$ Million), 2021–2032
Figure 44. Europe Biomanufacturing in Food and Nutrition Market Size YoY Growth (US$ Million), 2021–2032
Figure 45. Europe Biomanufacturing in Food and Nutrition Market Share by Country (2021–2032)
Figure 46. Germany Biomanufacturing in Food and Nutrition Market Size YoY Growth (US$ Million), 2021–2032
Figure 47. France Biomanufacturing in Food and Nutrition Market Size YoY Growth (US$ Million), 2021–2032
Figure 48. U.K. Biomanufacturing in Food and Nutrition Market Size YoY Growth (US$ Million), 2021–2032
Figure 49. Italy Biomanufacturing in Food and Nutrition Market Size YoY Growth (US$ Million), 2021–2032
Figure 50. Russia Biomanufacturing in Food and Nutrition Market Size YoY Growth (US$ Million), 2021–2032
Figure 51. Ireland Biomanufacturing in Food and Nutrition Market Size YoY Growth (US$ Million), 2021–2032
Figure 52. Asia-Pacific Biomanufacturing in Food and Nutrition Market Size YoY Growth (US$ Million), 2021–2032
Figure 53. Asia-Pacific Biomanufacturing in Food and Nutrition Market Share by Region (2021–2032)
Figure 54. China Biomanufacturing in Food and Nutrition Market Size YoY Growth (US$ Million), 2021–2032
Figure 55. Japan Biomanufacturing in Food and Nutrition Market Size YoY Growth (US$ Million), 2021–2032
Figure 56. South Korea Biomanufacturing in Food and Nutrition Market Size YoY Growth (US$ Million), 2021–2032
Figure 57. Southeast Asia Biomanufacturing in Food and Nutrition Market Size YoY Growth (US$ Million), 2021–2032
Figure 58. India Biomanufacturing in Food and Nutrition Market Size YoY Growth (US$ Million), 2021–2032
Figure 59. Australia & New Zealand Biomanufacturing in Food and Nutrition Market Size YoY Growth (US$ Million), 2021–2032
Figure 60. Latin America Biomanufacturing in Food and Nutrition Market Size YoY Growth (US$ Million), 2021–2032
Figure 61. Latin America Biomanufacturing in Food and Nutrition Market Share by Country (2021–2032)
Figure 62. Mexico Biomanufacturing in Food and Nutrition Market Size YoY Growth (US$ Million), 2021–2032
Figure 63. Brazil Biomanufacturing in Food and Nutrition Market Size YoY Growth (US$ Million), 2021–2032
Figure 64. Middle East & Africa Biomanufacturing in Food and Nutrition Market Size YoY Growth (US$ Million), 2021–2032
Figure 65. Middle East & Africa Biomanufacturing in Food and Nutrition Market Share by Country (2021–2032)
Figure 66. Israel Biomanufacturing in Food and Nutrition Market Size YoY Growth (US$ Million), 2021–2032
Figure 67. Saudi Arabia Biomanufacturing in Food and Nutrition Market Size YoY Growth (US$ Million), 2021–2032
Figure 68. UAE Biomanufacturing in Food and Nutrition Market Size YoY Growth (US$ Million), 2021–2032
Figure 69. Novozymes Revenue Growth Rate in Biomanufacturing in Food and Nutrition Business (2021–2026)
Figure 70. DSM Revenue Growth Rate in Biomanufacturing in Food and Nutrition Business (2021–2026)
Figure 71. Meihua Holdings Group Revenue Growth Rate in Biomanufacturing in Food and Nutrition Business (2021–2026)
Figure 72. Ingredion Incorporated Revenue Growth Rate in Biomanufacturing in Food and Nutrition Business (2021–2026)
Figure 73. Lesaffre Revenue Growth Rate in Biomanufacturing in Food and Nutrition Business (2021–2026)
Figure 74. Angel Yeast Revenue Growth Rate in Biomanufacturing in Food and Nutrition Business (2021–2026)
Figure 75. International Flavors & Fragrances Inc. Revenue Growth Rate in Biomanufacturing in Food and Nutrition Business (2021–2026)
Figure 76. Corbion Revenue Growth Rate in Biomanufacturing in Food and Nutrition Business (2021–2026)
Figure 77. Tate & Lyle Revenue Growth Rate in Biomanufacturing in Food and Nutrition Business (2021–2026)
Figure 78. FrieslandCampina Ingredients Revenue Growth Rate in Biomanufacturing in Food and Nutrition Business (2021–2026)
Figure 79. Takasago International Revenue Growth Rate in Biomanufacturing in Food and Nutrition Business (2021–2026)
Figure 80. CSPC Pharmaceutical Group Revenue Growth Rate in Biomanufacturing in Food and Nutrition Business (2021–2026)
Figure 81. Cargill Revenue Growth Rate in Biomanufacturing in Food and Nutrition Business (2021–2026)
Figure 82. Amano Enzyme Revenue Growth Rate in Biomanufacturing in Food and Nutrition Business (2021–2026)
Figure 83. Baolingbao Biology Co Revenue Growth Rate in Biomanufacturing in Food and Nutrition Business (2021–2026)
Figure 84. Luwei Pharmaceutical Group Revenue Growth Rate in Biomanufacturing in Food and Nutrition Business (2021–2026)
Figure 85. Lallemand Revenue Growth Rate in Biomanufacturing in Food and Nutrition Business (2021–2026)
Figure 86. Shandong Sanyuan Biotechnology Revenue Growth Rate in Biomanufacturing in Food and Nutrition Business (2021–2026)
Figure 87. Shandong Bailong Chuangyuan Bio-Tech Revenue Growth Rate in Biomanufacturing in Food and Nutrition Business (2021–2026)
Figure 88. Zhejiang Shengda Bio-Pharm Revenue Growth Rate in Biomanufacturing in Food and Nutrition Business (2021–2026)
Figure 89. CABIO Biotech Revenue Growth Rate in Biomanufacturing in Food and Nutrition Business (2021–2026)
Figure 90. Syensqo Revenue Growth Rate in Biomanufacturing in Food and Nutrition Business (2021–2026)
Figure 91. BASF Revenue Growth Rate in Biomanufacturing in Food and Nutrition Business (2021–2026)
Figure 92. Xiamen Oamic BIOTECH Co Revenue Growth Rate in Biomanufacturing in Food and Nutrition Business (2021–2026)
Figure 93. Symrise AG Revenue Growth Rate in Biomanufacturing in Food and Nutrition Business (2021–2026)
Figure 94. JNC Corporation Revenue Growth Rate in Biomanufacturing in Food and Nutrition Business (2021–2026)
Figure 95. Perfect Day, Inc Revenue Growth Rate in Biomanufacturing in Food and Nutrition Business (2021–2026)
Figure 96. Agropur Revenue Growth Rate in Biomanufacturing in Food and Nutrition Business (2021–2026)
Figure 97. Zhejiang NHU Company Revenue Growth Rate in Biomanufacturing in Food and Nutrition Business (2021–2026)
Figure 98. Arla Foods Ingredients Revenue Growth Rate in Biomanufacturing in Food and Nutrition Business (2021–2026)
Figure 99. VTR Biotech Revenue Growth Rate in Biomanufacturing in Food and Nutrition Business (2021–2026)
Figure 100. Lushang Freda Pharmaceutical Co Revenue Growth Rate in Biomanufacturing in Food and Nutrition Business (2021–2026)
Figure 101. VACURE Biotechnology Co Revenue Growth Rate in Biomanufacturing in Food and Nutrition Business (2021–2026)
Figure 102. Chihon Biotechnology Co Revenue Growth Rate in Biomanufacturing in Food and Nutrition Business (2021–2026)
Figure 103. Qingdao Vland Biotech Revenue Growth Rate in Biomanufacturing in Food and Nutrition Business (2021–2026)
Figure 104. Hubei Guangji Pharmaceutical Revenue Growth Rate in Biomanufacturing in Food and Nutrition Business (2021–2026)
Figure 105. Yifan Pharmaceutical Revenue Growth Rate in Biomanufacturing in Food and Nutrition Business (2021–2026)
Figure 106. LCY Group Revenue Growth Rate in Biomanufacturing in Food and Nutrition Business (2021–2026)
Figure 107. Jiangxi Fushine Pharmaceutical Revenue Growth Rate in Biomanufacturing in Food and Nutrition Business (2021–2026)
Figure 108. FUJI OIL CO Revenue Growth Rate in Biomanufacturing in Food and Nutrition Business (2021–2026)
Figure 109. Bottom-up and Top-down Approaches for This Report
Figure 110. Data Triangulation
Figure 111. Key Executives Interviewed