List of Tables
Table 1. Global Terahertz Imaging Inspection Market Size Growth Rate by Type (2026-2032) & (US$ Million)
Table 2. Key Players of Passive Terahertz Imaging
Table 3. Key Players of Active Terahertz Imaging
Table 4. Global Terahertz Imaging Inspection Market Size Growth by Application (2026-2032) & (US$ Million)
Table 5. Global Terahertz Imaging Inspection Market Size by Region (2026-2032) & (US$ Million)
Table 6. Global Terahertz Imaging Inspection Market Size by Region (2026-2032) & (US$ Million)
Table 7. Global Terahertz Imaging Inspection Market Share by Region (2026-2032)
Table 8. Market Top Trends
Table 9. Market Use Cases
Table 10. Global Terahertz Imaging Inspection Revenue by Players (2026 & 2032) & (US$ Million)
Table 11. Global Terahertz Imaging Inspection Market Share by Players (2026 & 2032)
Table 12. Key Players Headquarters and Area Served
Table 13. Key Players Terahertz Imaging Inspection Product/Solution/Service
Table 14. Date of Enter into Terahertz Imaging Inspection Market
Table 15. Mergers & Acquisitions, Expansion Plans
Table 16. Global Terahertz Imaging Inspection Market Size by Type (2026-2032) & (US$ Million)
Table 17. Global Terahertz Imaging Inspection Market Size Share by Type (2026-2032)
Table 18. Global Terahertz Imaging Inspection Market Size by Application (2026-2032) & (US$ Million)
Table 19. Global Terahertz Imaging Inspection Market Size Share by Application (2026-2032)
Table 20. North America Key Players Terahertz Imaging Inspection Revenue (2026 & 2032) & (US$ Million)
Table 21. North America Key Players Terahertz Imaging Inspection Market Share (2026 & 2032)
Table 22. North America Terahertz Imaging Inspection Market Size by Type (2026-2032) & (US$ Million)
Table 23. North America Terahertz Imaging Inspection Market Share by Type (2026-2032)
Table 24. North America Terahertz Imaging Inspection Market Size by Application (2026-2032) & (US$ Million)
Table 25. North America Terahertz Imaging Inspection Market Share by Application (2026-2032)
Table 26. Europe Key Players Terahertz Imaging Inspection Revenue (2026 & 2032) & (US$ Million)
Table 27. Europe Key Players Terahertz Imaging Inspection Market Share (2026 & 2032)
Table 28. Europe Terahertz Imaging Inspection Market Size by Type (2026-2032) & (US$ Million)
Table 29. Europe Terahertz Imaging Inspection Market Share by Type (2026-2032)
Table 30. Europe Terahertz Imaging Inspection Market Size by Application (2026-2032) & (US$ Million)
Table 31. Europe Terahertz Imaging Inspection Market Share by Application (2026-2032)
Table 32. China Key Players Terahertz Imaging Inspection Revenue (2026 & 2032) & (US$ Million)
Table 33. China Key Players Terahertz Imaging Inspection Market Share (2026 & 2032)
Table 34. China Terahertz Imaging Inspection Market Size by Type (2026-2032) & (US$ Million)
Table 35. China Terahertz Imaging Inspection Market Share by Type (2026-2032)
Table 36. China Terahertz Imaging Inspection Market Size by Application (2026-2032) & (US$ Million)
Table 37. China Terahertz Imaging Inspection Market Share by Application (2026-2032)
Table 38. Key Players in Japan
Table 39. Brainware Terahertz Information Company Details
Table 40. Brainware Terahertz Information Description and Business Overview
Table 41. Brainware Terahertz Information Terahertz Imaging Inspection Product
Table 42. Brainware Terahertz Information Revenue in Terahertz Imaging Inspection Business: 2026 & 2032
Table 43. Brainware Terahertz Information Recent Development
Table 44. Advantest Corporation Company Details
Table 45. Advantest Corporation Description and Business Overview
Table 46. Advantest Corporation Terahertz Imaging Inspection Product
Table 47. Advantest Corporation Revenue in Terahertz Imaging Inspection Business: 2026 & 2032
Table 48. Advantest Corporation Recent Development
Table 49. Terasense Group Company Details
Table 50. Terasense Group Description and Business Overview
Table 51. Terasense Group Terahertz Imaging Inspection Product
Table 52. Terasense Group Revenue in Terahertz Imaging Inspection Business: 2026 & 2032
Table 53. Terasense Group Recent Development
Table 54. Toptica Photonics Company Details
Table 55. Toptica Photonics Description and Business Overview
Table 56. Toptica Photonics Terahertz Imaging Inspection Product
Table 57. Toptica Photonics Revenue in Terahertz Imaging Inspection Business: 2026 & 2032
Table 58. Toptica Photonics Recent Development
Table 59. Thruvision Company Details
Table 60. Thruvision Description and Business Overview
Table 61. Thruvision Terahertz Imaging Inspection Product
Table 62. Thruvision Revenue in Terahertz Imaging Inspection Business: 2026 & 2032
Table 63. Thruvision Recent Development
Table 64. Luna Innovations Company Details
Table 65. Luna Innovations Description and Business Overview
Table 66. Luna Innovations Terahertz Imaging Inspection Product
Table 67. Luna Innovations Revenue in Terahertz Imaging Inspection Business: 2026 & 2032
Table 68. Luna Innovations Recent Development
Table 69. TeraView Company Details
Table 70. TeraView Description and Business Overview
Table 71. TeraView Terahertz Imaging Inspection Product
Table 72. TeraView Revenue in Terahertz Imaging Inspection Business: 2026 & 2032
Table 73. TeraView Recent Development
Table 74. Menlo Systems Company Details
Table 75. Menlo Systems Description and Business Overview
Table 76. Menlo Systems Terahertz Imaging Inspection Product
Table 77. Menlo Systems Revenue in Terahertz Imaging Inspection Business: 2026 & 2032
Table 78. Menlo Systems Recent Development
Table 79. Asqella Company Details
Table 80. Asqella Description and Business Overview
Table 81. Asqella Terahertz Imaging Inspection Product
Table 82. Asqella Revenue in Terahertz Imaging Inspection Business: 2026 & 2032
Table 83. Asqella Recent Development
Table 84. Insight Product Company Details
Table 85. Insight Product Description and Business Overview
Table 86. Insight Product Terahertz Imaging Inspection Product
Table 87. Insight Product Revenue in Terahertz Imaging Inspection Business: 2026 & 2032
Table 88. Insight Product Recent Development
Table 89. MC2 Technologies Company Details
Table 90. MC2 Technologies Description and Business Overview
Table 91. MC2 Technologies Terahertz Imaging Inspection Product
Table 92. MC2 Technologies Revenue in Terahertz Imaging Inspection Business: 2026 & 2032
Table 93. MC2 Technologies Recent Development
Table 94. Terahertz Imaging Inspection Market Trends
Table 95. Terahertz Imaging Inspection Market Drivers
Table 96. Terahertz Imaging Inspection Market Challenges
Table 97. Terahertz Imaging Inspection Market Restraints
Table 98. Research Programs/Design for This Report
Table 99. Key Data Information from Secondary Sources
Table 100. Key Data Information from Primary Sources
List of Figures
Figure 1. Global Terahertz Imaging Inspection Market Share by Type in 2026 & 2032
Figure 2. Passive Terahertz Imaging Features
Figure 3. Active Terahertz Imaging Features
Figure 4. Global Terahertz Imaging Inspection Market Share by Application in 2026 & 2032
Figure 5. Transportation & Public Security Case Studies
Figure 6. Industrial Case Studies
Figure 7. Medical & Healthcare Case Studies
Figure 8. Others Case Studies
Figure 9. Terahertz Imaging Inspection Report Years Considered
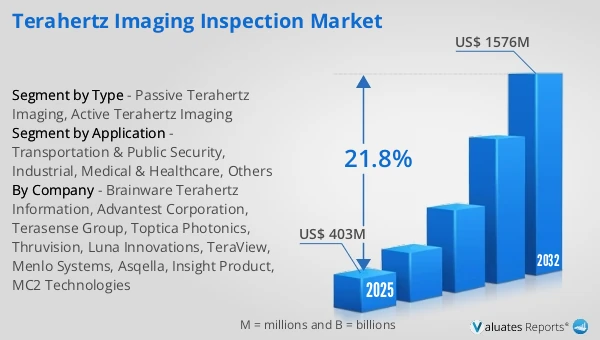
Figure 10. Global Terahertz Imaging Inspection Market Size and Growth Rate 2026-2032 (US$ Million)
Figure 11. Global Terahertz Imaging Inspection Market Share by Region (2026-2032)
Figure 12. Global Terahertz Imaging Inspection Market Size Market Share by Type (2026-2032)
Figure 13. North America Terahertz Imaging Inspection Market Size 2026-2032 (US$ Million)
Figure 14. Europe Terahertz Imaging Inspection Market Size 2026-2032 (US$ Million)
Figure 15. China Terahertz Imaging Inspection Market Size 2026-2032 (US$ Million)
Figure 16. Terahertz Imaging Inspection Market Size in Japan (2026-2032) & (US$ Million)
Figure 17. Bottom-up and Top-down Approaches for This Report
Figure 18. Data Triangulation
Figure 19. Key Executives Interviewed