
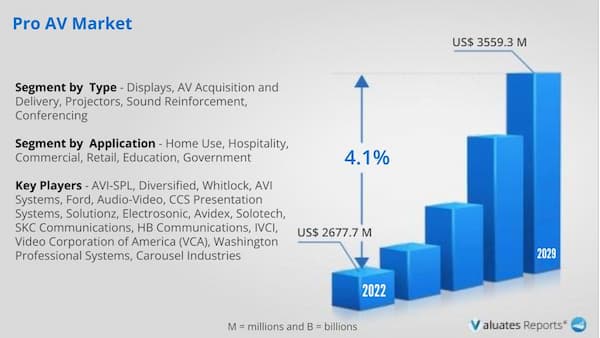
Pro AV market is projected to reach US$ 3559.3 million in 2029, increasing from US$ 2677.7 million in 2022, with the CAGR of 4.1% during the period of 2023 to 2029.
Retail, hospitality, healthcare, and transportation are just a few of the areas where digital signage has emerged as a potent marketing and communication tool. The need for professional audiovisual equipment like video walls, digital displays, and content management systems is being driven by the potential to present dynamic and interactive material to engage customers and convey information. It is anticipated that this tendency would keep fostering market expansion. With the implementation of e-learning and hybrid learning models, the educational industry is experiencing a transition. In order to provide engaging and immersive learning experiences, professional AV solutions are essential. In order to improve the quality of education, schools, colleges, and universities are investing in technology like interactive displays, lecture recording systems, and audio enhancement solutions, which is increasing Pro AV sales.
Pro AV equipment is crucial to the entertainment and hospitality sectors in order to improve consumer experiences. For concerts, events, and immersive experiences, venues, theme parks, lodging facilities, and theaters invest in top-notch audio and video equipment. Pro AV sales are expected to increase as these sectors recover from the epidemic and concentrate on improving client interaction. Pro AV systems are being adopted by the healthcare industry for telemedicine, remote consultations, and medical training. For the delivery of crystal-clear and efficient healthcare services, high-definition cameras, audio systems, and display technologies are required. The need for Pro AV equipment in healthcare settings is being driven by the continuous developments in telemedicine.
Modern conference room sets are being purchased by businesses in order to support productive meetings and presentations. Pro AV hardware in great demand includes interactive displays, video conferencing systems, and room management systems. Corporate expenditures in Pro AV technology are anticipated to rise as the importance of seamless communication and collaboration increases. To improve the spectator experience, sports stadiums are constantly updating their Pro AV equipment. In order to engage and amuse spectators during live events, high-definition screens, stadium audio systems, and immersive video displays are employed. Sales of Pro AV equipment for stadium and arena technologies are increasing as the sports and entertainment sectors aim to draw in greater crowds.
For the Pro AV Sales industry, North America is a significant centre. The region has a strong economy and a large number of technological firms, which fuels demand for Pro AV solutions in a variety of industries. The booming Pro AV market in North America is mostly due to the adoption of cutting-edge communication and collaboration technologies in the business sector, the expansion of the entertainment industry, and the rising need for healthcare AV solutions.
| Report Metric | Details |
| Report Name | Pro AV Market |
| The market size in 2021 | USD 2677.7 Million |
| The revenue forecast in 2028 | USD 2677.7 Million |
| Growth Rate | CAGR of 4.1% |
| Market size available for years | 2022-2028 |
| Forecast units | Value (USD) |
| Segments covered | Type, Application, Industry, Regions |
| Report coverage | Revenue & volume forecast, company share, competitive landscape, growth factors, and trends |
| Geographic regions covered | North America, Europe, Asia Pacific, Latin America, Middle East & Africa |
Ans. Yes, we do provide the option to buy chapters in a report. We also can customize the report based on your specific requirements.
Ans. Due to the COVID-19 pandemic, the global Pro AV market size is estimated to grow USD 2677.7 Million by 2028 with a CAGR of 4.1% during the review period.
Ans. Yes, the report includes a COVID-19 impact analysis. Also, it is further extended into every individual segment of the report.
List of Tables
    Table 1. Global Pro AV Market Size Growth Rate by Type (US$ Million): 2018 VS 2022 VS 2029
    Table 2. Key Players of Displays
    Table 3. Key Players of AV Acquisition and Delivery
    Table 4. Key Players of Projectors
    Table 5. Key Players of Sound Reinforcement
    Table 6. Key Players of Conferencing
    Table 7. Key Players of Others
    Table 8. Global Pro AV Market Size Growth by Application (US$ Million): 2018 VS 2022 VS 2029
    Table 9. Global Pro AV Market Size by Region (US$ Million): 2018 VS 2022 VS 2029
    Table 10. Global Pro AV Market Size by Region (2018-2023) & (US$ Million)
    Table 11. Global Pro AV Market Share by Region (2018-2023)
    Table 12. Global Pro AV Forecasted Market Size by Region (2024-2029) & (US$ Million)
    Table 13. Global Pro AV Market Share by Region (2024-2029)
    Table 14. Pro AV Market Trends
    Table 15. Pro AV Market Drivers
    Table 16. Pro AV Market Challenges
    Table 17. Pro AV Market Restraints
    Table 18. Global Pro AV Revenue by Players (2018-2023) & (US$ Million)
    Table 19. Global Pro AV Market Share by Players (2018-2023)
    Table 20. Global Top Pro AV Players by Company Type (Tier 1, Tier 2, and Tier 3) & (based on the Revenue in Pro AV as of 2022)
    Table 21. Ranking of Global Top Pro AV Companies by Revenue (US$ Million) in 2022
    Table 22. Global 5 Largest Players Market Share by Pro AV Revenue (CR5 and HHI) & (2018-2023)
    Table 23. Key Players Headquarters and Area Served
    Table 24. Key Players Pro AV Product Solution and Service
    Table 25. Date of Enter into Pro AV Market
    Table 26. Mergers & Acquisitions, Expansion Plans
    Table 27. Global Pro AV Market Size by Type (2018-2023) & (US$ Million)
    Table 28. Global Pro AV Revenue Market Share by Type (2018-2023)
    Table 29. Global Pro AV Forecasted Market Size by Type (2024-2029) & (US$ Million)
    Table 30. Global Pro AV Revenue Market Share by Type (2024-2029)
    Table 31. Global Pro AV Market Size by Application (2018-2023) & (US$ Million)
    Table 32. Global Pro AV Revenue Market Share by Application (2018-2023)
    Table 33. Global Pro AV Forecasted Market Size by Application (2024-2029) & (US$ Million)
    Table 34. Global Pro AV Revenue Market Share by Application (2024-2029)
    Table 35. North America Pro AV Market Size Growth Rate by Country (US$ Million): 2018 VS 2022 VS 2029
    Table 36. North America Pro AV Market Size by Country (2018-2023) & (US$ Million)
    Table 37. North America Pro AV Market Size by Country (2024-2029) & (US$ Million)
    Table 38. Europe Pro AV Market Size Growth Rate by Country (US$ Million): 2018 VS 2022 VS 2029
    Table 39. Europe Pro AV Market Size by Country (2018-2023) & (US$ Million)
    Table 40. Europe Pro AV Market Size by Country (2024-2029) & (US$ Million)
    Table 41. Asia-Pacific Pro AV Market Size Growth Rate by Region (US$ Million): 2018 VS 2022 VS 2029
    Table 42. Asia-Pacific Pro AV Market Size by Region (2018-2023) & (US$ Million)
    Table 43. Asia-Pacific Pro AV Market Size by Region (2024-2029) & (US$ Million)
    Table 44. Latin America Pro AV Market Size Growth Rate by Country (US$ Million): 2018 VS 2022 VS 2029
    Table 45. Latin America Pro AV Market Size by Country (2018-2023) & (US$ Million)
    Table 46. Latin America Pro AV Market Size by Country (2024-2029) & (US$ Million)
    Table 47. Middle East & Africa Pro AV Market Size Growth Rate by Country (US$ Million): 2018 VS 2022 VS 2029
    Table 48. Middle East & Africa Pro AV Market Size by Country (2018-2023) & (US$ Million)
    Table 49. Middle East & Africa Pro AV Market Size by Country (2024-2029) & (US$ Million)
    Table 50. AVI-SPL Company Detail
    Table 51. AVI-SPL Business Overview
    Table 52. AVI-SPL Pro AV Product
    Table 53. AVI-SPL Revenue in Pro AV Business (2018-2023) & (US$ Million)
    Table 54. AVI-SPL Recent Development
    Table 55. Diversified Company Detail
    Table 56. Diversified Business Overview
    Table 57. Diversified Pro AV Product
    Table 58. Diversified Revenue in Pro AV Business (2018-2023) & (US$ Million)
    Table 59. Diversified Recent Development
    Table 60. Whitlock Company Detail
    Table 61. Whitlock Business Overview
    Table 62. Whitlock Pro AV Product
    Table 63. Whitlock Revenue in Pro AV Business (2018-2023) & (US$ Million)
    Table 64. Whitlock Recent Development
    Table 65. AVI Systems Company Detail
    Table 66. AVI Systems Business Overview
    Table 67. AVI Systems Pro AV Product
    Table 68. AVI Systems Revenue in Pro AV Business (2018-2023) & (US$ Million)
    Table 69. AVI Systems Recent Development
    Table 70. Ford Audio-Video Company Detail
    Table 71. Ford Audio-Video Business Overview
    Table 72. Ford Audio-Video Pro AV Product
    Table 73. Ford Audio-Video Revenue in Pro AV Business (2018-2023) & (US$ Million)
    Table 74. Ford Audio-Video Recent Development
    Table 75. CCS Presentation Systems Company Detail
    Table 76. CCS Presentation Systems Business Overview
    Table 77. CCS Presentation Systems Pro AV Product
    Table 78. CCS Presentation Systems Revenue in Pro AV Business (2018-2023) & (US$ Million)
    Table 79. CCS Presentation Systems Recent Development
    Table 80. Solutionz Company Detail
    Table 81. Solutionz Business Overview
    Table 82. Solutionz Pro AV Product
    Table 83. Solutionz Revenue in Pro AV Business (2018-2023) & (US$ Million)
    Table 84. Solutionz Recent Development
    Table 85. Electrosonic Company Detail
    Table 86. Electrosonic Business Overview
    Table 87. Electrosonic Pro AV Product
    Table 88. Electrosonic Revenue in Pro AV Business (2018-2023) & (US$ Million)
    Table 89. Electrosonic Recent Development
    Table 90. Avidex Company Detail
    Table 91. Avidex Business Overview
    Table 92. Avidex Pro AV Product
    Table 93. Avidex Revenue in Pro AV Business (2018-2023) & (US$ Million)
    Table 94. Avidex Recent Development
    Table 95. Solotech Company Detail
    Table 96. Solotech Business Overview
    Table 97. Solotech Pro AV Product
    Table 98. Solotech Revenue in Pro AV Business (2018-2023) & (US$ Million)
    Table 99. Solotech Recent Development
    Table 100. SKC Communications Company Detail
    Table 101. SKC Communications Business Overview
    Table 102. SKC Communications Pro AV Product
    Table 103. SKC Communications Revenue in Pro AV Business (2018-2023) & (US$ Million)
    Table 104. SKC Communications Recent Development
    Table 105. HB Communications Company Detail
    Table 106. HB Communications Business Overview
    Table 107. HB Communications Pro AV Product
    Table 108. HB Communications Revenue in Pro AV Business (2018-2023) & (US$ Million)
    Table 109. HB Communications Recent Development
    Table 110. IVCI Company Detail
    Table 111. IVCI Business Overview
    Table 112. IVCI Pro AV Product
    Table 113. IVCI Revenue in Pro AV Business (2018-2023) & (US$ Million)
    Table 114. IVCI Recent Development
    Table 115. Video Corporation of America (VCA) Company Detail
    Table 116. Video Corporation of America (VCA) Business Overview
    Table 117. Video Corporation of America (VCA) Pro AV Product
    Table 118. Video Corporation of America (VCA) Revenue in Pro AV Business (2018-2023) & (US$ Million)
    Table 119. Video Corporation of America (VCA) Recent Development
    Table 120. Washington Professional Systems Company Detail
    Table 121. Washington Professional Systems Business Overview
    Table 122. Washington Professional Systems Pro AV Product
    Table 123. Washington Professional Systems Revenue in Pro AV Business (2018-2023) & (US$ Million)
    Table 124. Washington Professional Systems Recent Development
    Table 125. Carousel Industries Company Detail
    Table 126. Carousel Industries Business Overview
    Table 127. Carousel Industries Pro AV Product
    Table 128. Carousel Industries Revenue in Pro AV Business (2018-2023) & (US$ Million)
    Table 129. Carousel Industries Recent Development
    Table 130. Research Programs/Design for This Report
    Table 131. Key Data Information from Secondary Sources
    Table 132. Key Data Information from Primary Sources
List of Figures
    Figure 1. Global Pro AV Market Size Comparison by Type (2023-2029) & (US$ Million)
    Figure 2. Global Pro AV Market Share by Type: 2022 VS 2029
    Figure 3. Displays Features
    Figure 4. AV Acquisition and Delivery Features
    Figure 5. Projectors Features
    Figure 6. Sound Reinforcement Features
    Figure 7. Conferencing Features
    Figure 8. Others Features
    Figure 9. Global Pro AV Market Size Comparison by Application (2023-2029) & (US$ Million)
    Figure 10. Global Pro AV Market Share by Application: 2022 VS 2029
    Figure 11. Home Use Case Studies
    Figure 12. Commercial Case Studies
    Figure 13. Education Case Studies
    Figure 14. Government Case Studies
    Figure 15. Hospitality Case Studies
    Figure 16. Retail Case Studies
    Figure 17. Others Case Studies
    Figure 18. Pro AV Report Years Considered
    Figure 19. Global Pro AV Market Size (US$ Million), Year-over-Year: 2018-2029
    Figure 20. Global Pro AV Market Size, (US$ Million), 2018 VS 2022 VS 2029
    Figure 21. Global Pro AV Market Share by Region: 2022 VS 2029
    Figure 22. Global Pro AV Market Share by Players in 2022
    Figure 23. Global Top Pro AV Players by Company Type (Tier 1, Tier 2, and Tier 3) & (based on the Revenue in Pro AV as of 2022)
    Figure 24. The Top 10 and 5 Players Market Share by Pro AV Revenue in 2022
    Figure 25. North America Pro AV Market Size YoY Growth (2018-2029) & (US$ Million)
    Figure 26. North America Pro AV Market Share by Country (2018-2029)
    Figure 27. United States Pro AV Market Size YoY Growth (2018-2029) & (US$ Million)
    Figure 28. Canada Pro AV Market Size YoY Growth (2018-2029) & (US$ Million)
    Figure 29. Europe Pro AV Market Size YoY Growth (2018-2029) & (US$ Million)
    Figure 30. Europe Pro AV Market Share by Country (2018-2029)
    Figure 31. Germany Pro AV Market Size YoY Growth (2018-2029) & (US$ Million)
    Figure 32. France Pro AV Market Size YoY Growth (2018-2029) & (US$ Million)
    Figure 33. U.K. Pro AV Market Size YoY Growth (2018-2029) & (US$ Million)
    Figure 34. Italy Pro AV Market Size YoY Growth (2018-2029) & (US$ Million)
    Figure 35. Russia Pro AV Market Size YoY Growth (2018-2029) & (US$ Million)
    Figure 36. Nordic Countries Pro AV Market Size YoY Growth (2018-2029) & (US$ Million)
    Figure 37. Asia-Pacific Pro AV Market Size YoY Growth (2018-2029) & (US$ Million)
    Figure 38. Asia-Pacific Pro AV Market Share by Region (2018-2029)
    Figure 39. China Pro AV Market Size YoY Growth (2018-2029) & (US$ Million)
    Figure 40. Japan Pro AV Market Size YoY Growth (2018-2029) & (US$ Million)
    Figure 41. South Korea Pro AV Market Size YoY Growth (2018-2029) & (US$ Million)
    Figure 42. Southeast Asia Pro AV Market Size YoY Growth (2018-2029) & (US$ Million)
    Figure 43. India Pro AV Market Size YoY Growth (2018-2029) & (US$ Million)
    Figure 44. Australia Pro AV Market Size YoY Growth (2018-2029) & (US$ Million)
    Figure 45. Latin America Pro AV Market Size YoY Growth (2018-2029) & (US$ Million)
    Figure 46. Latin America Pro AV Market Share by Country (2018-2029)
    Figure 47. Mexico Pro AV Market Size YoY Growth (2018-2029) & (US$ Million)
    Figure 48. Brazil Pro AV Market Size YoY Growth (2018-2029) & (US$ Million)
    Figure 49. Middle East & Africa Pro AV Market Size YoY Growth (2018-2029) & (US$ Million)
    Figure 50. Middle East & Africa Pro AV Market Share by Country (2018-2029)
    Figure 51. Turkey Pro AV Market Size YoY Growth (2018-2029) & (US$ Million)
    Figure 52. Saudi Arabia Pro AV Market Size YoY Growth (2018-2029) & (US$ Million)
    Figure 53. AVI-SPL Revenue Growth Rate in Pro AV Business (2018-2023)
    Figure 54. Diversified Revenue Growth Rate in Pro AV Business (2018-2023)
    Figure 55. Whitlock Revenue Growth Rate in Pro AV Business (2018-2023)
    Figure 56. AVI Systems Revenue Growth Rate in Pro AV Business (2018-2023)
    Figure 57. Ford Audio-Video Revenue Growth Rate in Pro AV Business (2018-2023)
    Figure 58. CCS Presentation Systems Revenue Growth Rate in Pro AV Business (2018-2023)
    Figure 59. Solutionz Revenue Growth Rate in Pro AV Business (2018-2023)
    Figure 60. Electrosonic Revenue Growth Rate in Pro AV Business (2018-2023)
    Figure 61. Avidex Revenue Growth Rate in Pro AV Business (2018-2023)
    Figure 62. Solotech Revenue Growth Rate in Pro AV Business (2018-2023)
    Figure 63. SKC Communications Revenue Growth Rate in Pro AV Business (2018-2023)
    Figure 64. HB Communications Revenue Growth Rate in Pro AV Business (2018-2023)
    Figure 65. IVCI Revenue Growth Rate in Pro AV Business (2018-2023)
    Figure 66. Video Corporation of America (VCA) Revenue Growth Rate in Pro AV Business (2018-2023)
    Figure 67. Washington Professional Systems Revenue Growth Rate in Pro AV Business (2018-2023)
    Figure 68. Carousel Industries Revenue Growth Rate in Pro AV Business (2018-2023)
    Figure 69. Bottom-up and Top-down Approaches for This Report
    Figure 70. Data Triangulation
    Figure 71. Key Executives Interviewed
$4000
$6000
$8000
HAVE A QUERY?
OUR CUSTOMER

Add to Cart
Add to Cart
Add to Cart
Add to Cart