0
U.S. (TOLL FREE)
+1 (315) 215-3225
Automative

0
U.S. (TOLL FREE)
+1 (315) 215-3225
Global and India Manganese Dioxide Market Report & Forecast 2023-2029
Published Date: November 2023
|
Report Code: QYRE-Auto-33T15742
Home | Market Reports | Business & Industrial| Metals & Mining
Global and India Manganese Dioxide Market Report Forecast 2023 2029
BUY CHAPTERS

Global and India Manganese Dioxide Market Report & Forecast 2023-2029

Code: QYRE-Auto-33T15742
Report
November 2023
Pages:126
QYResearch
Buy Now with 15% Discount
DESCRIPTION
TABLE OF CONTENT
TABLES & FIGURES

and India Manganese Dioxide Market Size

The global Manganese Dioxide revenue was US$ 21 million in 2022 and is forecast to a readjusted size of US$ 23 million by 2029 with a CAGR of 1.6% during the forecast period (2023-2029).

and India Manganese Dioxide Market

and India Manganese Dioxide Market

Manganese dioxide is black or gray powder with the molecular formula of MnO2, can be classified into three categories, such as Electrolytic Manganese Dioxide (EMD), Natural Manganese Dioxide (NMD) and Chemical Manganese Dioxide (CMD). In this report, we study EMD, NMD and CMD.
In India, the Manganese Dioxide revenue is expected to grow from US$ million in 2022 to US$ million by 2029, at a CAGR of % during the forecast period (2023-2029).
The major players in global Manganese Dioxide market include Tosoh, ERACHEM Comilog, Guiliu Chemical, etc. The top 3 players occupy about 30% shares of the global market. China is the main market, and occupies about 50% of the global market. EMD is the main type, with a share about 55%. Batteries is the main application, which holds a share about 65%.
This report focuses on global and India Manganese Dioxide market, also covers the segmentation data of other regions in regional level and county level.
India is now the world’s most populous country. According to IMF (its July update to its World Economic Outlook), India’s GDP growth is projected at 6.1% in 2023, powered by domestic investment. First and foremost, the key factor in India's rapid economic growth is the huge supply and demand from a large population base. Demand and supply sides working in both directions to support India's economic stability.
India is a market full of opportunities, and the demand for Manganese Dioxide will continue to grow rapidly in the future.
Global Manganese Dioxide Scope and Market Size
Manganese Dioxide market is segmented in regional and country, by players, by type and by application. Companies, stakeholders, and other participants in the global Manganese Dioxide market will be able to gain the upper hand as they use the report as a powerful resource. The segmental analysis focuses on revenue and forecast by type and by application for the period 2018-2029.
For India market, this report focuses on the Manganese Dioxide market size by players, by Type and by Application, for the period 2018-2029. The key players include the global and local players, which play important roles in India.

Scope of and India Manganese Dioxide Market Report

Report Metric Details
Report Name and India Manganese Dioxide Market
Forecasted market size in 2029 US$ 23 million
CAGR 1.6%
Forecasted years 2023 - 2029
Segment by Type
  • EMD
  • NMD
  • CMD
Segment by Application
  • Batteries
  • Glass & Ceramics Industry
  • Water Treatment & Purification
  • Others
By Region
  • North America (United States, Canada)
  • Europe (Germany, France, UK, Italy, Russia) Rest of Europe
  • Nordic Countries
  • Asia-Pacific (China, Japan, South Korea)
  • Southeast Asia (India, Australia)
  • Rest of Asia
  • Latin America (Mexico, Brazil)
  • Rest of Latin America
  • Middle East & Africa (Turkey, Saudi Arabia, UAE, Rest of MEA)
By Company Tosoh, ERACHEM Comilog, Tronox Limited, Cegasa, Mesa Minerals Limited, Golden Mile GmbH, Moil, Vale, Manmohan Minerals and Chemicals, MnChemical Georgia, AUTLAN, Hunan QingChong Manganese, CITIC Dameng, Xiangtan Electrochemical, Guiliu Chemical, Guizhou Redstar, Guangxi Nonferrous Metals Group, Hunan Shunlong Energy, Weixin Manganese Industry, Hunan Jinlong Manganese Industry(CN), Kaiyuan Chemical, Mesa
Forecast units USD million in value
Report coverage Revenue and volume forecast, company share, competitive landscape, growth factors and trends

FAQ for this report

What is the and India Manganese Dioxide Market size in 2029?

Ans: The and India Manganese Dioxide Market size in 2029 will be US$ 23 million.

What is the market share of major companies in and India Manganese Dioxide Market?

Ans: The top 3 players occupy about 30% shares of the global market.

What is the and India Manganese Dioxide Market share by region?

Ans: China is the main market, and occupies about 50% of the global market. According to IMF (its July update to its World Economic Outlook), India’s GDP growth is projected at 6.1% in 2023, powered by domestic investment.

What is the and India Manganese Dioxide Market share by type?

Ans: EMD is the main type, with a share about 55%.

What is the and India Manganese Dioxide Market share by application?

Ans: Batteries is the main application, which holds a share about 65%.

Who are the main players in the and India Manganese Dioxide Market report?

Ans: The main players in the and India Manganese Dioxide Market are Tosoh, ERACHEM Comilog, Tronox Limited, Cegasa, Mesa Minerals Limited, Golden Mile GmbH, Moil, Vale, Manmohan Minerals and Chemicals, MnChemical Georgia, AUTLAN, Hunan QingChong Manganese, CITIC Dameng, Xiangtan Electrochemical, Guiliu Chemical, Guizhou Redstar, Guangxi Nonferrous Metals Group, Hunan Shunlong Energy, Weixin Manganese Industry, Hunan Jinlong Manganese Industry(CN), Kaiyuan Chemical, Mesa

What are the Application segmentation covered in the and India Manganese Dioxide Market report?

Ans: The Applications covered in the and India Manganese Dioxide Market report are Batteries, Glass & Ceramics Industry, Water Treatment & Purification, Others

What are the Type segmentation covered in the and India Manganese Dioxide Market report?

Ans: The Types covered in the and India Manganese Dioxide Market report are EMD, NMD, CMD

1 Study Coverage
1.1 Manganese Dioxide Product Introduction
1.2 Global Manganese Dioxide Outlook 2018 VS 2022 VS 2029
1.2.1 Global Manganese Dioxide Sales in US$ Million for the Year 2018-2029
1.2.2 Global Manganese Dioxide Sales in Volume for the Year 2018-2029
1.3 India Manganese Dioxide Outlook 2018 VS 2022 VS 2029
1.3.1 India Manganese Dioxide Sales in US$ Million for the Year 2018-2029
1.3.2 India Manganese Dioxide Sales in Volume for the Year 2018-2029
1.4 Manganese Dioxide Market Size, India VS Global, 2018 VS 2022 VS 2029
1.4.1 The Market Share of India Manganese Dioxide in Global, 2018 VS 2022 VS 2029
1.4.2 The Growth Rate of Manganese Dioxide Market Size, India VS Global, 2018 VS 2022 VS 2029
1.5 Manganese Dioxide Market Dynamics
1.5.1 Manganese Dioxide Industry Trends
1.5.2 Manganese Dioxide Market Drivers
1.5.3 Manganese Dioxide Market Challenges
1.5.4 Manganese Dioxide Market Restraints
1.6 Study Objectives
1.7 Years Considered
1.8 Years Considered
2 Manganese Dioxide by Type
2.1 Manganese Dioxide Market Segment by Type
2.1.1 EMD
2.1.2 NMD
2.1.3 CMD
2.2 Global Manganese Dioxide Market Size by Type
2.2.1 Global Manganese Dioxide Sales in Value, by Type (2018, 2022 & 2029)
2.2.2 Global Manganese Dioxide Sales in Volume, by Type (2018, 2022 & 2029)
2.2.3 Global Manganese Dioxide Average Selling Price (ASP) by Type (2018, 2022 & 2029)
2.3 India Manganese Dioxide Market Size by Type
2.3.1 India Manganese Dioxide Sales in Value, by Type (2018, 2022 & 2029)
2.3.2 India Manganese Dioxide Sales in Volume, by Type (2018, 2022 & 2029)
2.3.3 India Manganese Dioxide Average Selling Price (ASP) by Type (2018, 2022 & 2029)
3 Manganese Dioxide by Application
3.1 Manganese Dioxide Market Segment by Application
3.1.1 Batteries
3.1.2 Glass & Ceramics Industry
3.1.3 Water Treatment & Purification
3.1.4 Others
3.2 Global Manganese Dioxide Market Size by Application
3.2.1 Global Manganese Dioxide Sales in Value, by Application (2018, 2022 & 2029)
3.2.2 Global Manganese Dioxide Sales in Volume, by Application (2018, 2022 & 2029)
3.3.3 Global Manganese Dioxide Average Selling Price (ASP) by Application (2018, 2022 & 2029)
3.3 India Manganese Dioxide Market Size by Application
3.3.1 India Manganese Dioxide Sales in Value, by Application (2018, 2022 & 2029)
3.3.2 India Manganese Dioxide Sales in Volume, by Application (2018, 2022 & 2029)
3.3.3 India Manganese Dioxide Average Selling Price (ASP) by Application (2018, 2022 & 2029)
4 Global Manganese Dioxide Competitor Landscape by Company
4.1 Global Manganese Dioxide Market Size by Company
4.1.1 Global Key Manufacturers of Manganese Dioxide, Ranked by Revenue (2022)
4.1.2 Global Manganese Dioxide Revenue by Manufacturer (2018-2023)
4.1.3 Global Manganese Dioxide Sales by Manufacturer (2018-2023)
4.1.4 Global Manganese Dioxide Price by Manufacturer (2018-2023)
4.2 Global Manganese Dioxide Concentration Ratio (CR)
4.2.1 Manganese Dioxide Market Concentration Ratio (CR)
4.2.2 Global Top 5 and Top 10 Largest Manufacturers of Manganese Dioxide in 2022
4.2.3 Global Manganese Dioxide Market Share by Company Type (Tier 1, Tier 2, and Tier 3)
4.3 Global Key Manufacturers of Manganese Dioxide, Manufacturing Base Distribution and Headquarters
4.4 Global Key Manufacturers of Manganese Dioxide, Product Offered and Application
4.5 Global Key Manufacturers of Manganese Dioxide, Date of Enter into This Industry
4.6 Manufacturers Mergers & Acquisitions, Expansion Plans
4.7 India Manganese Dioxide Market Size by Company
4.7.1 Key Players of Manganese Dioxide in India, Ranked by Revenue (2022)
4.7.2 India Manganese Dioxide Revenue by Players (2018-2023)
4.7.3 India Manganese Dioxide Sales by Players (2018-2023)
5 Global Manganese Dioxide Market Size by Region
5.1 Global Manganese Dioxide Market Size by Region: 2018 VS 2022 VS 2029
5.2 Global Manganese Dioxide Market Size in Volume by Region (2018-2029)
5.2.1 Global Manganese Dioxide Sales in Volume by Region: 2018-2023
5.2.2 Global Manganese Dioxide Sales in Volume Forecast by Region (2024-2029)
5.3 Global Manganese Dioxide Market Size in Value by Region (2018-2029)
5.3.1 Global Manganese Dioxide Sales in Value by Region: 2018-2023
5.3.2 Global Manganese Dioxide Sales in Value by Region: 2024-2029
6 Americas
6.1 Americas Manganese Dioxide Market Size YoY Growth 2018-2029
6.2 Americas Manganese Dioxide Sales in Volume, by Type (2018, 2022 & 2029)
6.3 Americas Manganese Dioxide Sales in Volume, by Application (2018, 2022 & 2029)
6.4 Americas Manganese Dioxide Market Facts & Figures by Country (2018, 2022 & 2029)
6.4.1 Americas Manganese Dioxide Sales in Value by Country (2018, 2022 & 2029)
6.4.2 Americas Manganese Dioxide Sales in Volume by Country (2018, 2022 & 2029)
6.4.3 United States
6.4.4 Canada
6.4.5 Mexico
6.4.6 Brazil
7 EMEA
7.1 EMEA Manganese Dioxide Market Size YoY Growth 2018-2029
7.2 EMEA Manganese Dioxide Sales in Volume, by Type (2018, 2022 & 2029)
7.3 EMEA Manganese Dioxide Sales in Volume, by Application (2018, 2022 & 2029)
7.4 EMEA Manganese Dioxide Market Facts & Figures by Country (2018, 2022 & 2029)
7.4.1 EMEA Manganese Dioxide Sales in Value by Country (2018, 2022 & 2029)
7.4.2 EMEA Manganese Dioxide Sales in Volume by Country (2018, 2022 & 2029)
7.4.3 Europe
7.4.4 Middle East
7.4.5 Africa
8 China
8.1 China Manganese Dioxide Market Size YoY Growth 2018-2029
8.2 China Manganese Dioxide Sales in Volume, by Type (2018, 2022 & 2029)
8.3 China Manganese Dioxide Sales in Volume, by Application (2018, 2022 & 2029)
9 APAC
9.1 APAC Manganese Dioxide Market Size YoY Growth 2018-2029
9.2 APAC Manganese Dioxide Sales in Volume, by Type (2018, 2022 & 2029)
9.3 APAC Manganese Dioxide Sales in Volume, by Application (2018, 2022 & 2029)
9.4 APAC Manganese Dioxide Market Facts & Figures by Region (2018, 2022 & 2029)
9.4.1 APAC Manganese Dioxide Sales in Value by Region (2018, 2022 & 2029)
9.4.2 APAC Manganese Dioxide Sales in Volume by Region (2018, 2022 & 2029)
9.4.3 Japan
9.4.4 South Korea
9.4.5 China Taiwan
9.4.6 Southeast Asia
9.4.7 India
10 Company Profiles
10.1 Tosoh
10.1.1 Tosoh Company Information
10.1.2 Tosoh Description and Business Overview
10.1.3 Tosoh Manganese Dioxide Sales, Revenue and Gross Margin (2018-2023)
10.1.4 Tosoh Manganese Dioxide Products Offered
10.1.5 Tosoh Recent Development
10.2 ERACHEM Comilog
10.2.1 ERACHEM Comilog Company Information
10.2.2 ERACHEM Comilog Description and Business Overview
10.2.3 ERACHEM Comilog Manganese Dioxide Sales, Revenue and Gross Margin (2018-2023)
10.2.4 ERACHEM Comilog Manganese Dioxide Products Offered
10.2.5 ERACHEM Comilog Recent Development
10.3 Tronox Limited
10.3.1 Tronox Limited Company Information
10.3.2 Tronox Limited Description and Business Overview
10.3.3 Tronox Limited Manganese Dioxide Sales, Revenue and Gross Margin (2018-2023)
10.3.4 Tronox Limited Manganese Dioxide Products Offered
10.3.5 Tronox Limited Recent Development
10.4 Cegasa
10.4.1 Cegasa Company Information
10.4.2 Cegasa Description and Business Overview
10.4.3 Cegasa Manganese Dioxide Sales, Revenue and Gross Margin (2018-2023)
10.4.4 Cegasa Manganese Dioxide Products Offered
10.4.5 Cegasa Recent Development
10.5 Mesa Minerals Limited
10.5.1 Mesa Minerals Limited Company Information
10.5.2 Mesa Minerals Limited Description and Business Overview
10.5.3 Mesa Minerals Limited Manganese Dioxide Sales, Revenue and Gross Margin (2018-2023)
10.5.4 Mesa Minerals Limited Manganese Dioxide Products Offered
10.5.5 Mesa Minerals Limited Recent Development
10.6 Golden Mile GmbH
10.6.1 Golden Mile GmbH Company Information
10.6.2 Golden Mile GmbH Description and Business Overview
10.6.3 Golden Mile GmbH Manganese Dioxide Sales, Revenue and Gross Margin (2018-2023)
10.6.4 Golden Mile GmbH Manganese Dioxide Products Offered
10.6.5 Golden Mile GmbH Recent Development
10.7 Moil
10.7.1 Moil Company Information
10.7.2 Moil Description and Business Overview
10.7.3 Moil Manganese Dioxide Sales, Revenue and Gross Margin (2018-2023)
10.7.4 Moil Manganese Dioxide Products Offered
10.7.5 Moil Recent Development
10.8 Vale
10.8.1 Vale Company Information
10.8.2 Vale Description and Business Overview
10.8.3 Vale Manganese Dioxide Sales, Revenue and Gross Margin (2018-2023)
10.8.4 Vale Manganese Dioxide Products Offered
10.8.5 Vale Recent Development
10.9 Manmohan Minerals and Chemicals
10.9.1 Manmohan Minerals and Chemicals Company Information
10.9.2 Manmohan Minerals and Chemicals Description and Business Overview
10.9.3 Manmohan Minerals and Chemicals Manganese Dioxide Sales, Revenue and Gross Margin (2018-2023)
10.9.4 Manmohan Minerals and Chemicals Manganese Dioxide Products Offered
10.9.5 Manmohan Minerals and Chemicals Recent Development
10.10 MnChemical Georgia
10.10.1 MnChemical Georgia Company Information
10.10.2 MnChemical Georgia Description and Business Overview
10.10.3 MnChemical Georgia Manganese Dioxide Sales, Revenue and Gross Margin (2018-2023)
10.10.4 MnChemical Georgia Manganese Dioxide Products Offered
10.10.5 MnChemical Georgia Recent Development
10.11 AUTLAN
10.11.1 AUTLAN Company Information
10.11.2 AUTLAN Description and Business Overview
10.11.3 AUTLAN Manganese Dioxide Sales, Revenue and Gross Margin (2018-2023)
10.11.4 AUTLAN Manganese Dioxide Products Offered
10.11.5 AUTLAN Recent Development
10.12 Hunan QingChong Manganese
10.12.1 Hunan QingChong Manganese Company Information
10.12.2 Hunan QingChong Manganese Description and Business Overview
10.12.3 Hunan QingChong Manganese Manganese Dioxide Sales, Revenue and Gross Margin (2018-2023)
10.12.4 Hunan QingChong Manganese Manganese Dioxide Products Offered
10.12.5 Hunan QingChong Manganese Recent Development
10.13 CITIC Dameng
10.13.1 CITIC Dameng Company Information
10.13.2 CITIC Dameng Description and Business Overview
10.13.3 CITIC Dameng Manganese Dioxide Sales, Revenue and Gross Margin (2018-2023)
10.13.4 CITIC Dameng Manganese Dioxide Products Offered
10.13.5 CITIC Dameng Recent Development
10.14 Xiangtan Electrochemical
10.14.1 Xiangtan Electrochemical Company Information
10.14.2 Xiangtan Electrochemical Description and Business Overview
10.14.3 Xiangtan Electrochemical Manganese Dioxide Sales, Revenue and Gross Margin (2018-2023)
10.14.4 Xiangtan Electrochemical Manganese Dioxide Products Offered
10.14.5 Xiangtan Electrochemical Recent Development
10.15 Guiliu Chemical
10.15.1 Guiliu Chemical Company Information
10.15.2 Guiliu Chemical Description and Business Overview
10.15.3 Guiliu Chemical Manganese Dioxide Sales, Revenue and Gross Margin (2018-2023)
10.15.4 Guiliu Chemical Manganese Dioxide Products Offered
10.15.5 Guiliu Chemical Recent Development
10.16 Guizhou Redstar
10.16.1 Guizhou Redstar Company Information
10.16.2 Guizhou Redstar Description and Business Overview
10.16.3 Guizhou Redstar Manganese Dioxide Sales, Revenue and Gross Margin (2018-2023)
10.16.4 Guizhou Redstar Manganese Dioxide Products Offered
10.16.5 Guizhou Redstar Recent Development
10.17 Guangxi Nonferrous Metals Group
10.17.1 Guangxi Nonferrous Metals Group Company Information
10.17.2 Guangxi Nonferrous Metals Group Description and Business Overview
10.17.3 Guangxi Nonferrous Metals Group Manganese Dioxide Sales, Revenue and Gross Margin (2018-2023)
10.17.4 Guangxi Nonferrous Metals Group Manganese Dioxide Products Offered
10.17.5 Guangxi Nonferrous Metals Group Recent Development
10.18 Hunan Shunlong Energy
10.18.1 Hunan Shunlong Energy Company Information
10.18.2 Hunan Shunlong Energy Description and Business Overview
10.18.3 Hunan Shunlong Energy Manganese Dioxide Sales, Revenue and Gross Margin (2018-2023)
10.18.4 Hunan Shunlong Energy Manganese Dioxide Products Offered
10.18.5 Hunan Shunlong Energy Recent Development
10.19 Weixin Manganese Industry
10.19.1 Weixin Manganese Industry Company Information
10.19.2 Weixin Manganese Industry Description and Business Overview
10.19.3 Weixin Manganese Industry Manganese Dioxide Sales, Revenue and Gross Margin (2018-2023)
10.19.4 Weixin Manganese Industry Manganese Dioxide Products Offered
10.19.5 Weixin Manganese Industry Recent Development
10.20 Hunan Jinlong Manganese Industry(CN)
10.20.1 Hunan Jinlong Manganese Industry(CN) Company Information
10.20.2 Hunan Jinlong Manganese Industry(CN) Description and Business Overview
10.20.3 Hunan Jinlong Manganese Industry(CN) Manganese Dioxide Sales, Revenue and Gross Margin (2018-2023)
10.20.4 Hunan Jinlong Manganese Industry(CN) Manganese Dioxide Products Offered
10.20.5 Hunan Jinlong Manganese Industry(CN) Recent Development
10.21 Kaiyuan Chemical
10.21.1 Kaiyuan Chemical Company Information
10.21.2 Kaiyuan Chemical Description and Business Overview
10.21.3 Kaiyuan Chemical Manganese Dioxide Sales, Revenue and Gross Margin (2018-2023)
10.21.4 Kaiyuan Chemical Manganese Dioxide Products Offered
10.21.5 Kaiyuan Chemical Recent Development
10.22 Mesa
10.22.1 Mesa Company Information
10.22.2 Mesa Description and Business Overview
10.22.3 Mesa Manganese Dioxide Sales, Revenue and Gross Margin (2018-2023)
10.22.4 Mesa Manganese Dioxide Products Offered
10.22.5 Mesa Recent Development
11 Industry Chain and Sales Channels Analysis
11.1 Manganese Dioxide Industry Chain Analysis
11.2 Manganese Dioxide Key Raw Materials
11.2.1 Key Raw Materials
11.2.2 Raw Materials Key Suppliers
11.3 Manganese Dioxide Production Mode & Process
11.4 Manganese Dioxide Sales and Marketing
11.4.1 Manganese Dioxide Sales Channels
11.4.2 Manganese Dioxide Distributors
11.5 Manganese Dioxide Customers
12 Research Findings and Conclusion
13 Appendix
13.1 Research Methodology
13.1.1 Methodology/Research Approach
13.1.2 Data Source
13.2 Author Details
13.3 Disclaimer
List of Tables
    Table 1. Manganese Dioxide CAGR in Value, India VS Global, 2018 VS 2022 VS 2029
    Table 2. Manganese Dioxide Market Trends
    Table 3. Manganese Dioxide Market Drivers
    Table 4. Manganese Dioxide Market Challenges
    Table 5. Manganese Dioxide Market Restraints
    Table 6. Global Manganese Dioxide Sales Growth Rate (CAGR) by Type: 2018 VS 2022 VS 2029 (US$ Million)
    Table 7. India Manganese Dioxide Sales Growth Rate (CAGR) by Type: 2018 VS 2022 VS 2029 (US$ Million)
    Table 8. Global Manganese Dioxide Sales Growth Rate (CAGR) by Application: 2018 VS 2022 VS 2029 (US$ Million)
    Table 9. India Manganese Dioxide Sales Growth Rate (CAGR) by Application: 2018 VS 2022 VS 2029 (US$ Million)
    Table 10. Global Key Manufacturers of Manganese Dioxide, Ranked by Revenue (2022) & (US$ Million)
    Table 11. Global Manganese Dioxide Revenue by Manufacturer, (US$ Million), 2018-2023
    Table 12. Global Manganese Dioxide Revenue Share by Manufacturer, 2018-2023
    Table 13. Global Manganese Dioxide Sales by Manufacturer, (K MT), 2018-2023
    Table 14. Global Manganese Dioxide Sales Share by Manufacturer, 2018-2023
    Table 15. Global Manganese Dioxide Price by Manufacturer (2018-2023) & (USD/MT)
    Table 16. Global Manganese Dioxide Manufacturers Market Concentration Ratio (CR5 and HHI)
    Table 17. Global Manganese Dioxide by Company Type (Tier 1, Tier 2, and Tier 3) & (based on the Revenue in Manganese Dioxide as of 2022)
    Table 18. Global Key Manufacturers of Manganese Dioxide, Manufacturing Base Distribution and Headquarters
    Table 19. Global Key Manufacturers of Manganese Dioxide, Product Offered and Application
    Table 20. Global Key Manufacturers of Manganese Dioxide, Date of Enter into This Industry
    Table 21. Manufacturers Mergers & Acquisitions, Expansion Plans
    Table 22. Key Players of Manganese Dioxide in India, Ranked by Revenue (2022) & (US$ million)
    Table 23. India Manganese Dioxide Revenue by Players, (US$ Million), (2018-2023)
    Table 24. India Manganese Dioxide Revenue Share by Players, (2018-2023)
    Table 25. India Manganese Dioxide Sales by Players, (K MT), (2018-2023)
    Table 26. India Manganese Dioxide Sales Share by Players, (2018-2023)
    Table 27. Global Manganese Dioxide Market Size Growth Rate (CAGR) by Region (US$ Million): 2018 VS 2022 VS 2029
    Table 28. Global Manganese Dioxide Sales in Volume by Region (2018-2023) & (K MT)
    Table 29. Global Manganese Dioxide Sales in Volume Forecast by Region (2024-2029) & (K MT)
    Table 30. Global Manganese Dioxide Sales in Value by Region (2018-2023) & (US$ Million)
    Table 31. Global Manganese Dioxide Sales in Value Forecast by Region (2024-2029) & (US$ Million)
    Table 32. Americas Manganese Dioxide Market Size Growth Rate (CAGR) by Country (US$ Million): 2018 VS 2022 VS 2029
    Table 33. Americas Manganese Dioxide Sales in Value by Country (2018-2023) & (US$ Million)
    Table 34. Americas Manganese Dioxide Sales in Value by Country (2024-2029) & (US$ Million)
    Table 35. Americas Manganese Dioxide Sales in Volume by Country (2018-2023) & (K MT)
    Table 36. Americas Manganese Dioxide Sales in Volume by Country (2024-2029) & (K MT)
    Table 37. EMEA Manganese Dioxide Market Size Growth Rate (CAGR) by Country (US$ Million): 2018 VS 2022 VS 2029
    Table 38. EMEA Manganese Dioxide Sales in Value by Country (2018-2023) & (US$ Million)
    Table 39. EMEA Manganese Dioxide Sales in Value by Country (2024-2029) & (US$ Million)
    Table 40. EMEA Manganese Dioxide Sales in Volume by Country (2018-2023) & (K MT)
    Table 41. EMEA Manganese Dioxide Sales in Volume by Country (2024-2029) & (K MT)
    Table 42. APAC Manganese Dioxide Market Size Growth Rate (CAGR) by Country (US$ Million): 2018 VS 2022 VS 2029
    Table 43. APAC Manganese Dioxide Sales in Value by Country (2018-2023) & (US$ Million)
    Table 44. APAC Manganese Dioxide Sales in Value by Country (2024-2029) & (US$ Million)
    Table 45. APAC Manganese Dioxide Sales in Volume by Country (2018-2023) & (K MT)
    Table 46. APAC Manganese Dioxide Sales in Volume by Country (2024-2029) & (K MT)
    Table 47. Tosoh Company Information
    Table 48. Tosoh Description and Business Overview
    Table 49. Tosoh Manganese Dioxide Sales (K MT), Revenue (US$ Million), Price (USD/MT) and Gross Margin (2018-2023)
    Table 50. Tosoh Manganese Dioxide Product
    Table 51. Tosoh Recent Development
    Table 52. ERACHEM Comilog Company Information
    Table 53. ERACHEM Comilog Description and Business Overview
    Table 54. ERACHEM Comilog Manganese Dioxide Sales (K MT), Revenue (US$ Million), Price (USD/MT) and Gross Margin (2018-2023)
    Table 55. ERACHEM Comilog Manganese Dioxide Product
    Table 56. ERACHEM Comilog Recent Development
    Table 57. Tronox Limited Company Information
    Table 58. Tronox Limited Description and Business Overview
    Table 59. Tronox Limited Manganese Dioxide Sales (K MT), Revenue (US$ Million), Price (USD/MT) and Gross Margin (2018-2023)
    Table 60. Tronox Limited Manganese Dioxide Product
    Table 61. Tronox Limited Recent Development
    Table 62. Cegasa Company Information
    Table 63. Cegasa Description and Business Overview
    Table 64. Cegasa Manganese Dioxide Sales (K MT), Revenue (US$ Million), Price (USD/MT) and Gross Margin (2018-2023)
    Table 65. Cegasa Manganese Dioxide Product
    Table 66. Cegasa Recent Development
    Table 67. Mesa Minerals Limited Company Information
    Table 68. Mesa Minerals Limited Description and Business Overview
    Table 69. Mesa Minerals Limited Manganese Dioxide Sales (K MT), Revenue (US$ Million), Price (USD/MT) and Gross Margin (2018-2023)
    Table 70. Mesa Minerals Limited Manganese Dioxide Product
    Table 71. Mesa Minerals Limited Recent Development
    Table 72. Golden Mile GmbH Company Information
    Table 73. Golden Mile GmbH Description and Business Overview
    Table 74. Golden Mile GmbH Manganese Dioxide Sales (K MT), Revenue (US$ Million), Price (USD/MT) and Gross Margin (2018-2023)
    Table 75. Golden Mile GmbH Manganese Dioxide Product
    Table 76. Golden Mile GmbH Recent Development
    Table 77. Moil Company Information
    Table 78. Moil Description and Business Overview
    Table 79. Moil Manganese Dioxide Sales (K MT), Revenue (US$ Million), Price (USD/MT) and Gross Margin (2018-2023)
    Table 80. Moil Manganese Dioxide Product
    Table 81. Moil Recent Development
    Table 82. Vale Company Information
    Table 83. Vale Description and Business Overview
    Table 84. Vale Manganese Dioxide Sales (K MT), Revenue (US$ Million), Price (USD/MT) and Gross Margin (2018-2023)
    Table 85. Vale Manganese Dioxide Product
    Table 86. Vale Recent Development
    Table 87. Manmohan Minerals and Chemicals Company Information
    Table 88. Manmohan Minerals and Chemicals Description and Business Overview
    Table 89. Manmohan Minerals and Chemicals Manganese Dioxide Sales (K MT), Revenue (US$ Million), Price (USD/MT) and Gross Margin (2018-2023)
    Table 90. Manmohan Minerals and Chemicals Manganese Dioxide Product
    Table 91. Manmohan Minerals and Chemicals Recent Development
    Table 92. MnChemical Georgia Company Information
    Table 93. MnChemical Georgia Description and Business Overview
    Table 94. MnChemical Georgia Manganese Dioxide Sales (K MT), Revenue (US$ Million), Price (USD/MT) and Gross Margin (2018-2023)
    Table 95. MnChemical Georgia Manganese Dioxide Product
    Table 96. MnChemical Georgia Recent Development
    Table 97. AUTLAN Company Information
    Table 98. AUTLAN Description and Business Overview
    Table 99. AUTLAN Manganese Dioxide Sales (K MT), Revenue (US$ Million), Price (USD/MT) and Gross Margin (2018-2023)
    Table 100. AUTLAN Manganese Dioxide Product
    Table 101. AUTLAN Recent Development
    Table 102. Hunan QingChong Manganese Company Information
    Table 103. Hunan QingChong Manganese Description and Business Overview
    Table 104. Hunan QingChong Manganese Manganese Dioxide Sales (K MT), Revenue (US$ Million), Price (USD/MT) and Gross Margin (2018-2023)
    Table 105. Hunan QingChong Manganese Manganese Dioxide Product
    Table 106. Hunan QingChong Manganese Recent Development
    Table 107. CITIC Dameng Company Information
    Table 108. CITIC Dameng Description and Business Overview
    Table 109. CITIC Dameng Manganese Dioxide Sales (K MT), Revenue (US$ Million), Price (USD/MT) and Gross Margin (2018-2023)
    Table 110. CITIC Dameng Manganese Dioxide Product
    Table 111. CITIC Dameng Recent Development
    Table 112. Xiangtan Electrochemical Company Information
    Table 113. Xiangtan Electrochemical Description and Business Overview
    Table 114. Xiangtan Electrochemical Manganese Dioxide Sales (K MT), Revenue (US$ Million), Price (USD/MT) and Gross Margin (2018-2023)
    Table 115. Xiangtan Electrochemical Manganese Dioxide Product
    Table 116. Xiangtan Electrochemical Recent Development
    Table 117. Guiliu Chemical Company Information
    Table 118. Guiliu Chemical Description and Business Overview
    Table 119. Guiliu Chemical Manganese Dioxide Sales (K MT), Revenue (US$ Million), Price (USD/MT) and Gross Margin (2018-2023)
    Table 120. Guiliu Chemical Manganese Dioxide Product
    Table 121. Guiliu Chemical Recent Development
    Table 122. Guizhou Redstar Company Information
    Table 123. Guizhou Redstar Description and Business Overview
    Table 124. Guizhou Redstar Manganese Dioxide Sales (K MT), Revenue (US$ Million), Price (USD/MT) and Gross Margin (2018-2023)
    Table 125. Guizhou Redstar Manganese Dioxide Product
    Table 126. Guizhou Redstar Recent Development
    Table 127. Guangxi Nonferrous Metals Group Company Information
    Table 128. Guangxi Nonferrous Metals Group Description and Business Overview
    Table 129. Guangxi Nonferrous Metals Group Manganese Dioxide Sales (K MT), Revenue (US$ Million), Price (USD/MT) and Gross Margin (2018-2023)
    Table 130. Guangxi Nonferrous Metals Group Manganese Dioxide Product
    Table 131. Guangxi Nonferrous Metals Group Recent Development
    Table 132. Hunan Shunlong Energy Company Information
    Table 133. Hunan Shunlong Energy Description and Business Overview
    Table 134. Hunan Shunlong Energy Manganese Dioxide Sales (K MT), Revenue (US$ Million), Price (USD/MT) and Gross Margin (2018-2023)
    Table 135. Hunan Shunlong Energy Manganese Dioxide Product
    Table 136. Hunan Shunlong Energy Recent Development
    Table 137. Weixin Manganese Industry Company Information
    Table 138. Weixin Manganese Industry Description and Business Overview
    Table 139. Weixin Manganese Industry Manganese Dioxide Sales (K MT), Revenue (US$ Million), Price (USD/MT) and Gross Margin (2018-2023)
    Table 140. Weixin Manganese Industry Manganese Dioxide Product
    Table 141. Weixin Manganese Industry Recent Development
    Table 142. Hunan Jinlong Manganese Industry(CN) Company Information
    Table 143. Hunan Jinlong Manganese Industry(CN) Description and Business Overview
    Table 144. Hunan Jinlong Manganese Industry(CN) Manganese Dioxide Sales (K MT), Revenue (US$ Million), Price (USD/MT) and Gross Margin (2018-2023)
    Table 145. Hunan Jinlong Manganese Industry(CN) Manganese Dioxide Product
    Table 146. Hunan Jinlong Manganese Industry(CN) Recent Development
    Table 147. Kaiyuan Chemical Company Information
    Table 148. Kaiyuan Chemical Description and Business Overview
    Table 149. Kaiyuan Chemical Manganese Dioxide Sales (K MT), Revenue (US$ Million), Price (USD/MT) and Gross Margin (2018-2023)
    Table 150. Kaiyuan Chemical Manganese Dioxide Product
    Table 151. Kaiyuan Chemical Recent Development
    Table 152. Mesa Company Information
    Table 153. Mesa Description and Business Overview
    Table 154. Mesa Manganese Dioxide Sales (K MT), Revenue (US$ Million), Price (USD/MT) and Gross Margin (2018-2023)
    Table 155. Mesa Manganese Dioxide Product
    Table 156. Mesa Recent Development
    Table 157. Key Raw Materials Lists
    Table 158. Raw Materials Key Suppliers Lists
    Table 159. Manganese Dioxide Customers List
    Table 160. Manganese Dioxide Distributors List
    Table 161. Research Programs/Design for This Report
    Table 162. Key Data Information from Secondary Sources
    Table 163. Key Data Information from Primary Sources
List of Figures
    Figure 1. Manganese Dioxide Product Picture
    Figure 2. Global Manganese Dioxide Revenue, (US$ Million), 2018 VS 2022 VS 2029
    Figure 3. Global Manganese Dioxide Market Size 2018-2029 (US$ Million)
    Figure 4. Global Manganese Dioxide Sales 2018-2029 (K MT)
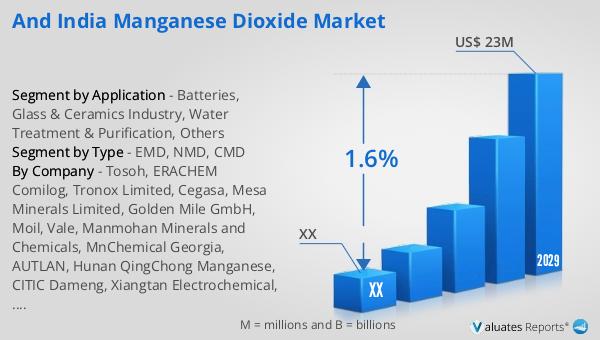
    Figure 5. India Manganese Dioxide Revenue, (US$ Million), 2018 VS 2022 VS 2029
    Figure 6. India Manganese Dioxide Market Size 2018-2029 (US$ Million)
    Figure 7. India Manganese Dioxide Sales 2018-2029 (K MT)
    Figure 8. India Manganese Dioxide Market Share in Global, in Value (US$ Million) 2018-2029
    Figure 9. India Manganese Dioxide Market Share in Global, in Volume (K MT) 2018-2029
    Figure 10. Manganese Dioxide Report Years Considered
    Figure 11. Product Picture of EMD
    Figure 12. Product Picture of NMD
    Figure 13. Product Picture of CMD
    Figure 14. Global Manganese Dioxide Market Share by Type in 2022 & 2029
    Figure 15. Global Manganese Dioxide Sales in Value by Type (2018-2029) & (US$ Million)
    Figure 16. Global Manganese Dioxide Sales Market Share in Value by Type (2018-2029)
    Figure 17. Global Manganese Dioxide Sales by Type (2018-2029) & (K MT)
    Figure 18. Global Manganese Dioxide Sales Market Share in Volume by Type (2018-2029)
    Figure 19. Global Manganese Dioxide Price by Type (2018-2029) & (USD/MT)
    Figure 20. India Manganese Dioxide Market Share by Type in 2022 & 2029
    Figure 21. India Manganese Dioxide Sales in Value by Type (2018-2029) & (US$ Million)
    Figure 22. India Manganese Dioxide Sales Market Share in Value by Type (2018-2029)
    Figure 23. India Manganese Dioxide Sales by Type (2018-2029) & (K MT)
    Figure 24. India Manganese Dioxide Sales Market Share in Volume by Type (2018-2029)
    Figure 25. India Manganese Dioxide Price by Type (2018-2029) & (USD/MT)
    Figure 26. Product Picture of Batteries
    Figure 27. Product Picture of Glass & Ceramics Industry
    Figure 28. Product Picture of Water Treatment & Purification
    Figure 29. Product Picture of Others
    Figure 30. Global Manganese Dioxide Market Share by Application in 2022 & 2029
    Figure 31. Global Manganese Dioxide Sales in Value by Application (2018-2029) & (US$ Million)
    Figure 32. Global Manganese Dioxide Sales Market Share in Value by Application (2018-2029)
    Figure 33. Global Manganese Dioxide Sales by Application (2018-2029) & (K MT)
    Figure 34. Global Manganese Dioxide Sales Market Share in Volume by Application (2018-2029)
    Figure 35. Global Manganese Dioxide Price by Application (2018-2029) & (USD/MT)
    Figure 36. India Manganese Dioxide Market Share by Application in 2022 & 2029
    Figure 37. India Manganese Dioxide Sales in Value by Application (2018-2029) & (US$ Million)
    Figure 38. India Manganese Dioxide Sales Market Share in Value by Application (2018-2029)
    Figure 39. India Manganese Dioxide Sales by Application (2018-2029) & (K MT)
    Figure 40. India Manganese Dioxide Sales Market Share in Volume by Application (2018-2029)
    Figure 41. India Manganese Dioxide Price by Application (2018-2029) & (USD/MT)
    Figure 42. Americas Manganese Dioxide Sales in Volume Growth Rate 2018-2029 (K MT)
    Figure 43. Americas Manganese Dioxide Sales in Value Growth Rate 2018-2029 (US$ Million)
    Figure 44. Americas Manganese Dioxide Sales by Type (2018-2029) & (K MT)
    Figure 45. Americas Manganese Dioxide Sales Market Share in Volume by Type (2018-2029)
    Figure 46. Americas Manganese Dioxide Sales by Application (2018-2029) & (K MT)
    Figure 47. Americas Manganese Dioxide Sales Market Share in Volume by Application (2018-2029)
    Figure 48. United States Manganese Dioxide Sales in Value Growth Rate (2018-2029) & (US$ Million)
    Figure 49. Canada Manganese Dioxide Sales in Value Growth Rate (2018-2029) & (US$ Million)
    Figure 50. Mexico Manganese Dioxide Sales in Value Growth Rate (2018-2029) & (US$ Million)
    Figure 51. Brazil Manganese Dioxide Sales in Value Growth Rate (2018-2029) & (US$ Million)
    Figure 52. EMEA Manganese Dioxide Sales in Volume Growth Rate 2018-2029 (K MT)
    Figure 53. EMEA Manganese Dioxide Sales in Value Growth Rate 2018-2029 (US$ Million)
    Figure 54. EMEA Manganese Dioxide Sales by Type (2018-2029) & (K MT)
    Figure 55. EMEA Manganese Dioxide Sales Market Share in Volume by Type (2018-2029)
    Figure 56. EMEA Manganese Dioxide Sales by Application (2018-2029) & (K MT)
    Figure 57. EMEA Manganese Dioxide Sales Market Share in Volume by Application (2018-2029)
    Figure 58. Europe Manganese Dioxide Sales in Value Growth Rate (2018-2029) & (US$ Million)
    Figure 59. Middle East Manganese Dioxide Sales in Value Growth Rate (2018-2029) & (US$ Million)
    Figure 60. Africa Manganese Dioxide Sales in Value Growth Rate (2018-2029) & (US$ Million)
    Figure 61. China Manganese Dioxide Sales in Volume Growth Rate 2018-2029 (K MT)
    Figure 62. China Manganese Dioxide Sales in Value Growth Rate 2018-2029 (US$ Million)
    Figure 63. China Manganese Dioxide Sales by Type (2018-2029) & (K MT)
    Figure 64. China Manganese Dioxide Sales Market Share in Volume by Type (2018-2029)
    Figure 65. China Manganese Dioxide Sales by Application (2018-2029) & (K MT)
    Figure 66. China Manganese Dioxide Sales Market Share in Volume by Application (2018-2029)
    Figure 67. APAC Manganese Dioxide Sales in Volume Growth Rate 2018-2029 (K MT)
    Figure 68. APAC Manganese Dioxide Sales in Value Growth Rate 2018-2029 (US$ Million)
    Figure 69. APAC Manganese Dioxide Sales by Type (2018-2029) & (K MT)
    Figure 70. APAC Manganese Dioxide Sales Market Share in Volume by Type (2018-2029)
    Figure 71. APAC Manganese Dioxide Sales by Application (2018-2029) & (K MT)
    Figure 72. APAC Manganese Dioxide Sales Market Share in Volume by Application (2018-2029)
    Figure 73. Japan Manganese Dioxide Sales in Value Growth Rate (2018-2029) & (US$ Million)
    Figure 74. South Korea Manganese Dioxide Sales in Value Growth Rate (2018-2029) & (US$ Million)
    Figure 75. China Taiwan Manganese Dioxide Sales in Value Growth Rate (2018-2029) & (US$ Million)
    Figure 76. Southeast Asia Manganese Dioxide Sales in Value Growth Rate (2018-2029) & (US$ Million)
    Figure 77. India Manganese Dioxide Sales in Value Growth Rate (2018-2029) & (US$ Million)
    Figure 78. Manganese Dioxide Value Chain
    Figure 79. Manganese Dioxide Production Process
    Figure 80. Channels of Distribution
    Figure 81. Distributors Profiles
    Figure 82. Bottom-up and Top-down Approaches for This Report
    Figure 83. Data Triangulation
    Figure 84. Key Executives Interviewed
SELECT A FORMAT
Added to Cart
Electronic (PDF)

$4350

This license allows only one user to access the PDF.
Electronic (PDF)

$6525

This license allows 1 - 5 user to access the PDF, license is suitable for small groups of 5 users working together
Electronic (PDF)

$8700

This license allows users/teams in a same Enterprise to use this report, various departments within an enterpise can use this report
Add to Cart
Buy Now (15% Discount)

OUR CUSTOMER

Seventh Sense AI

SIMILAR REPORTS


RELATED REPORTS

Global Ferrite Bonded Magnets Market Research Report 2025

120 Pages
Type: Report
Code: QYRE-Auto-18E7785
Wed Dec 03 00:00:00 UTC 2025

Add to Cart

Global Penta (Dimethylamino) Tantalum Market Research Report 2025

120 Pages
Type: Report
Code: QYRE-Auto-9P20285
Wed Dec 03 00:00:00 UTC 2025

Add to Cart

Global Silicon Manganese Zirconium Inoculant Market Research Report 2025

120 Pages
Type: Report
Code: QYRE-Auto-32D20024
Wed Dec 03 00:00:00 UTC 2025

Add to Cart

Global Mining Power Transformer Market Research Report 2025

120 Pages
Type: Report
Code: QYRE-Auto-3W20249
Wed Dec 03 00:00:00 UTC 2025

Add to Cart