List of Tables
Table 1. Global Wound Care Treatment and Management Market Size Growth Rate by Type (US$ Million), 2019 VS 2023 VS 2030
Table 2. Key Players of Advanced Wound Dressing
Table 3. Key Players of Traditional Wound Care Products
Table 4. Key Players of Negative Pressure Wound Therapy
Table 5. Key Players of Bioactives
Table 6. Key Players of Others
Table 7. Global Wound Care Treatment and Management Market Size Growth Rate by Application (US$ Million), 2019 VS 2023 VS 2030
Table 8. Global Wound Care Treatment and Management Market Size Growth Rate (CAGR) by Region (US$ Million): 2019 VS 2023 VS 2030
Table 9. Global Wound Care Treatment and Management Market Size by Region (2019-2024) & (US$ Million)
Table 10. Global Wound Care Treatment and Management Market Share by Region (2019-2024)
Table 11. Global Wound Care Treatment and Management Forecasted Market Size by Region (2025-2030) & (US$ Million)
Table 12. Global Wound Care Treatment and Management Market Share by Region (2025-2030)
Table 13. Wound Care Treatment and Management Market Trends
Table 14. Wound Care Treatment and Management Market Drivers
Table 15. Wound Care Treatment and Management Market Challenges
Table 16. Wound Care Treatment and Management Market Restraints
Table 17. Global Wound Care Treatment and Management Revenue by Players (2019-2024) & (US$ Million)
Table 18. Global Wound Care Treatment and Management Revenue Share by Players (2019-2024)
Table 19. Global Top Wound Care Treatment and Management by Company Type (Tier 1, Tier 2, and Tier 3) & (based on the Revenue in Wound Care Treatment and Management as of 2023)
Table 20. Global Wound Care Treatment and Management Industry Ranking 2022 VS 2023 VS 2024
Table 21. Global 5 Largest Players Market Share by Wound Care Treatment and Management Revenue (CR5 and HHI) & (2019-2024)
Table 22. Global Key Players of Wound Care Treatment and Management, Headquarters and Area Served
Table 23. Global Key Players of Wound Care Treatment and Management, Product and Application
Table 24. Global Key Players of Wound Care Treatment and Management, Product and Application
Table 25. Mergers & Acquisitions, Expansion Plans
Table 26. Global Wound Care Treatment and Management Market Size by Type (2019-2024) & (US$ Million)
Table 27. Global Wound Care Treatment and Management Revenue Market Share by Type (2019-2024)
Table 28. Global Wound Care Treatment and Management Forecasted Market Size by Type (2025-2030) & (US$ Million)
Table 29. Global Wound Care Treatment and Management Revenue Market Share by Type (2025-2030)
Table 30. Global Wound Care Treatment and Management Market Size by Application (2019-2024) & (US$ Million)
Table 31. Global Wound Care Treatment and Management Revenue Share by Application (2019-2024)
Table 32. Global Wound Care Treatment and Management Forecasted Market Size by Application (2025-2030) & (US$ Million)
Table 33. Global Wound Care Treatment and Management Revenue Share by Application (2025-2030)
Table 34. North America Wound Care Treatment and Management Market Size by Type (2019-2024) & (US$ Million)
Table 35. North America Wound Care Treatment and Management Market Size by Type (2025-2030) & (US$ Million)
Table 36. North America Wound Care Treatment and Management Market Size by Application (2019-2024) & (US$ Million)
Table 37. North America Wound Care Treatment and Management Market Size by Application (2025-2030) & (US$ Million)
Table 38. North America Wound Care Treatment and Management Growth Rate (CAGR) by Country (US$ Million): 2019 VS 2023 VS 2030
Table 39. North America Wound Care Treatment and Management Market Size by Country (2019-2024) & (US$ Million)
Table 40. North America Wound Care Treatment and Management Market Size by Country (2025-2030) & (US$ Million)
Table 41. Europe Wound Care Treatment and Management Market Size by Type (2019-2024) & (US$ Million)
Table 42. Europe Wound Care Treatment and Management Market Size by Type (2025-2030) & (US$ Million)
Table 43. Europe Wound Care Treatment and Management Market Size by Application (2019-2024) & (US$ Million)
Table 44. Europe Wound Care Treatment and Management Market Size by Application (2025-2030) & (US$ Million)
Table 45. Europe Wound Care Treatment and Management Growth Rate (CAGR) by Country (US$ Million): 2019 VS 2023 VS 2030
Table 46. Europe Wound Care Treatment and Management Market Size by Country (2019-2024) & (US$ Million)
Table 47. Europe Wound Care Treatment and Management Market Size by Country (2025-2030) & (US$ Million)
Table 48. China Wound Care Treatment and Management Market Size by Type (2019-2024) & (US$ Million)
Table 49. China Wound Care Treatment and Management Market Size by Type (2025-2030) & (US$ Million)
Table 50. China Wound Care Treatment and Management Market Size by Application (2019-2024) & (US$ Million)
Table 51. China Wound Care Treatment and Management Market Size by Application (2025-2030) & (US$ Million)
Table 52. Asia Wound Care Treatment and Management Market Size by Type (2019-2024) & (US$ Million)
Table 53. Asia Wound Care Treatment and Management Market Size by Type (2025-2030) & (US$ Million)
Table 54. Asia Wound Care Treatment and Management Market Size by Application (2019-2024) & (US$ Million)
Table 55. Asia Wound Care Treatment and Management Market Size by Application (2025-2030) & (US$ Million)
Table 56. Asia Wound Care Treatment and Management Growth Rate (CAGR) by Region (US$ Million): 2019 VS 2023 VS 2030
Table 57. Asia Wound Care Treatment and Management Market Size by Region (2019-2024) & (US$ Million)
Table 58. Asia Wound Care Treatment and Management Market Size by Region (2025-2030) & (US$ Million)
Table 59. Middle East, Africa, and Latin America Wound Care Treatment and Management Market Size by Type (2019-2024) & (US$ Million)
Table 60. Middle East, Africa, and Latin America Wound Care Treatment and Management Market Size by Type (2025-2030) & (US$ Million)
Table 61. Middle East, Africa, and Latin America Wound Care Treatment and Management Market Size by Application (2019-2024) & (US$ Million)
Table 62. Middle East, Africa, and Latin America Wound Care Treatment and Management Market Size by Application (2025-2030) & (US$ Million)
Table 63. Middle East, Africa, and Latin America Wound Care Treatment and Management Growth Rate (CAGR) by Country (US$ Million): 2019 VS 2023 VS 2030
Table 64. Middle East, Africa, and Latin America Wound Care Treatment and Management Market Size by Country (2019-2024) & (US$ Million)
Table 65. Middle East, Africa, and Latin America Wound Care Treatment and Management Market Size by Country (2025-2030) & (US$ Million)
Table 66. Smith & Nephew Company Details
Table 67. Smith & Nephew Business Overview
Table 68. Smith & Nephew Wound Care Treatment and Management Product
Table 69. Smith & Nephew Revenue in Wound Care Treatment and Management Business (2019-2024) & (US$ Million)
Table 70. Smith & Nephew Recent Developments
Table 71. Medtronic Company Details
Table 72. Medtronic Business Overview
Table 73. Medtronic Wound Care Treatment and Management Product
Table 74. Medtronic Revenue in Wound Care Treatment and Management Business (2019-2024) & (US$ Million)
Table 75. Medtronic Recent Developments
Table 76. Molnlycke Company Details
Table 77. Molnlycke Business Overview
Table 78. Molnlycke Wound Care Treatment and Management Product
Table 79. Molnlycke Revenue in Wound Care Treatment and Management Business (2019-2024) & (US$ Million)
Table 80. Molnlycke Recent Developments
Table 81. Johnson & Johnson Company Details
Table 82. Johnson & Johnson Business Overview
Table 83. Johnson & Johnson Wound Care Treatment and Management Product
Table 84. Johnson & Johnson Revenue in Wound Care Treatment and Management Business (2019-2024) & (US$ Million)
Table 85. Johnson & Johnson Recent Developments
Table 86. ConvaTec Company Details
Table 87. ConvaTec Business Overview
Table 88. ConvaTec Wound Care Treatment and Management Product
Table 89. ConvaTec Revenue in Wound Care Treatment and Management Business (2019-2024) & (US$ Million)
Table 90. ConvaTec Recent Developments
Table 91. Hartmann Group Company Details
Table 92. Hartmann Group Business Overview
Table 93. Hartmann Group Wound Care Treatment and Management Product
Table 94. Hartmann Group Revenue in Wound Care Treatment and Management Business (2019-2024) & (US$ Million)
Table 95. Hartmann Group Recent Developments
Table 96. Cardinal Health Company Details
Table 97. Cardinal Health Business Overview
Table 98. Cardinal Health Wound Care Treatment and Management Product
Table 99. Cardinal Health Revenue in Wound Care Treatment and Management Business (2019-2024) & (US$ Million)
Table 100. Cardinal Health Recent Developments
Table 101. 3M Company Details
Table 102. 3M Business Overview
Table 103. 3M Wound Care Treatment and Management Product
Table 104. 3M Revenue in Wound Care Treatment and Management Business (2019-2024) & (US$ Million)
Table 105. 3M Recent Developments
Table 106. BSN Medical (Essity) Company Details
Table 107. BSN Medical (Essity) Business Overview
Table 108. BSN Medical (Essity) Wound Care Treatment and Management Product
Table 109. BSN Medical (Essity) Revenue in Wound Care Treatment and Management Business (2019-2024) & (US$ Million)
Table 110. BSN Medical (Essity) Recent Developments
Table 111. Coloplast Company Details
Table 112. Coloplast Business Overview
Table 113. Coloplast Wound Care Treatment and Management Product
Table 114. Coloplast Revenue in Wound Care Treatment and Management Business (2019-2024) & (US$ Million)
Table 115. Coloplast Recent Developments
Table 116. Medline Industries Company Details
Table 117. Medline Industries Business Overview
Table 118. Medline Industries Wound Care Treatment and Management Product
Table 119. Medline Industries Revenue in Wound Care Treatment and Management Business (2019-2024) & (US$ Million)
Table 120. Medline Industries Recent Developments
Table 121. Mimedx Group Company Details
Table 122. Mimedx Group Business Overview
Table 123. Mimedx Group Wound Care Treatment and Management Product
Table 124. Mimedx Group Revenue in Wound Care Treatment and Management Business (2019-2024) & (US$ Million)
Table 125. Mimedx Group Recent Developments
Table 126. Urgo Medical Company Details
Table 127. Urgo Medical Business Overview
Table 128. Urgo Medical Wound Care Treatment and Management Product
Table 129. Urgo Medical Revenue in Wound Care Treatment and Management Business (2019-2024) & (US$ Million)
Table 130. Urgo Medical Recent Developments
Table 131. B.Braun Melsungen Company Details
Table 132. B.Braun Melsungen Business Overview
Table 133. B.Braun Melsungen Wound Care Treatment and Management Product
Table 134. B.Braun Melsungen Revenue in Wound Care Treatment and Management Business (2019-2024) & (US$ Million)
Table 135. B.Braun Melsungen Recent Developments
Table 136. Organogenesis Company Details
Table 137. Organogenesis Business Overview
Table 138. Organogenesis Wound Care Treatment and Management Product
Table 139. Organogenesis Revenue in Wound Care Treatment and Management Business (2019-2024) & (US$ Million)
Table 140. Organogenesis Recent Developments
Table 141. Winner Medical Group Company Details
Table 142. Winner Medical Group Business Overview
Table 143. Winner Medical Group Wound Care Treatment and Management Product
Table 144. Winner Medical Group Revenue in Wound Care Treatment and Management Business (2019-2024) & (US$ Million)
Table 145. Winner Medical Group Recent Developments
Table 146. Hollister Incorporated Company Details
Table 147. Hollister Incorporated Business Overview
Table 148. Hollister Incorporated Wound Care Treatment and Management Product
Table 149. Hollister Incorporated Revenue in Wound Care Treatment and Management Business (2019-2024) & (US$ Million)
Table 150. Hollister Incorporated Recent Developments
Table 151. Human Biosciences Company Details
Table 152. Human Biosciences Business Overview
Table 153. Human Biosciences Wound Care Treatment and Management Product
Table 154. Human Biosciences Revenue in Wound Care Treatment and Management Business (2019-2024) & (US$ Million)
Table 155. Human Biosciences Recent Developments
Table 156. Integra Lifesciences Company Details
Table 157. Integra Lifesciences Business Overview
Table 158. Integra Lifesciences Wound Care Treatment and Management Product
Table 159. Integra Lifesciences Revenue in Wound Care Treatment and Management Business (2019-2024) & (US$ Million)
Table 160. Integra Lifesciences Recent Developments
Table 161. Nitto Denko Company Details
Table 162. Nitto Denko Business Overview
Table 163. Nitto Denko Wound Care Treatment and Management Product
Table 164. Nitto Denko Revenue in Wound Care Treatment and Management Business (2019-2024) & (US$ Million)
Table 165. Nitto Denko Recent Developments
Table 166. DermaRite Industries Company Details
Table 167. DermaRite Industries Business Overview
Table 168. DermaRite Industries Wound Care Treatment and Management Product
Table 169. DermaRite Industries Revenue in Wound Care Treatment and Management Business (2019-2024) & (US$ Million)
Table 170. DermaRite Industries Recent Developments
Table 171. Argentum Medical Company Details
Table 172. Argentum Medical Business Overview
Table 173. Argentum Medical Wound Care Treatment and Management Product
Table 174. Argentum Medical Revenue in Wound Care Treatment and Management Business (2019-2024) & (US$ Million)
Table 175. Argentum Medical Recent Developments
Table 176. Research Programs/Design for This Report
Table 177. Key Data Information from Secondary Sources
Table 178. Key Data Information from Primary Sources
List of Figures
Figure 1. Global Wound Care Treatment and Management Market Size Growth Rate by Type, 2019 VS 2023 VS 2030 (US$ Million)
Figure 2. Global Wound Care Treatment and Management Market Share by Type: 2023 VS 2030
Figure 3. Advanced Wound Dressing Features
Figure 4. Traditional Wound Care Products Features
Figure 5. Negative Pressure Wound Therapy Features
Figure 6. Bioactives Features
Figure 7. Others Features
Figure 8. Global Wound Care Treatment and Management Market Size Growth Rate by Application, 2019 VS 2023 VS 2030 (US$ Million)
Figure 9. Global Wound Care Treatment and Management Market Share by Application: 2023 VS 2030
Figure 10. Acute Wounds Case Studies
Figure 11. Chronic Wounds Case Studies
Figure 12. Wound Care Treatment and Management Report Years Considered
Figure 13. Global Wound Care Treatment and Management Market Size (US$ Million), Year-over-Year: 2019-2030
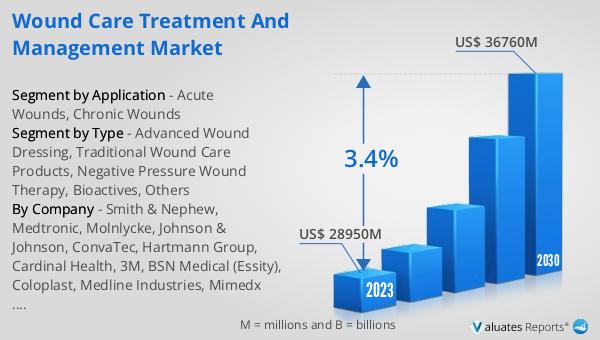
Figure 14. Global Wound Care Treatment and Management Market Size, (US$ Million), 2019 VS 2023 VS 2030
Figure 15. Global Wound Care Treatment and Management Market Share by Region: 2023 VS 2030
Figure 16. Global Wound Care Treatment and Management Market Share by Players in 2023
Figure 17. Global Top Wound Care Treatment and Management Players by Company Type (Tier 1, Tier 2, and Tier 3) & (based on the Revenue in Wound Care Treatment and Management as of 2023)
Figure 18. The Top 10 and 5 Players Market Share by Wound Care Treatment and Management Revenue in 2023
Figure 19. North America Wound Care Treatment and Management Market Size YoY Growth (2019-2030) & (US$ Million)
Figure 20. North America Wound Care Treatment and Management Market Share by Type (2019-2030)
Figure 21. North America Wound Care Treatment and Management Market Share by Application (2019-2030)
Figure 22. North America Wound Care Treatment and Management Market Share by Country (2019-2030)
Figure 23. United States Wound Care Treatment and Management Market Size YoY Growth (2019-2030) & (US$ Million)
Figure 24. Canada Wound Care Treatment and Management Market Size YoY Growth (2019-2030) & (US$ Million)
Figure 25. Europe Wound Care Treatment and Management Market Size YoY (2019-2030) & (US$ Million)
Figure 26. Europe Wound Care Treatment and Management Market Share by Type (2019-2030)
Figure 27. Europe Wound Care Treatment and Management Market Share by Application (2019-2030)
Figure 28. Europe Wound Care Treatment and Management Market Share by Country (2019-2030)
Figure 29. Germany Wound Care Treatment and Management Market Size YoY Growth (2019-2030) & (US$ Million)
Figure 30. France Wound Care Treatment and Management Market Size YoY Growth (2019-2030) & (US$ Million)
Figure 31. U.K. Wound Care Treatment and Management Market Size YoY Growth (2019-2030) & (US$ Million)
Figure 32. Italy Wound Care Treatment and Management Market Size YoY Growth (2019-2030) & (US$ Million)
Figure 33. Russia Wound Care Treatment and Management Market Size YoY Growth (2019-2030) & (US$ Million)
Figure 34. Nordic Countries Wound Care Treatment and Management Market Size YoY Growth (2019-2030) & (US$ Million)
Figure 35. China Wound Care Treatment and Management Market Size YoY (2019-2030) & (US$ Million)
Figure 36. China Wound Care Treatment and Management Market Share by Type (2019-2030)
Figure 37. China Wound Care Treatment and Management Market Share by Application (2019-2030)
Figure 38. Asia Wound Care Treatment and Management Market Size YoY (2019-2030) & (US$ Million)
Figure 39. Asia Wound Care Treatment and Management Market Share by Type (2019-2030)
Figure 40. Asia Wound Care Treatment and Management Market Share by Application (2019-2030)
Figure 41. Asia Wound Care Treatment and Management Market Share by Region (2019-2030)
Figure 42. Japan Wound Care Treatment and Management Market Size YoY Growth (2019-2030) & (US$ Million)
Figure 43. South Korea Wound Care Treatment and Management Market Size YoY Growth (2019-2030) & (US$ Million)
Figure 44. China Taiwan Wound Care Treatment and Management Market Size YoY Growth (2019-2030) & (US$ Million)
Figure 45. Southeast Asia Wound Care Treatment and Management Market Size YoY Growth (2019-2030) & (US$ Million)
Figure 46. India Wound Care Treatment and Management Market Size YoY Growth (2019-2030) & (US$ Million)
Figure 47. Australia Wound Care Treatment and Management Market Size YoY Growth (2019-2030) & (US$ Million)
Figure 48. Middle East, Africa, and Latin America Wound Care Treatment and Management Market Size YoY (2019-2030) & (US$ Million)
Figure 49. Middle East, Africa, and Latin America Wound Care Treatment and Management Market Share by Type (2019-2030)
Figure 50. Middle East, Africa, and Latin America Wound Care Treatment and Management Market Share by Application (2019-2030)
Figure 51. Middle East, Africa, and Latin America Wound Care Treatment and Management Market Share by Country (2019-2030)
Figure 52. Brazil Wound Care Treatment and Management Market Size YoY Growth (2019-2030) & (US$ Million)
Figure 53. Mexico Wound Care Treatment and Management Market Size YoY Growth (2019-2030) & (US$ Million)
Figure 54. Turkey Wound Care Treatment and Management Market Size YoY Growth (2019-2030) & (US$ Million)
Figure 55. Saudi Arabia Wound Care Treatment and Management Market Size YoY Growth (2019-2030) & (US$ Million)
Figure 56. Israel Wound Care Treatment and Management Market Size YoY Growth (2019-2030) & (US$ Million)
Figure 57. GCC Countries Wound Care Treatment and Management Market Size YoY Growth (2019-2030) & (US$ Million)
Figure 58. Smith & Nephew Revenue Growth Rate in Wound Care Treatment and Management Business (2019-2024)
Figure 59. Medtronic Revenue Growth Rate in Wound Care Treatment and Management Business (2019-2024)
Figure 60. Molnlycke Revenue Growth Rate in Wound Care Treatment and Management Business (2019-2024)
Figure 61. Johnson & Johnson Revenue Growth Rate in Wound Care Treatment and Management Business (2019-2024)
Figure 62. ConvaTec Revenue Growth Rate in Wound Care Treatment and Management Business (2019-2024)
Figure 63. Hartmann Group Revenue Growth Rate in Wound Care Treatment and Management Business (2019-2024)
Figure 64. Cardinal Health Revenue Growth Rate in Wound Care Treatment and Management Business (2019-2024)
Figure 65. 3M Revenue Growth Rate in Wound Care Treatment and Management Business (2019-2024)
Figure 66. BSN Medical (Essity) Revenue Growth Rate in Wound Care Treatment and Management Business (2019-2024)
Figure 67. Coloplast Revenue Growth Rate in Wound Care Treatment and Management Business (2019-2024)
Figure 68. Medline Industries Revenue Growth Rate in Wound Care Treatment and Management Business (2019-2024)
Figure 69. Mimedx Group Revenue Growth Rate in Wound Care Treatment and Management Business (2019-2024)
Figure 70. Urgo Medical Revenue Growth Rate in Wound Care Treatment and Management Business (2019-2024)
Figure 71. B.Braun Melsungen Revenue Growth Rate in Wound Care Treatment and Management Business (2019-2024)
Figure 72. Organogenesis Revenue Growth Rate in Wound Care Treatment and Management Business (2019-2024)
Figure 73. Winner Medical Group Revenue Growth Rate in Wound Care Treatment and Management Business (2019-2024)
Figure 74. Hollister Incorporated Revenue Growth Rate in Wound Care Treatment and Management Business (2019-2024)
Figure 75. Human Biosciences Revenue Growth Rate in Wound Care Treatment and Management Business (2019-2024)
Figure 76. Integra Lifesciences Revenue Growth Rate in Wound Care Treatment and Management Business (2019-2024)
Figure 77. Nitto Denko Revenue Growth Rate in Wound Care Treatment and Management Business (2019-2024)
Figure 78. DermaRite Industries Revenue Growth Rate in Wound Care Treatment and Management Business (2019-2024)
Figure 79. Argentum Medical Revenue Growth Rate in Wound Care Treatment and Management Business (2019-2024)
Figure 80. Bottom-up and Top-down Approaches for This Report
Figure 81. Data Triangulation
Figure 82. Key Executives Interviewed