List of Tables
Table 1. Air and Water Pollution Control Equipment CAGR in Value, India VS Global, 2018 VS 2022 VS 2029
Table 2. Air and Water Pollution Control Equipment Market Trends
Table 3. Air and Water Pollution Control Equipment Market Drivers
Table 4. Air and Water Pollution Control Equipment Market Challenges
Table 5. Air and Water Pollution Control Equipment Market Restraints
Table 6. Global Air and Water Pollution Control Equipment Sales Growth Rate (CAGR) by Type: 2018 VS 2022 VS 2029 (US$ Million)
Table 7. India Air and Water Pollution Control Equipment Sales Growth Rate (CAGR) by Type: 2018 VS 2022 VS 2029 (US$ Million)
Table 8. Global Air and Water Pollution Control Equipment Sales Growth Rate (CAGR) by Application: 2018 VS 2022 VS 2029 (US$ Million)
Table 9. India Air and Water Pollution Control Equipment Sales Growth Rate (CAGR) by Application: 2018 VS 2022 VS 2029 (US$ Million)
Table 10. Global Key Manufacturers of Air and Water Pollution Control Equipment, Ranked by Revenue (2022) & (US$ Million)
Table 11. Global Air and Water Pollution Control Equipment Revenue by Manufacturer, (US$ Million), 2018-2023
Table 12. Global Air and Water Pollution Control Equipment Revenue Share by Manufacturer, 2018-2023
Table 13. Global Air and Water Pollution Control Equipment Sales by Manufacturer, (K Units), 2018-2023
Table 14. Global Air and Water Pollution Control Equipment Sales Share by Manufacturer, 2018-2023
Table 15. Global Air and Water Pollution Control Equipment Price by Manufacturer (2018-2023) & (USD/Unit)
Table 16. Global Air and Water Pollution Control Equipment Manufacturers Market Concentration Ratio (CR5 and HHI)
Table 17. Global Air and Water Pollution Control Equipment by Company Type (Tier 1, Tier 2, and Tier 3) & (based on the Revenue in Air and Water Pollution Control Equipment as of 2022)
Table 18. Global Key Manufacturers of Air and Water Pollution Control Equipment, Manufacturing Base Distribution and Headquarters
Table 19. Global Key Manufacturers of Air and Water Pollution Control Equipment, Product Offered and Application
Table 20. Global Key Manufacturers of Air and Water Pollution Control Equipment, Date of Enter into This Industry
Table 21. Manufacturers Mergers & Acquisitions, Expansion Plans
Table 22. Key Players of Air and Water Pollution Control Equipment in India, Ranked by Revenue (2022) & (US$ million)
Table 23. India Air and Water Pollution Control Equipment Revenue by Players, (US$ Million), (2018-2023)
Table 24. India Air and Water Pollution Control Equipment Revenue Share by Players, (2018-2023)
Table 25. India Air and Water Pollution Control Equipment Sales by Players, (K Units), (2018-2023)
Table 26. India Air and Water Pollution Control Equipment Sales Share by Players, (2018-2023)
Table 27. Global Air and Water Pollution Control Equipment Market Size Growth Rate (CAGR) by Region (US$ Million): 2018 VS 2022 VS 2029
Table 28. Global Air and Water Pollution Control Equipment Sales in Volume by Region (2018-2023) & (K Units)
Table 29. Global Air and Water Pollution Control Equipment Sales in Volume Forecast by Region (2024-2029) & (K Units)
Table 30. Global Air and Water Pollution Control Equipment Sales in Value by Region (2018-2023) & (US$ Million)
Table 31. Global Air and Water Pollution Control Equipment Sales in Value Forecast by Region (2024-2029) & (US$ Million)
Table 32. Americas Air and Water Pollution Control Equipment Market Size Growth Rate (CAGR) by Country (US$ Million): 2018 VS 2022 VS 2029
Table 33. Americas Air and Water Pollution Control Equipment Sales in Value by Country (2018-2023) & (US$ Million)
Table 34. Americas Air and Water Pollution Control Equipment Sales in Value by Country (2024-2029) & (US$ Million)
Table 35. Americas Air and Water Pollution Control Equipment Sales in Volume by Country (2018-2023) & (K Units)
Table 36. Americas Air and Water Pollution Control Equipment Sales in Volume by Country (2024-2029) & (K Units)
Table 37. EMEA Air and Water Pollution Control Equipment Market Size Growth Rate (CAGR) by Country (US$ Million): 2018 VS 2022 VS 2029
Table 38. EMEA Air and Water Pollution Control Equipment Sales in Value by Country (2018-2023) & (US$ Million)
Table 39. EMEA Air and Water Pollution Control Equipment Sales in Value by Country (2024-2029) & (US$ Million)
Table 40. EMEA Air and Water Pollution Control Equipment Sales in Volume by Country (2018-2023) & (K Units)
Table 41. EMEA Air and Water Pollution Control Equipment Sales in Volume by Country (2024-2029) & (K Units)
Table 42. APAC Air and Water Pollution Control Equipment Market Size Growth Rate (CAGR) by Country (US$ Million): 2018 VS 2022 VS 2029
Table 43. APAC Air and Water Pollution Control Equipment Sales in Value by Country (2018-2023) & (US$ Million)
Table 44. APAC Air and Water Pollution Control Equipment Sales in Value by Country (2024-2029) & (US$ Million)
Table 45. APAC Air and Water Pollution Control Equipment Sales in Volume by Country (2018-2023) & (K Units)
Table 46. APAC Air and Water Pollution Control Equipment Sales in Volume by Country (2024-2029) & (K Units)
Table 47. Ecolab Company Information
Table 48. Ecolab Description and Business Overview
Table 49. Ecolab Air and Water Pollution Control Equipment Sales (K Units), Revenue (US$ Million), Price (USD/Unit) and Gross Margin (2018-2023)
Table 50. Ecolab Air and Water Pollution Control Equipment Product
Table 51. Ecolab Recent Development
Table 52. Alfa Laval Company Information
Table 53. Alfa Laval Description and Business Overview
Table 54. Alfa Laval Air and Water Pollution Control Equipment Sales (K Units), Revenue (US$ Million), Price (USD/Unit) and Gross Margin (2018-2023)
Table 55. Alfa Laval Air and Water Pollution Control Equipment Product
Table 56. Alfa Laval Recent Development
Table 57. Longking Company Information
Table 58. Longking Description and Business Overview
Table 59. Longking Air and Water Pollution Control Equipment Sales (K Units), Revenue (US$ Million), Price (USD/Unit) and Gross Margin (2018-2023)
Table 60. Longking Air and Water Pollution Control Equipment Product
Table 61. Longking Recent Development
Table 62. GE Company Information
Table 63. GE Description and Business Overview
Table 64. GE Air and Water Pollution Control Equipment Sales (K Units), Revenue (US$ Million), Price (USD/Unit) and Gross Margin (2018-2023)
Table 65. GE Air and Water Pollution Control Equipment Product
Table 66. GE Recent Development
Table 67. SUEZ (GE Water) Company Information
Table 68. SUEZ (GE Water) Description and Business Overview
Table 69. SUEZ (GE Water) Air and Water Pollution Control Equipment Sales (K Units), Revenue (US$ Million), Price (USD/Unit) and Gross Margin (2018-2023)
Table 70. SUEZ (GE Water) Air and Water Pollution Control Equipment Product
Table 71. SUEZ (GE Water) Recent Development
Table 72. GEA Company Information
Table 73. GEA Description and Business Overview
Table 74. GEA Air and Water Pollution Control Equipment Sales (K Units), Revenue (US$ Million), Price (USD/Unit) and Gross Margin (2018-2023)
Table 75. GEA Air and Water Pollution Control Equipment Product
Table 76. GEA Recent Development
Table 77. FLSmidth Company Information
Table 78. FLSmidth Description and Business Overview
Table 79. FLSmidth Air and Water Pollution Control Equipment Sales (K Units), Revenue (US$ Million), Price (USD/Unit) and Gross Margin (2018-2023)
Table 80. FLSmidth Air and Water Pollution Control Equipment Product
Table 81. FLSmidth Recent Development
Table 82. Evoqua Water Company Information
Table 83. Evoqua Water Description and Business Overview
Table 84. Evoqua Water Air and Water Pollution Control Equipment Sales (K Units), Revenue (US$ Million), Price (USD/Unit) and Gross Margin (2018-2023)
Table 85. Evoqua Water Air and Water Pollution Control Equipment Product
Table 86. Evoqua Water Recent Development
Table 87. AAF International Company Information
Table 88. AAF International Description and Business Overview
Table 89. AAF International Air and Water Pollution Control Equipment Sales (K Units), Revenue (US$ Million), Price (USD/Unit) and Gross Margin (2018-2023)
Table 90. AAF International Air and Water Pollution Control Equipment Product
Table 91. AAF International Recent Development
Table 92. Sumitomo Company Information
Table 93. Sumitomo Description and Business Overview
Table 94. Sumitomo Air and Water Pollution Control Equipment Sales (K Units), Revenue (US$ Million), Price (USD/Unit) and Gross Margin (2018-2023)
Table 95. Sumitomo Air and Water Pollution Control Equipment Product
Table 96. Sumitomo Recent Development
Table 97. Foster Wheeler Company Information
Table 98. Foster Wheeler Description and Business Overview
Table 99. Foster Wheeler Air and Water Pollution Control Equipment Sales (K Units), Revenue (US$ Million), Price (USD/Unit) and Gross Margin (2018-2023)
Table 100. Foster Wheeler Air and Water Pollution Control Equipment Product
Table 101. Foster Wheeler Recent Development
Table 102. Feida Company Information
Table 103. Feida Description and Business Overview
Table 104. Feida Air and Water Pollution Control Equipment Sales (K Units), Revenue (US$ Million), Price (USD/Unit) and Gross Margin (2018-2023)
Table 105. Feida Air and Water Pollution Control Equipment Product
Table 106. Feida Recent Development
Table 107. Balcke-Dürr Company Information
Table 108. Balcke-Dürr Description and Business Overview
Table 109. Balcke-Dürr Air and Water Pollution Control Equipment Sales (K Units), Revenue (US$ Million), Price (USD/Unit) and Gross Margin (2018-2023)
Table 110. Balcke-Dürr Air and Water Pollution Control Equipment Product
Table 111. Balcke-Dürr Recent Development
Table 112. Xylem Company Information
Table 113. Xylem Description and Business Overview
Table 114. Xylem Air and Water Pollution Control Equipment Sales (K Units), Revenue (US$ Million), Price (USD/Unit) and Gross Margin (2018-2023)
Table 115. Xylem Air and Water Pollution Control Equipment Product
Table 116. Xylem Recent Development
Table 117. Babcock & Wilcox Company Information
Table 118. Babcock & Wilcox Description and Business Overview
Table 119. Babcock & Wilcox Air and Water Pollution Control Equipment Sales (K Units), Revenue (US$ Million), Price (USD/Unit) and Gross Margin (2018-2023)
Table 120. Babcock & Wilcox Air and Water Pollution Control Equipment Product
Table 121. Babcock & Wilcox Recent Development
Table 122. Ducon Technologies Company Information
Table 123. Ducon Technologies Description and Business Overview
Table 124. Ducon Technologies Air and Water Pollution Control Equipment Sales (K Units), Revenue (US$ Million), Price (USD/Unit) and Gross Margin (2018-2023)
Table 125. Ducon Technologies Air and Water Pollution Control Equipment Product
Table 126. Ducon Technologies Recent Development
Table 127. Wartsila Company Information
Table 128. Wartsila Description and Business Overview
Table 129. Wartsila Air and Water Pollution Control Equipment Sales (K Units), Revenue (US$ Million), Price (USD/Unit) and Gross Margin (2018-2023)
Table 130. Wartsila Air and Water Pollution Control Equipment Product
Table 131. Wartsila Recent Development
Table 132. SPC Company Information
Table 133. SPC Description and Business Overview
Table 134. SPC Air and Water Pollution Control Equipment Sales (K Units), Revenue (US$ Million), Price (USD/Unit) and Gross Margin (2018-2023)
Table 135. SPC Air and Water Pollution Control Equipment Product
Table 136. SPC Recent Development
Table 137. Yara Marine Technologies Company Information
Table 138. Yara Marine Technologies Description and Business Overview
Table 139. Yara Marine Technologies Air and Water Pollution Control Equipment Sales (K Units), Revenue (US$ Million), Price (USD/Unit) and Gross Margin (2018-2023)
Table 140. Yara Marine Technologies Air and Water Pollution Control Equipment Product
Table 141. Yara Marine Technologies Recent Development
Table 142. Dürr AG Company Information
Table 143. Dürr AG Description and Business Overview
Table 144. Dürr AG Air and Water Pollution Control Equipment Sales (K Units), Revenue (US$ Million), Price (USD/Unit) and Gross Margin (2018-2023)
Table 145. Dürr AG Air and Water Pollution Control Equipment Product
Table 146. Dürr AG Recent Development
Table 147. Veolia Company Information
Table 148. Veolia Description and Business Overview
Table 149. Veolia Air and Water Pollution Control Equipment Sales (K Units), Revenue (US$ Million), Price (USD/Unit) and Gross Margin (2018-2023)
Table 150. Veolia Air and Water Pollution Control Equipment Product
Table 151. Veolia Recent Development
Table 152. Sinoma Company Information
Table 153. Sinoma Description and Business Overview
Table 154. Sinoma Air and Water Pollution Control Equipment Sales (K Units), Revenue (US$ Million), Price (USD/Unit) and Gross Margin (2018-2023)
Table 155. Sinoma Air and Water Pollution Control Equipment Product
Table 156. Sinoma Recent Development
Table 157. KC Cottrell Company Information
Table 158. KC Cottrell Description and Business Overview
Table 159. KC Cottrell Air and Water Pollution Control Equipment Sales (K Units), Revenue (US$ Million), Price (USD/Unit) and Gross Margin (2018-2023)
Table 160. KC Cottrell Air and Water Pollution Control Equipment Product
Table 161. KC Cottrell Recent Development
Table 162. Fives Company Information
Table 163. Fives Description and Business Overview
Table 164. Fives Air and Water Pollution Control Equipment Sales (K Units), Revenue (US$ Million), Price (USD/Unit) and Gross Margin (2018-2023)
Table 165. Fives Air and Water Pollution Control Equipment Product
Table 166. Fives Recent Development
Table 167. CECO Environmental Company Information
Table 168. CECO Environmental Description and Business Overview
Table 169. CECO Environmental Air and Water Pollution Control Equipment Sales (K Units), Revenue (US$ Million), Price (USD/Unit) and Gross Margin (2018-2023)
Table 170. CECO Environmental Air and Water Pollution Control Equipment Product
Table 171. CECO Environmental Recent Development
Table 172. Tianjie Group Company Information
Table 173. Tianjie Group Description and Business Overview
Table 174. Tianjie Group Air and Water Pollution Control Equipment Sales (K Units), Revenue (US$ Million), Price (USD/Unit) and Gross Margin (2018-2023)
Table 175. Tianjie Group Air and Water Pollution Control Equipment Product
Table 176. Tianjie Group Recent Development
Table 177. HUBER Group Company Information
Table 178. HUBER Group Description and Business Overview
Table 179. HUBER Group Air and Water Pollution Control Equipment Sales (K Units), Revenue (US$ Million), Price (USD/Unit) and Gross Margin (2018-2023)
Table 180. HUBER Group Air and Water Pollution Control Equipment Product
Table 181. HUBER Group Recent Development
Table 182. Hamon Company Information
Table 183. Hamon Description and Business Overview
Table 184. Hamon Air and Water Pollution Control Equipment Sales (K Units), Revenue (US$ Million), Price (USD/Unit) and Gross Margin (2018-2023)
Table 185. Hamon Air and Water Pollution Control Equipment Product
Table 186. Hamon Recent Development
Table 187. Thermax Company Information
Table 188. Thermax Description and Business Overview
Table 189. Thermax Air and Water Pollution Control Equipment Sales (K Units), Revenue (US$ Million), Price (USD/Unit) and Gross Margin (2018-2023)
Table 190. Thermax Air and Water Pollution Control Equipment Product
Table 191. Thermax Recent Development
Table 192. SHENGYUN Company Information
Table 193. SHENGYUN Description and Business Overview
Table 194. SHENGYUN Air and Water Pollution Control Equipment Sales (K Units), Revenue (US$ Million), Price (USD/Unit) and Gross Margin (2018-2023)
Table 195. SHENGYUN Air and Water Pollution Control Equipment Product
Table 196. SHENGYUN Recent Development
Table 197. BHEL Details
Table 198. Pall Corporation Details
Table 199. Jiulong Details
Table 200. JOHN ZINK COMPANY Details
Table 201. Key Raw Materials Lists
Table 202. Raw Materials Key Suppliers Lists
Table 203. Air and Water Pollution Control Equipment Customers List
Table 204. Air and Water Pollution Control Equipment Distributors List
Table 205. Research Programs/Design for This Report
Table 206. Key Data Information from Secondary Sources
Table 207. Key Data Information from Primary Sources
List of Figures
Figure 1. Air and Water Pollution Control Equipment Product Picture
Figure 2. Global Air and Water Pollution Control Equipment Revenue, (US$ Million), 2018 VS 2022 VS 2029
Figure 3. Global Air and Water Pollution Control Equipment Market Size 2018-2029 (US$ Million)
Figure 4. Global Air and Water Pollution Control Equipment Sales 2018-2029 (K Units)
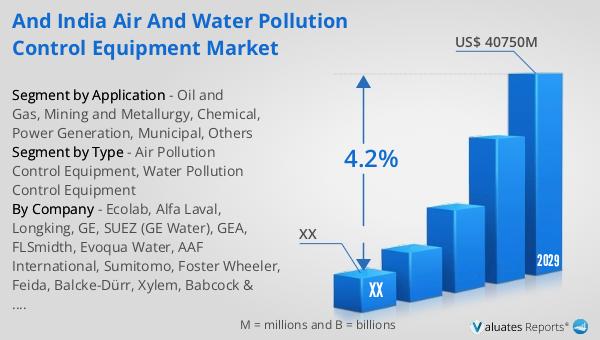
Figure 5. India Air and Water Pollution Control Equipment Revenue, (US$ Million), 2018 VS 2022 VS 2029
Figure 6. India Air and Water Pollution Control Equipment Market Size 2018-2029 (US$ Million)
Figure 7. India Air and Water Pollution Control Equipment Sales 2018-2029 (K Units)
Figure 8. India Air and Water Pollution Control Equipment Market Share in Global, in Value (US$ Million) 2018-2029
Figure 9. India Air and Water Pollution Control Equipment Market Share in Global, in Volume (K Units) 2018-2029
Figure 10. Air and Water Pollution Control Equipment Report Years Considered
Figure 11. Product Picture of Air Pollution Control Equipment
Figure 12. Product Picture of Water Pollution Control Equipment
Figure 13. Global Air and Water Pollution Control Equipment Market Share by Type in 2022 & 2029
Figure 14. Global Air and Water Pollution Control Equipment Sales in Value by Type (2018-2029) & (US$ Million)
Figure 15. Global Air and Water Pollution Control Equipment Sales Market Share in Value by Type (2018-2029)
Figure 16. Global Air and Water Pollution Control Equipment Sales by Type (2018-2029) & (K Units)
Figure 17. Global Air and Water Pollution Control Equipment Sales Market Share in Volume by Type (2018-2029)
Figure 18. Global Air and Water Pollution Control Equipment Price by Type (2018-2029) & (USD/Unit)
Figure 19. India Air and Water Pollution Control Equipment Market Share by Type in 2022 & 2029
Figure 20. India Air and Water Pollution Control Equipment Sales in Value by Type (2018-2029) & (US$ Million)
Figure 21. India Air and Water Pollution Control Equipment Sales Market Share in Value by Type (2018-2029)
Figure 22. India Air and Water Pollution Control Equipment Sales by Type (2018-2029) & (K Units)
Figure 23. India Air and Water Pollution Control Equipment Sales Market Share in Volume by Type (2018-2029)
Figure 24. India Air and Water Pollution Control Equipment Price by Type (2018-2029) & (USD/Unit)
Figure 25. Product Picture of Oil and Gas
Figure 26. Product Picture of Mining and Metallurgy
Figure 27. Product Picture of Chemical
Figure 28. Product Picture of Power Generation
Figure 29. Product Picture of Municipal
Figure 30. Product Picture of Others
Figure 31. Global Air and Water Pollution Control Equipment Market Share by Application in 2022 & 2029
Figure 32. Global Air and Water Pollution Control Equipment Sales in Value by Application (2018-2029) & (US$ Million)
Figure 33. Global Air and Water Pollution Control Equipment Sales Market Share in Value by Application (2018-2029)
Figure 34. Global Air and Water Pollution Control Equipment Sales by Application (2018-2029) & (K Units)
Figure 35. Global Air and Water Pollution Control Equipment Sales Market Share in Volume by Application (2018-2029)
Figure 36. Global Air and Water Pollution Control Equipment Price by Application (2018-2029) & (USD/Unit)
Figure 37. India Air and Water Pollution Control Equipment Market Share by Application in 2022 & 2029
Figure 38. India Air and Water Pollution Control Equipment Sales in Value by Application (2018-2029) & (US$ Million)
Figure 39. India Air and Water Pollution Control Equipment Sales Market Share in Value by Application (2018-2029)
Figure 40. India Air and Water Pollution Control Equipment Sales by Application (2018-2029) & (K Units)
Figure 41. India Air and Water Pollution Control Equipment Sales Market Share in Volume by Application (2018-2029)
Figure 42. India Air and Water Pollution Control Equipment Price by Application (2018-2029) & (USD/Unit)
Figure 43. Americas Air and Water Pollution Control Equipment Sales in Volume Growth Rate 2018-2029 (K Units)
Figure 44. Americas Air and Water Pollution Control Equipment Sales in Value Growth Rate 2018-2029 (US$ Million)
Figure 45. Americas Air and Water Pollution Control Equipment Sales by Type (2018-2029) & (K Units)
Figure 46. Americas Air and Water Pollution Control Equipment Sales Market Share in Volume by Type (2018-2029)
Figure 47. Americas Air and Water Pollution Control Equipment Sales by Application (2018-2029) & (K Units)
Figure 48. Americas Air and Water Pollution Control Equipment Sales Market Share in Volume by Application (2018-2029)
Figure 49. United States Air and Water Pollution Control Equipment Sales in Value Growth Rate (2018-2029) & (US$ Million)
Figure 50. Canada Air and Water Pollution Control Equipment Sales in Value Growth Rate (2018-2029) & (US$ Million)
Figure 51. Mexico Air and Water Pollution Control Equipment Sales in Value Growth Rate (2018-2029) & (US$ Million)
Figure 52. Brazil Air and Water Pollution Control Equipment Sales in Value Growth Rate (2018-2029) & (US$ Million)
Figure 53. EMEA Air and Water Pollution Control Equipment Sales in Volume Growth Rate 2018-2029 (K Units)
Figure 54. EMEA Air and Water Pollution Control Equipment Sales in Value Growth Rate 2018-2029 (US$ Million)
Figure 55. EMEA Air and Water Pollution Control Equipment Sales by Type (2018-2029) & (K Units)
Figure 56. EMEA Air and Water Pollution Control Equipment Sales Market Share in Volume by Type (2018-2029)
Figure 57. EMEA Air and Water Pollution Control Equipment Sales by Application (2018-2029) & (K Units)
Figure 58. EMEA Air and Water Pollution Control Equipment Sales Market Share in Volume by Application (2018-2029)
Figure 59. Europe Air and Water Pollution Control Equipment Sales in Value Growth Rate (2018-2029) & (US$ Million)
Figure 60. Middle East Air and Water Pollution Control Equipment Sales in Value Growth Rate (2018-2029) & (US$ Million)
Figure 61. Africa Air and Water Pollution Control Equipment Sales in Value Growth Rate (2018-2029) & (US$ Million)
Figure 62. China Air and Water Pollution Control Equipment Sales in Volume Growth Rate 2018-2029 (K Units)
Figure 63. China Air and Water Pollution Control Equipment Sales in Value Growth Rate 2018-2029 (US$ Million)
Figure 64. China Air and Water Pollution Control Equipment Sales by Type (2018-2029) & (K Units)
Figure 65. China Air and Water Pollution Control Equipment Sales Market Share in Volume by Type (2018-2029)
Figure 66. China Air and Water Pollution Control Equipment Sales by Application (2018-2029) & (K Units)
Figure 67. China Air and Water Pollution Control Equipment Sales Market Share in Volume by Application (2018-2029)
Figure 68. APAC Air and Water Pollution Control Equipment Sales in Volume Growth Rate 2018-2029 (K Units)
Figure 69. APAC Air and Water Pollution Control Equipment Sales in Value Growth Rate 2018-2029 (US$ Million)
Figure 70. APAC Air and Water Pollution Control Equipment Sales by Type (2018-2029) & (K Units)
Figure 71. APAC Air and Water Pollution Control Equipment Sales Market Share in Volume by Type (2018-2029)
Figure 72. APAC Air and Water Pollution Control Equipment Sales by Application (2018-2029) & (K Units)
Figure 73. APAC Air and Water Pollution Control Equipment Sales Market Share in Volume by Application (2018-2029)
Figure 74. Japan Air and Water Pollution Control Equipment Sales in Value Growth Rate (2018-2029) & (US$ Million)
Figure 75. South Korea Air and Water Pollution Control Equipment Sales in Value Growth Rate (2018-2029) & (US$ Million)
Figure 76. China Taiwan Air and Water Pollution Control Equipment Sales in Value Growth Rate (2018-2029) & (US$ Million)
Figure 77. Southeast Asia Air and Water Pollution Control Equipment Sales in Value Growth Rate (2018-2029) & (US$ Million)
Figure 78. India Air and Water Pollution Control Equipment Sales in Value Growth Rate (2018-2029) & (US$ Million)
Figure 79. Air and Water Pollution Control Equipment Value Chain
Figure 80. Air and Water Pollution Control Equipment Production Process
Figure 81. Channels of Distribution
Figure 82. Distributors Profiles
Figure 83. Bottom-up and Top-down Approaches for This Report
Figure 84. Data Triangulation
Figure 85. Key Executives Interviewed