1 Market Overview
1.1 Medical CT Overlays Product Introduction
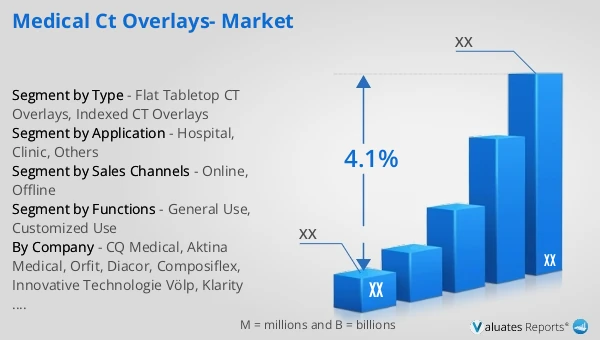
1.2 Global Medical CT Overlays Market Size Forecast
1.2.1 Global Medical CT Overlays Sales Value (2021–2032)
1.2.2 Global Medical CT Overlays Sales Volume (2021–2032)
1.2.3 Global Medical CT Overlays Sales Price (2021–2032)
1.3 Medical CT Overlays Market Trends & Drivers
1.3.1 Medical CT Overlays Industry Trends
1.3.2 Medical CT Overlays Market Drivers & Opportunities
1.3.3 Medical CT Overlays Market Challenges
1.3.4 Medical CT Overlays Market Restraints
1.3.5 Impact of U.S. Tariffs
1.4 Assumptions and Limitations
1.5 Study Objectives
1.6 Years Considered
2 Competitive Analysis by Company
2.1 Global Medical CT Overlays Players Revenue Ranking (2025)
2.2 Global Medical CT Overlays Revenue by Company (2021–2026)
2.3 Global Medical CT Overlays Sales Volume Ranking of Players (2025)
2.4 Global Medical CT Overlays Sales Volume by Company (2021–2026)
2.5 Global Medical CT Overlays Average Price by Company (2021–2026)
2.6 Key Manufacturers Medical CT Overlays Manufacturing Base and Headquarters
2.7 Key Manufacturers Medical CT Overlays Product Offerings
2.8 Key Manufacturers Start of Mass Production of Medical CT Overlays
2.9 Medical CT Overlays Market Competitive Analysis
2.9.1 Medical CT Overlays Market Concentration Rate (2021–2026)
2.9.2 Global 5 and 10 Largest Manufacturers by Medical CT Overlays Revenue in 2025
2.9.3 Global Companies by Tier (Tier 1, Tier 2, Tier 3), based on Medical CT Overlays revenue, 2025
2.10 Mergers & Acquisitions and Expansion
3 Segmentation Medical CT Overlays Market Classification
3.1 Introduction by Type
3.1.1 Flat Tabletop CT Overlays
3.1.2 Indexed CT Overlays
3.1.3 Global Medical CT Overlays Sales Value by Type
3.1.3.1 Global Medical CT Overlays Sales Value by Type (2021 vs 2025 vs 2032)
3.1.3.2 Global Medical CT Overlays Sales Value, by Type (2021–2032)
3.1.3.3 Global Medical CT Overlays Sales Value, by Type (%), 2021–2032
3.1.4 Global Medical CT Overlays Sales Volume by Type
3.1.4.1 Global Medical CT Overlays Sales Volume by Type (2021 vs 2025 vs 2032)
3.1.4.2 Global Medical CT Overlays Sales Volume, by Type (2021–2032)
3.1.4.3 Global Medical CT Overlays Sales Volume, by Type (%), 2021–2032
3.1.5 Global Medical CT Overlays Average Price by Type (2021–2032)
3.2 Introduction by Sales Channels
3.2.1 Online
3.2.2 Offline
3.2.3 Global Medical CT Overlays Sales Value by Sales Channels
3.2.3.1 Global Medical CT Overlays Sales Value by Sales Channels (2021 vs 2025 vs 2032)
3.2.3.2 Global Medical CT Overlays Sales Value, by Sales Channels (2021–2032)
3.2.3.3 Global Medical CT Overlays Sales Value, by Sales Channels (%), 2021–2032
3.2.4 Global Medical CT Overlays Sales Volume by Sales Channels
3.2.4.1 Global Medical CT Overlays Sales Volume by Sales Channels (2021 vs 2025 vs 2032)
3.2.4.2 Global Medical CT Overlays Sales Volume, by Sales Channels (2021–2032)
3.2.4.3 Global Medical CT Overlays Sales Volume, by Sales Channels (%), 2021–2032
3.2.5 Global Medical CT Overlays Average Price by Sales Channels (2021–2032)
3.3 Introduction by Functions
3.3.1 General Use
3.3.2 Customized Use
3.3.3 Global Medical CT Overlays Sales Value by Functions
3.3.3.1 Global Medical CT Overlays Sales Value by Functions (2021 vs 2025 vs 2032)
3.3.3.2 Global Medical CT Overlays Sales Value, by Functions (2021–2032)
3.3.3.3 Global Medical CT Overlays Sales Value, by Functions (%), 2021–2032
3.3.4 Global Medical CT Overlays Sales Volume by Functions
3.3.4.1 Global Medical CT Overlays Sales Volume by Functions (2021 vs 2025 vs 2032)
3.3.4.2 Global Medical CT Overlays Sales Volume, by Functions (2021–2032)
3.3.4.3 Global Medical CT Overlays Sales Volume, by Functions (%), 2021–2032
3.3.5 Global Medical CT Overlays Average Price by Functions (2021–2032)
4 Segmentation by Application
4.1 Introduction by Application
4.1.1 Hospital
4.1.2 Clinic
4.1.3 Others
4.2 Global Medical CT Overlays Sales Value by Application
4.2.1 Global Medical CT Overlays Sales Value by Application (2021 vs 2025 vs 2032)
4.2.2 Global Medical CT Overlays Sales Value, by Application (2021–2032)
4.2.3 Global Medical CT Overlays Sales Value, by Application (%), 2021–2032
4.3 Global Medical CT Overlays Sales Volume by Application
4.3.1 Global Medical CT Overlays Sales Volume by Application (2021 vs 2025 vs 2032)
4.3.2 Global Medical CT Overlays Sales Volume, by Application (2021–2032)
4.3.3 Global Medical CT Overlays Sales Volume, by Application (%), 2021–2032
4.4 Global Medical CT Overlays Average Price by Application (2021–2032)
5 Segmentation by Region
5.1 Global Medical CT Overlays Sales Value by Region
5.1.1 Global Medical CT Overlays Sales Value by Region: 2021 vs 2025 vs 2032
5.1.2 Global Medical CT Overlays Sales Value by Region (2021–2026)
5.1.3 Global Medical CT Overlays Sales Value by Region (2027–2032)
5.1.4 Global Medical CT Overlays Sales Value by Region (%), 2021–2032
5.2 Global Medical CT Overlays Sales Volume by Region
5.2.1 Global Medical CT Overlays Sales Volume by Region: 2021 vs 2025 vs 2032
5.2.2 Global Medical CT Overlays Sales Volume by Region (2021–2026)
5.2.3 Global Medical CT Overlays Sales Volume by Region (2027–2032)
5.2.4 Global Medical CT Overlays Sales Volume by Region (%), 2021–2032
5.3 Global Medical CT Overlays Average Price by Region (2021–2032)
5.4 North America
5.4.1 North America Medical CT Overlays Sales Value, 2021–2032
5.4.2 North America Medical CT Overlays Sales Value by Country (%), 2025 vs 2032
5.5 Europe
5.5.1 Europe Medical CT Overlays Sales Value, 2021–2032
5.5.2 Europe Medical CT Overlays Sales Value by Country (%), 2025 vs 2032
5.6 Asia Pacific
5.6.1 Asia Pacific Medical CT Overlays Sales Value, 2021–2032
5.6.2 Asia Pacific Medical CT Overlays Sales Value by Region (%), 2025 vs 2032
5.7 South America
5.7.1 South America Medical CT Overlays Sales Value, 2021–2032
5.7.2 South America Medical CT Overlays Sales Value by Country (%), 2025 vs 2032
5.8 Middle East & Africa
5.8.1 Middle East & Africa Medical CT Overlays Sales Value, 2021–2032
5.8.2 Middle East & Africa Medical CT Overlays Sales Value by Country (%), 2025 vs 2032
6 Segmentation by Key Countries/Regions
6.1 Key Countries/Regions Medical CT Overlays Sales Value Growth Trends, 2021 vs 2025 vs 2032
6.2 Key Countries/Regions Medical CT Overlays Sales Value and Sales Volume
6.2.1 Key Countries/Regions Medical CT Overlays Sales Value, 2021–2032
6.2.2 Key Countries/Regions Medical CT Overlays Sales Volume, 2021–2032
6.3 United States
6.3.1 United States Medical CT Overlays Sales Value, 2021–2032
6.3.2 United States Medical CT Overlays Sales Value by Type (%), 2025 vs 2032
6.3.3 United States Medical CT Overlays Sales Value by Application, 2025 vs 2032
6.4 Europe
6.4.1 Europe Medical CT Overlays Sales Value, 2021–2032
6.4.2 Europe Medical CT Overlays Sales Value by Type (%), 2025 vs 2032
6.4.3 Europe Medical CT Overlays Sales Value by Application, 2025 vs 2032
6.5 China
6.5.1 China Medical CT Overlays Sales Value, 2021–2032
6.5.2 China Medical CT Overlays Sales Value by Type (%), 2025 vs 2032
6.5.3 China Medical CT Overlays Sales Value by Application, 2025 vs 2032
6.6 Japan
6.6.1 Japan Medical CT Overlays Sales Value, 2021–2032
6.6.2 Japan Medical CT Overlays Sales Value by Type (%), 2025 vs 2032
6.6.3 Japan Medical CT Overlays Sales Value by Application, 2025 vs 2032
6.7 South Korea
6.7.1 South Korea Medical CT Overlays Sales Value, 2021–2032
6.7.2 South Korea Medical CT Overlays Sales Value by Type (%), 2025 vs 2032
6.7.3 South Korea Medical CT Overlays Sales Value by Application, 2025 vs 2032
6.8 Southeast Asia
6.8.1 Southeast Asia Medical CT Overlays Sales Value, 2021–2032
6.8.2 Southeast Asia Medical CT Overlays Sales Value by Type (%), 2025 vs 2032
6.8.3 Southeast Asia Medical CT Overlays Sales Value by Application, 2025 vs 2032
6.9 India
6.9.1 India Medical CT Overlays Sales Value, 2021–2032
6.9.2 India Medical CT Overlays Sales Value by Type (%), 2025 vs 2032
6.9.3 India Medical CT Overlays Sales Value by Application, 2025 vs 2032
7 Company Profiles
7.1 CQ Medical
7.1.1 CQ Medical Company Information
7.1.2 CQ Medical Introduction and Business Overview
7.1.3 CQ Medical Medical CT Overlays Sales, Revenue, Price and Gross Margin (2021–2026)
7.1.4 CQ Medical Medical CT Overlays Product Offerings
7.1.5 CQ Medical Recent Developments
7.2 Aktina Medical
7.2.1 Aktina Medical Company Information
7.2.2 Aktina Medical Introduction and Business Overview
7.2.3 Aktina Medical Medical CT Overlays Sales, Revenue, Price and Gross Margin (2021–2026)
7.2.4 Aktina Medical Medical CT Overlays Product Offerings
7.2.5 Aktina Medical Recent Developments
7.3 Orfit
7.3.1 Orfit Company Information
7.3.2 Orfit Introduction and Business Overview
7.3.3 Orfit Medical CT Overlays Sales, Revenue, Price and Gross Margin (2021–2026)
7.3.4 Orfit Medical CT Overlays Product Offerings
7.3.5 Orfit Recent Developments
7.4 Diacor
7.4.1 Diacor Company Information
7.4.2 Diacor Introduction and Business Overview
7.4.3 Diacor Medical CT Overlays Sales, Revenue, Price and Gross Margin (2021–2026)
7.4.4 Diacor Medical CT Overlays Product Offerings
7.4.5 Diacor Recent Developments
7.5 Composiflex
7.5.1 Composiflex Company Information
7.5.2 Composiflex Introduction and Business Overview
7.5.3 Composiflex Medical CT Overlays Sales, Revenue, Price and Gross Margin (2021–2026)
7.5.4 Composiflex Medical CT Overlays Product Offerings
7.5.5 Composiflex Recent Developments
7.6 Innovative Technologie Völp
7.6.1 Innovative Technologie Völp Company Information
7.6.2 Innovative Technologie Völp Introduction and Business Overview
7.6.3 Innovative Technologie Völp Medical CT Overlays Sales, Revenue, Price and Gross Margin (2021–2026)
7.6.4 Innovative Technologie Völp Medical CT Overlays Product Offerings
7.6.5 Innovative Technologie Völp Recent Developments
7.7 Klarity Medical
7.7.1 Klarity Medical Company Information
7.7.2 Klarity Medical Introduction and Business Overview
7.7.3 Klarity Medical Medical CT Overlays Sales, Revenue, Price and Gross Margin (2021–2026)
7.7.4 Klarity Medical Medical CT Overlays Product Offerings
7.7.5 Klarity Medical Recent Developments
7.8 Wuxi Rsn New Material Technology
7.8.1 Wuxi Rsn New Material Technology Company Information
7.8.2 Wuxi Rsn New Material Technology Introduction and Business Overview
7.8.3 Wuxi Rsn New Material Technology Medical CT Overlays Sales, Revenue, Price and Gross Margin (2021–2026)
7.8.4 Wuxi Rsn New Material Technology Medical CT Overlays Product Offerings
7.8.5 Wuxi Rsn New Material Technology Recent Developments
7.9 Jiangsu BOS CARBON FIBER Technology
7.9.1 Jiangsu BOS CARBON FIBER Technology Company Information
7.9.2 Jiangsu BOS CARBON FIBER Technology Introduction and Business Overview
7.9.3 Jiangsu BOS CARBON FIBER Technology Medical CT Overlays Sales, Revenue, Price and Gross Margin (2021–2026)
7.9.4 Jiangsu BOS CARBON FIBER Technology Medical CT Overlays Product Offerings
7.9.5 Jiangsu BOS CARBON FIBER Technology Recent Developments
7.10 Suzhou Nuoen Composite Material
7.10.1 Suzhou Nuoen Composite Material Company Information
7.10.2 Suzhou Nuoen Composite Material Introduction and Business Overview
7.10.3 Suzhou Nuoen Composite Material Medical CT Overlays Sales, Revenue, Price and Gross Margin (2021–2026)
7.10.4 Suzhou Nuoen Composite Material Medical CT Overlays Product Offerings
7.10.5 Suzhou Nuoen Composite Material Recent Developments
7.11 Shandong Itl Advanced Materials
7.11.1 Shandong Itl Advanced Materials Company Information
7.11.2 Shandong Itl Advanced Materials Introduction and Business Overview
7.11.3 Shandong Itl Advanced Materials Medical CT Overlays Sales, Revenue, Price and Gross Margin (2021–2026)
7.11.4 Shandong Itl Advanced Materials Medical CT Overlays Product Offerings
7.11.5 Shandong Itl Advanced Materials Recent Developments
7.12 Wuxi Zhishang New Material
7.12.1 Wuxi Zhishang New Material Company Information
7.12.2 Wuxi Zhishang New Material Introduction and Business Overview
7.12.3 Wuxi Zhishang New Material Medical CT Overlays Sales, Revenue, Price and Gross Margin (2021–2026)
7.12.4 Wuxi Zhishang New Material Medical CT Overlays Product Offerings
7.12.5 Wuxi Zhishang New Material Recent Developments
7.13 Xincai Taike (Tianjin) Composite Material
7.13.1 Xincai Taike (Tianjin) Composite Material Company Information
7.13.2 Xincai Taike (Tianjin) Composite Material Introduction and Business Overview
7.13.3 Xincai Taike (Tianjin) Composite Material Medical CT Overlays Sales, Revenue, Price and Gross Margin (2021–2026)
7.13.4 Xincai Taike (Tianjin) Composite Material Medical CT Overlays Product Offerings
7.13.5 Xincai Taike (Tianjin) Composite Material Recent Developments
7.14 Dongguan Hexing Carbon Fiber
7.14.1 Dongguan Hexing Carbon Fiber Company Information
7.14.2 Dongguan Hexing Carbon Fiber Introduction and Business Overview
7.14.3 Dongguan Hexing Carbon Fiber Medical CT Overlays Sales, Revenue, Price and Gross Margin (2021–2026)
7.14.4 Dongguan Hexing Carbon Fiber Medical CT Overlays Product Offerings
7.14.5 Dongguan Hexing Carbon Fiber Recent Developments
7.15 Dongguan Juli Composite Materials
7.15.1 Dongguan Juli Composite Materials Company Information
7.15.2 Dongguan Juli Composite Materials Introduction and Business Overview
7.15.3 Dongguan Juli Composite Materials Medical CT Overlays Sales, Revenue, Price and Gross Margin (2021–2026)
7.15.4 Dongguan Juli Composite Materials Medical CT Overlays Product Offerings
7.15.5 Dongguan Juli Composite Materials Recent Developments
7.16 Foshan Zhihui Junzhang New Materials
7.16.1 Foshan Zhihui Junzhang New Materials Company Information
7.16.2 Foshan Zhihui Junzhang New Materials Introduction and Business Overview
7.16.3 Foshan Zhihui Junzhang New Materials Medical CT Overlays Sales, Revenue, Price and Gross Margin (2021–2026)
7.16.4 Foshan Zhihui Junzhang New Materials Medical CT Overlays Product Offerings
7.16.5 Foshan Zhihui Junzhang New Materials Recent Developments
8 Industry Chain Analysis
8.1 Medical CT Overlays Industrial Chain
8.2 Medical CT Overlays Upstream Analysis
8.2.1 Key Raw Materials
8.2.2 Key Suppliers of Raw Materials
8.2.3 Manufacturing Cost Structure
8.3 Midstream Analysis
8.4 Downstream Analysis (Customer Analysis)
8.5 Sales Model and Sales Channelss
8.5.1 Medical CT Overlays Sales Model
8.5.2 Sales Channels
8.5.3 Medical CT Overlays Distributors
9 Research Findings and Conclusion
10 Appendix
10.1 Research Methodology
10.1.1 Methodology/Research Approach
10.1.1.1 Research Programs/Design
10.1.1.2 Market Size Estimation
10.1.1.3 Market Breakdown and Data Triangulation
10.1.2 Data Source
10.1.2.1 Secondary Sources
10.1.2.2 Primary Sources
10.2 Author Details
10.3 Disclaimer