List of Tables
Table 1. Coherent Optical Communication Equipment Market Size India VS Global, CAGR (2018 VS 2022 VS 2029)
Table 2. Coherent Optical Communication Equipment Market Trends
Table 3. Coherent Optical Communication Equipment Market Drivers
Table 4. Coherent Optical Communication Equipment Market Challenges
Table 5. Coherent Optical Communication Equipment Market Restraints
Table 6. Global Coherent Optical Communication Equipment Market Size by Type: 2018 VS 2022 VS 2029 (US$ Million)
Table 7. India Coherent Optical Communication Equipment Market Size by Type: 2018 VS 2022 VS 2029 (US$ Million)
Table 8. Global Coherent Optical Communication Equipment Market Size by Application: 2018 VS 2022 VS 2029 (US$ Million)
Table 9. India Coherent Optical Communication Equipment Market Size by Application: 2018 VS 2022 VS 2029 (US$ Million)
Table 10. Global Key Companies of Coherent Optical Communication Equipment, Ranked by Revenue (2022) & (US$ Million)
Table 11. Global Coherent Optical Communication Equipment Revenue by Player, (US$ Million), 2018-2023
Table 12. Global Coherent Optical Communication Equipment Revenue Share by Player, 2018-2023
Table 13. Global Coherent Optical Communication Equipment Companies Market Concentration Ratio (CR5 and HHI)
Table 14. Global Coherent Optical Communication Equipment by Company Type (Tier 1, Tier 2, and Tier 3) & (based on the Revenue in Coherent Optical Communication Equipment as of 2022)
Table 15. Global Key Players of Coherent Optical Communication Equipment, Headquarters and Area Served
Table 16. Global Key Players of Coherent Optical Communication Equipment, Product and Application
Table 17. Global Key Players of Coherent Optical Communication Equipment, Date of Enter into This Industry
Table 18. Companies Mergers & Acquisitions, Expansion Plans
Table 19. Key Players of Coherent Optical Communication Equipment in India, Ranked by Revenue (2022) & (US$ Million)
Table 20. India Coherent Optical Communication Equipment Revenue by Players, (US$ Million), 2021, 2022 & 2023
Table 21. India Coherent Optical Communication Equipment Revenue Share by Players, 2021, 2022 & 2023
Table 22. Global Coherent Optical Communication Equipment Market Size Growth Rate (CAGR) by Region (US$ Million): 2018 VS 2022 VS 2029
Table 23. Global Coherent Optical Communication Equipment Market Size by Region (2018-2023) & (US$ Million)
Table 24. Global Coherent Optical Communication Equipment Market Size Forecast by Region (2024-2029) & (US$ Million)
Table 25. Americas Coherent Optical Communication Equipment Market Size by Type (2018-2023) & (US$ Million)
Table 26. Americas Coherent Optical Communication Equipment Market Size by Type (2024-2029) & (US$ Million)
Table 27. Americas Coherent Optical Communication Equipment Market Size by Application (2018-2023) & (US$ Million)
Table 28. Americas Coherent Optical Communication Equipment Market Size by Application (2024-2029) & (US$ Million)
Table 29. Americas Coherent Optical Communication Equipment Market Size Growth Rate (CAGR) by Country (US$ Million): 2018 VS 2022 VS 2029
Table 30. Americas Coherent Optical Communication Equipment Market Size by Country (2018-2023) & (US$ Million)
Table 31. Americas Coherent Optical Communication Equipment Market Size by Country (2024-2029) & (US$ Million)
Table 32. EMEA Coherent Optical Communication Equipment Market Size by Type (2018-2023) & (US$ Million)
Table 33. EMEA Coherent Optical Communication Equipment Market Size by Type (2024-2029) & (US$ Million)
Table 34. EMEA Coherent Optical Communication Equipment Market Size by Application (2018-2023) & (US$ Million)
Table 35. EMEA Coherent Optical Communication Equipment Market Size by Application (2024-2029) & (US$ Million)
Table 36. EMEA Coherent Optical Communication Equipment Market Size Growth Rate (CAGR) by Country (US$ Million): 2018 VS 2022 VS 2029
Table 37. EMEA Coherent Optical Communication Equipment Market Size by Country (2018-2023) & (US$ Million)
Table 38. EMEA Coherent Optical Communication Equipment Market Size by Country (2024-2029) & (US$ Million)
Table 39. China Coherent Optical Communication Equipment Market Size by Type (2018-2023) & (US$ Million)
Table 40. China Coherent Optical Communication Equipment Market Size by Type (2024-2029) & (US$ Million)
Table 41. China Coherent Optical Communication Equipment Market Size by Application (2018-2023) & (US$ Million)
Table 42. China Coherent Optical Communication Equipment Market Size by Application (2024-2029) & (US$ Million)
Table 43. China Coherent Optical Communication Equipment Market Size Growth Rate (CAGR) by Country (US$ Million): 2018 VS 2022 VS 2029
Table 44. APAC Coherent Optical Communication Equipment Market Size by Type (2018-2023) & (US$ Million)
Table 45. APAC Coherent Optical Communication Equipment Market Size by Type (2024-2029) & (US$ Million)
Table 46. APAC Coherent Optical Communication Equipment Market Size by Application (2018-2023) & (US$ Million)
Table 47. APAC Coherent Optical Communication Equipment Market Size by Application (2024-2029) & (US$ Million)
Table 48. APAC Coherent Optical Communication Equipment Market Size Growth Rate (CAGR) by Country (US$ Million): 2018 VS 2022 VS 2029
Table 49. APAC Coherent Optical Communication Equipment Market Size by Region (2018-2023) & (US$ Million)
Table 50. APAC Coherent Optical Communication Equipment Market Size by Region (2024-2029) & (US$ Million)
Table 51. Huawei Technologies Company Details
Table 52. Huawei Technologies Business Overview
Table 53. Huawei Technologies Coherent Optical Communication Equipment Product
Table 54. Huawei Technologies Revenue in Coherent Optical Communication Equipment Business (2018-2023) & (US$ Million)
Table 55. Huawei Technologies Recent Development
Table 56. Ciena Company Details
Table 57. Ciena Business Overview
Table 58. Ciena Coherent Optical Communication Equipment Product
Table 59. Ciena Revenue in Coherent Optical Communication Equipment Business (2018-2023) & (US$ Million)
Table 60. Ciena Recent Development
Table 61. Cisco Systems(Acacia) Company Details
Table 62. Cisco Systems(Acacia) Business Overview
Table 63. Cisco Systems(Acacia) Coherent Optical Communication Equipment Product
Table 64. Cisco Systems(Acacia) Revenue in Coherent Optical Communication Equipment Business (2018-2023) & (US$ Million)
Table 65. Cisco Systems(Acacia) Recent Development
Table 66. Nokia Company Details
Table 67. Nokia Business Overview
Table 68. Nokia Coherent Optical Communication Equipment Product
Table 69. Nokia Revenue in Coherent Optical Communication Equipment Business (2018-2023) & (US$ Million)
Table 70. Nokia Recent Development
Table 71. Infinera Corporation Company Details
Table 72. Infinera Corporation Business Overview
Table 73. Infinera Corporation Coherent Optical Communication Equipment Product
Table 74. Infinera Corporation Revenue in Coherent Optical Communication Equipment Business (2018-2023) & (US$ Million)
Table 75. Infinera Corporation Recent Development
Table 76. ZTE Company Details
Table 77. ZTE Business Overview
Table 78. ZTE Coherent Optical Communication Equipment Product
Table 79. ZTE Revenue in Coherent Optical Communication Equipment Business (2018-2023) & (US$ Million)
Table 80. ZTE Recent Development
Table 81. NEC Corporation Company Details
Table 82. NEC Corporation Business Overview
Table 83. NEC Corporation Coherent Optical Communication Equipment Product
Table 84. NEC Corporation Revenue in Coherent Optical Communication Equipment Business (2018-2023) & (US$ Million)
Table 85. NEC Corporation Recent Development
Table 86. ADVA Optical Networking Company Details
Table 87. ADVA Optical Networking Business Overview
Table 88. ADVA Optical Networking Coherent Optical Communication Equipment Product
Table 89. ADVA Optical Networking Revenue in Coherent Optical Communication Equipment Business (2018-2023) & (US$ Million)
Table 90. ADVA Optical Networking Recent Development
Table 91. Research Programs/Design for This Report
Table 92. Key Data Information from Secondary Sources
Table 93. Key Data Information from Primary Sources
List of Figures
Figure 1. Coherent Optical Communication Equipment Product Picture
Figure 2. Global Coherent Optical Communication Equipment Market Size, (US$ Million), 2018 VS 2022 VS 2029
Figure 3. Global Coherent Optical Communication Equipment Market Size 2018-2029 (US$ Million)
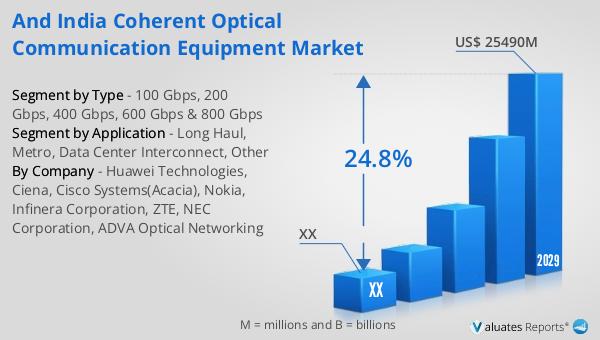
Figure 4. India Coherent Optical Communication Equipment Market Size, (US$ Million), 2018 VS 2022 VS 2029
Figure 5. India Coherent Optical Communication Equipment Market Size 2018-2029 (US$ Million)
Figure 6. India Coherent Optical Communication Equipment Market Share in Global 2018-2029
Figure 7. Coherent Optical Communication Equipment Report Years Considered
Figure 8. Product Picture of 100 Gbps
Figure 9. Product Picture of 200 Gbps
Figure 10. Product Picture of 400 Gbps
Figure 11. Product Picture of 600 Gbps & 800 Gbps
Figure 12. Global Coherent Optical Communication Equipment Market Share by Type in 2022 & 2029
Figure 13. Global Coherent Optical Communication Equipment Market Size by Type (2018-2029) & (US$ Million)
Figure 14. Global Coherent Optical Communication Equipment Market Share by Type (2018-2029)
Figure 15. India Coherent Optical Communication Equipment Market Share by Type in 2022 & 2029
Figure 16. India Coherent Optical Communication Equipment Market Size by Type (2018-2029) & (US$ Million)
Figure 17. India Coherent Optical Communication Equipment Market Share by Type (2018-2029)
Figure 18. Product Picture of Long Haul
Figure 19. Product Picture of Metro
Figure 20. Product Picture of Data Center Interconnect
Figure 21. Product Picture of Other
Figure 22. Global Coherent Optical Communication Equipment Market Share by Application in 2022 & 2029
Figure 23. Global Coherent Optical Communication Equipment Market Size by Application (2018-2029) & (US$ Million)
Figure 24. Global Coherent Optical Communication Equipment Market Share by Application (2018-2029)
Figure 25. India Coherent Optical Communication Equipment Market Share by Application in 2022 & 2029
Figure 26. India Coherent Optical Communication Equipment Market Size by Application (2018-2029) & (US$ Million)
Figure 27. India Coherent Optical Communication Equipment Market Share by Application (2018-2029)
Figure 28. The Top 5 and 10 Largest Companies of Coherent Optical Communication Equipment in the World: Market Share by Coherent Optical Communication Equipment Revenue in 2022
Figure 29. Global Coherent Optical Communication Equipment Market Size Market Share by Region: 2018 VS 2022 VS 2029
Figure 30. Global Coherent Optical Communication Equipment Market Share by Region (2018-2029)
Figure 31. Americas Coherent Optical Communication Equipment Market Size Growth Rate 2018-2029 (US$ Million)
Figure 32. Americas Coherent Optical Communication Equipment Market Share by Type (2018-2029)
Figure 33. Americas Coherent Optical Communication Equipment Market Share by Application (2018-2029)
Figure 34. United States Coherent Optical Communication Equipment Market Size Growth Rate (2018-2029) & (US$ Million)
Figure 35. Canada Coherent Optical Communication Equipment Market Size Growth Rate (2018-2029) & (US$ Million)
Figure 36. Mexico Coherent Optical Communication Equipment Market Size Growth Rate (2018-2029) & (US$ Million)
Figure 37. Brazil Coherent Optical Communication Equipment Market Size Growth Rate (2018-2029) & (US$ Million)
Figure 38. EMEA Coherent Optical Communication Equipment Market Size Growth Rate 2018-2029 (US$ Million)
Figure 39. EMEA Coherent Optical Communication Equipment Market Share by Type (2018-2029)
Figure 40. EMEA Coherent Optical Communication Equipment Market Share by Application (2018-2029)
Figure 41. Europe Coherent Optical Communication Equipment Market Size Growth Rate (2018-2029) & (US$ Million)
Figure 42. Middle East Coherent Optical Communication Equipment Market Size Growth Rate (2018-2029) & (US$ Million)
Figure 43. Africa Coherent Optical Communication Equipment Market Size Growth Rate (2018-2029) & (US$ Million)
Figure 44. China Coherent Optical Communication Equipment Market Size Growth Rate 2018-2029 (US$ Million)
Figure 45. China Coherent Optical Communication Equipment Market Share by Type (2018-2029)
Figure 46. China Coherent Optical Communication Equipment Market Share by Application (2018-2029)
Figure 47. APAC Coherent Optical Communication Equipment Market Size Growth Rate 2018-2029 (US$ Million)
Figure 48. APAC Coherent Optical Communication Equipment Market Share by Type (2018-2029)
Figure 49. APAC Coherent Optical Communication Equipment Market Share by Application (2018-2029)
Figure 50. Japan Coherent Optical Communication Equipment Market Size Growth Rate (2018-2029) & (US$ Million)
Figure 51. South Korea Coherent Optical Communication Equipment Market Size Growth Rate (2018-2029) & (US$ Million)
Figure 52. China Taiwan Coherent Optical Communication Equipment Market Size Growth Rate (2018-2029) & (US$ Million)
Figure 53. Southeast Asia Coherent Optical Communication Equipment Market Size Growth Rate (2018-2029) & (US$ Million)
Figure 54. India Coherent Optical Communication Equipment Market Size Growth Rate (2018-2029) & (US$ Million)
Figure 55. Huawei Technologies Revenue Growth Rate in Coherent Optical Communication Equipment Business (2018-2023)
Figure 56. Ciena Revenue Growth Rate in Coherent Optical Communication Equipment Business (2018-2023)
Figure 57. Cisco Systems(Acacia) Revenue Growth Rate in Coherent Optical Communication Equipment Business (2018-2023)
Figure 58. Nokia Revenue Growth Rate in Coherent Optical Communication Equipment Business (2018-2023)
Figure 59. Infinera Corporation Revenue Growth Rate in Coherent Optical Communication Equipment Business (2018-2023)
Figure 60. ZTE Revenue Growth Rate in Coherent Optical Communication Equipment Business (2018-2023)
Figure 61. NEC Corporation Revenue Growth Rate in Coherent Optical Communication Equipment Business (2018-2023)
Figure 62. ADVA Optical Networking Revenue Growth Rate in Coherent Optical Communication Equipment Business (2018-2023)
Figure 63. Bottom-up and Top-down Approaches for This Report
Figure 64. Data Triangulation
Figure 65. Key Executives Interviewed