List of Tables
Table 1. Global Vendor Management System (VMS) Software Market Size Growth Rate by Type (US$ Million): 2021 vs 2025 vs 2032
Table 2. Key Players of Cloud Based
Table 3. Key Players of On-premises
Table 4. Global Vendor Management System (VMS) Software Market Size Growth Rate by Business Model (US$ Million): 2021 vs 2025 vs 2032
Table 5. Key Players of Subscription
Table 6. Key Players of Percentage-of-Spend Fees
Table 7. Key Players of Usage-based Pricing
Table 8. Key Players of Hybrid Pricing Models
Table 9. Global Vendor Management System (VMS) Software Market Size Growth Rate by Ecosystem Role (US$ Million): 2021 vs 2025 vs 2032
Table 10. Key Players of Standalone
Table 11. Key Players of MSP-Enabled
Table 12. Global Vendor Management System (VMS) Software Market Size Growth Rate by Enterprise Type (US$ Million): 2021 vs 2025 vs 2032
Table 13. Key Players of SMEs
Table 14. Key Players of Large Enterprises
Table 15. Global Vendor Management System (VMS) Software Market Size Growth by Application (US$ Million): 2021 vs 2025 vs 2032
Table 16. Global Vendor Management System (VMS) Software Market Size by Region (US$ Million): 2021 vs 2025 vs 2032
Table 17. Global Vendor Management System (VMS) Software Market Size by Region (US$ Million), 2021–2026
Table 18. Global Vendor Management System (VMS) Software Market Share by Region (2021–2026)
Table 19. Global Vendor Management System (VMS) Software Forecasted Market Size by Region (US$ Million), 2027–2032
Table 20. Global Vendor Management System (VMS) Software Market Share by Region (2027–2032)
Table 21. Vendor Management System (VMS) Software Market Trends
Table 22. Vendor Management System (VMS) Software Market Drivers
Table 23. Vendor Management System (VMS) Software Market Challenges
Table 24. Vendor Management System (VMS) Software Market Restraints
Table 25. Global Vendor Management System (VMS) Software Revenue by Players (US$ Million), 2021–2026
Table 26. Global Vendor Management System (VMS) Software Market Share by Players (2021–2026)
Table 27. Global Top Vendor Management System (VMS) Software Players by Tier (Tier 1, Tier 2, and Tier 3), based on Vendor Management System (VMS) Software Revenue, 2025
Table 28. Ranking of Global Top Vendor Management System (VMS) Software Companies by Revenue (US$ Million) in 2025
Table 29. Global 5 Largest Players Market Share by Vendor Management System (VMS) Software Revenue (CR5 and HHI), 2021–2026
Table 30. Global Key Players of Vendor Management System (VMS) Software, Headquarters and Area Served
Table 31. Global Key Players of Vendor Management System (VMS) Software, Products and Applications
Table 32. Global Key Players of Vendor Management System (VMS) Software, Date of General Availability (GA)
Table 33. Mergers and Acquisitions, Expansion Plans
Table 34. Global Vendor Management System (VMS) Software Market Size by Type (US$ Million), 2021–2026
Table 35. Global Vendor Management System (VMS) Software Revenue Market Share by Type (2021–2026)
Table 36. Global Vendor Management System (VMS) Software Forecasted Market Size by Type (US$ Million), 2027–2032
Table 37. Global Vendor Management System (VMS) Software Revenue Market Share by Type (2027–2032)
Table 38. Global Vendor Management System (VMS) Software Market Size by Application (US$ Million), 2021–2026
Table 39. Global Vendor Management System (VMS) Software Revenue Market Share by Application (2021–2026)
Table 40. Global Vendor Management System (VMS) Software Forecasted Market Size by Application (US$ Million), 2027–2032
Table 41. Global Vendor Management System (VMS) Software Revenue Market Share by Application (2027–2032)
Table 42. North America Vendor Management System (VMS) Software Market Size Growth Rate by Country (US$ Million): 2021 vs 2025 vs 2032
Table 43. North America Vendor Management System (VMS) Software Market Size by Country (US$ Million), 2021–2026
Table 44. North America Vendor Management System (VMS) Software Market Size by Country (US$ Million), 2027–2032
Table 45. Europe Vendor Management System (VMS) Software Market Size Growth Rate by Country (US$ Million): 2021 vs 2025 vs 2032
Table 46. Europe Vendor Management System (VMS) Software Market Size by Country (US$ Million), 2021–2026
Table 47. Europe Vendor Management System (VMS) Software Market Size by Country (US$ Million), 2027–2032
Table 48. Asia-Pacific Vendor Management System (VMS) Software Market Size Growth Rate by Region (US$ Million): 2021 vs 2025 vs 2032
Table 49. Asia-Pacific Vendor Management System (VMS) Software Market Size by Region (US$ Million), 2021–2026
Table 50. Asia-Pacific Vendor Management System (VMS) Software Market Size by Region (US$ Million), 2027–2032
Table 51. Latin America Vendor Management System (VMS) Software Market Size Growth Rate by Country (US$ Million): 2021 vs 2025 vs 2032
Table 52. Latin America Vendor Management System (VMS) Software Market Size by Country (US$ Million), 2021–2026
Table 53. Latin America Vendor Management System (VMS) Software Market Size by Country (US$ Million), 2027–2032
Table 54. Middle East & Africa Vendor Management System (VMS) Software Market Size Growth Rate by Country (US$ Million): 2021 vs 2025 vs 2032
Table 55. Middle East & Africa Vendor Management System (VMS) Software Market Size by Country (US$ Million), 2021–2026
Table 56. Middle East & Africa Vendor Management System (VMS) Software Market Size by Country (US$ Million), 2027–2032
Table 57. SAP Company Details
Table 58. SAP Business Overview
Table 59. SAP Vendor Management System (VMS) Software Product
Table 60. SAP Revenue in Vendor Management System (VMS) Software Business (US$ Million), 2021–2026
Table 61. SAP Recent Development
Table 62. AgileOne (ActOne Group) Company Details
Table 63. AgileOne (ActOne Group) Business Overview
Table 64. AgileOne (ActOne Group) Vendor Management System (VMS) Software Product
Table 65. AgileOne (ActOne Group) Revenue in Vendor Management System (VMS) Software Business (US$ Million), 2021–2026
Table 66. AgileOne (ActOne Group) Recent Development
Table 67. Magnit Company Details
Table 68. Magnit Business Overview
Table 69. Magnit Vendor Management System (VMS) Software Product
Table 70. Magnit Revenue in Vendor Management System (VMS) Software Business (US$ Million), 2021–2026
Table 71. Magnit Recent Development
Table 72. Beeline Company Details
Table 73. Beeline Business Overview
Table 74. Beeline Vendor Management System (VMS) Software Product
Table 75. Beeline Revenue in Vendor Management System (VMS) Software Business (US$ Million), 2021–2026
Table 76. Beeline Recent Development
Table 77. Oracle Company Details
Table 78. Oracle Business Overview
Table 79. Oracle Vendor Management System (VMS) Software Product
Table 80. Oracle Revenue in Vendor Management System (VMS) Software Business (US$ Million), 2021–2026
Table 81. Oracle Recent Development
Table 82. Workday Company Details
Table 83. Workday Business Overview
Table 84. Workday Vendor Management System (VMS) Software Product
Table 85. Workday Revenue in Vendor Management System (VMS) Software Business (US$ Million), 2021–2026
Table 86. Workday Recent Development
Table 87. GEP Company Details
Table 88. GEP Business Overview
Table 89. GEP Vendor Management System (VMS) Software Product
Table 90. GEP Revenue in Vendor Management System (VMS) Software Business (US$ Million), 2021–2026
Table 91. GEP Recent Development
Table 92. Coupa Company Details
Table 93. Coupa Business Overview
Table 94. Coupa Vendor Management System (VMS) Software Product
Table 95. Coupa Revenue in Vendor Management System (VMS) Software Business (US$ Million), 2021–2026
Table 96. Coupa Recent Development
Table 97. Ncontracts Company Details
Table 98. Ncontracts Business Overview
Table 99. Ncontracts Vendor Management System (VMS) Software Product
Table 100. Ncontracts Revenue in Vendor Management System (VMS) Software Business (US$ Million), 2021–2026
Table 101. Ncontracts Recent Development
Table 102. Ceipal Company Details
Table 103. Ceipal Business Overview
Table 104. Ceipal Vendor Management System (VMS) Software Product
Table 105. Ceipal Revenue in Vendor Management System (VMS) Software Business (US$ Million), 2021–2026
Table 106. Ceipal Recent Development
Table 107. Pixid Group Company Details
Table 108. Pixid Group Business Overview
Table 109. Pixid Group Vendor Management System (VMS) Software Product
Table 110. Pixid Group Revenue in Vendor Management System (VMS) Software Business (US$ Million), 2021–2026
Table 111. Pixid Group Recent Development
Table 112. SimplifyVMS Company Details
Table 113. SimplifyVMS Business Overview
Table 114. SimplifyVMS Vendor Management System (VMS) Software Product
Table 115. SimplifyVMS Revenue in Vendor Management System (VMS) Software Business (US$ Million), 2021–2026
Table 116. SimplifyVMS Recent Development
Table 117. Tradeshift Company Details
Table 118. Tradeshift Business Overview
Table 119. Tradeshift Vendor Management System (VMS) Software Product
Table 120. Tradeshift Revenue in Vendor Management System (VMS) Software Business (US$ Million), 2021–2026
Table 121. Tradeshift Recent Development
Table 122. Vanta Company Details
Table 123. Vanta Business Overview
Table 124. Vanta Vendor Management System (VMS) Software Product
Table 125. Vanta Revenue in Vendor Management System (VMS) Software Business (US$ Million), 2021–2026
Table 126. Vanta Recent Development
Table 127. Trio Workforce Solutions Company Details
Table 128. Trio Workforce Solutions Business Overview
Table 129. Trio Workforce Solutions Vendor Management System (VMS) Software Product
Table 130. Trio Workforce Solutions Revenue in Vendor Management System (VMS) Software Business (US$ Million), 2021–2026
Table 131. Trio Workforce Solutions Recent Development
Table 132. Eqip Company Details
Table 133. Eqip Business Overview
Table 134. Eqip Vendor Management System (VMS) Software Product
Table 135. Eqip Revenue in Vendor Management System (VMS) Software Business (US$ Million), 2021–2026
Table 136. Eqip Recent Development
Table 137. Ivalua Company Details
Table 138. Ivalua Business Overview
Table 139. Ivalua Vendor Management System (VMS) Software Product
Table 140. Ivalua Revenue in Vendor Management System (VMS) Software Business (US$ Million), 2021–2026
Table 141. Ivalua Recent Development
Table 142. Gatekeeper Company Details
Table 143. Gatekeeper Business Overview
Table 144. Gatekeeper Vendor Management System (VMS) Software Product
Table 145. Gatekeeper Revenue in Vendor Management System (VMS) Software Business (US$ Million), 2021–2026
Table 146. Gatekeeper Recent Development
Table 147. Paylocity Company Details
Table 148. Paylocity Business Overview
Table 149. Paylocity Vendor Management System (VMS) Software Product
Table 150. Paylocity Revenue in Vendor Management System (VMS) Software Business (US$ Million), 2021–2026
Table 151. Paylocity Recent Development
Table 152. Prosperix Company Details
Table 153. Prosperix Business Overview
Table 154. Prosperix Vendor Management System (VMS) Software Product
Table 155. Prosperix Revenue in Vendor Management System (VMS) Software Business (US$ Million), 2021–2026
Table 156. Prosperix Recent Development
Table 157. DirectSkills(zvoove) Company Details
Table 158. DirectSkills(zvoove) Business Overview
Table 159. DirectSkills(zvoove) Vendor Management System (VMS) Software Product
Table 160. DirectSkills(zvoove) Revenue in Vendor Management System (VMS) Software Business (US$ Million), 2021–2026
Table 161. DirectSkills(zvoove) Recent Development
Table 162. Flextrack Company Details
Table 163. Flextrack Business Overview
Table 164. Flextrack Vendor Management System (VMS) Software Product
Table 165. Flextrack Revenue in Vendor Management System (VMS) Software Business (US$ Million), 2021–2026
Table 166. Flextrack Recent Development
Table 167. Netive VMS Company Details
Table 168. Netive VMS Business Overview
Table 169. Netive VMS Vendor Management System (VMS) Software Product
Table 170. Netive VMS Revenue in Vendor Management System (VMS) Software Business (US$ Million), 2021–2026
Table 171. Netive VMS Recent Development
Table 172. CobbleStone Company Details
Table 173. CobbleStone Business Overview
Table 174. CobbleStone Vendor Management System (VMS) Software Product
Table 175. CobbleStone Revenue in Vendor Management System (VMS) Software Business (US$ Million), 2021–2026
Table 176. CobbleStone Recent Development
Table 177. Onspring Company Details
Table 178. Onspring Business Overview
Table 179. Onspring Vendor Management System (VMS) Software Product
Table 180. Onspring Revenue in Vendor Management System (VMS) Software Business (US$ Million), 2021–2026
Table 181. Onspring Recent Development
Table 182. Flentis Company Details
Table 183. Flentis Business Overview
Table 184. Flentis Vendor Management System (VMS) Software Product
Table 185. Flentis Revenue in Vendor Management System (VMS) Software Business (US$ Million), 2021–2026
Table 186. Flentis Recent Development
Table 187. Kissflow Company Details
Table 188. Kissflow Business Overview
Table 189. Kissflow Vendor Management System (VMS) Software Product
Table 190. Kissflow Revenue in Vendor Management System (VMS) Software Business (US$ Million), 2021–2026
Table 191. Kissflow Recent Development
Table 192. Conexis VMS Company Details
Table 193. Conexis VMS Business Overview
Table 194. Conexis VMS Vendor Management System (VMS) Software Product
Table 195. Conexis VMS Revenue in Vendor Management System (VMS) Software Business (US$ Million), 2021–2026
Table 196. Conexis VMS Recent Development
Table 197. BridgeVMS Company Details
Table 198. BridgeVMS Business Overview
Table 199. BridgeVMS Vendor Management System (VMS) Software Product
Table 200. BridgeVMS Revenue in Vendor Management System (VMS) Software Business (US$ Million), 2021–2026
Table 201. BridgeVMS Recent Development
Table 202. Research Programs/Design for This Report
Table 203. Key Data Information from Secondary Sources
Table 204. Key Data Information from Primary Sources
Table 205. Authors List of This Report
List of Figures
Figure 1. Vendor Management System (VMS) Software Picture
Figure 2. Global Vendor Management System (VMS) Software Market Size Comparison by Type (US$ Million), 2021–2032
Figure 3. Global Vendor Management System (VMS) Software Market Share by Type: 2025 vs 2032
Figure 4. Cloud Based Features
Figure 5. On-premises Features
Figure 6. Global Vendor Management System (VMS) Software Market Size Comparison by Business Model (US$ Million), 2021–2032
Figure 7. Subscription Features
Figure 8. Percentage-of-Spend Fees Features
Figure 9. Usage-based Pricing Features
Figure 10. Hybrid Pricing Models Features
Figure 11. Global Vendor Management System (VMS) Software Market Size Comparison by Ecosystem Role (US$ Million), 2021–2032
Figure 12. Standalone Features
Figure 13. MSP-Enabled Features
Figure 14. Global Vendor Management System (VMS) Software Market Size Comparison by Enterprise Type (US$ Million), 2021–2032
Figure 15. SMEs Features
Figure 16. Large Enterprises Features
Figure 17. Global Vendor Management System (VMS) Software Market Size by Application (US$ Million), 2021–2032
Figure 18. Global Vendor Management System (VMS) Software Market Share by Application: 2025 vs 2032
Figure 19. BFSI & Professional Services Case Studies
Figure 20. Healthcare & Life Sciences Case Studies
Figure 21. IT & High-Tech Case Studies
Figure 22. Manufacturing & Energy Case Studies
Figure 23. Retail & Logistics Case Studies
Figure 24. Construction & Engineering Case Studies
Figure 25. Others Case Studies
Figure 26. Vendor Management System (VMS) Software Report Years Considered
Figure 27. Global Vendor Management System (VMS) Software Market Size (US$ Million), Year-over-Year: 2021–2032
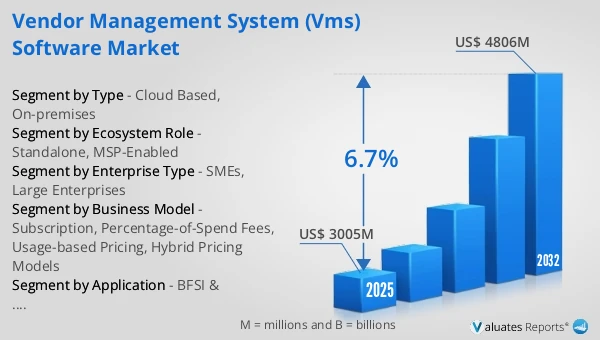
Figure 28. Global Vendor Management System (VMS) Software Market Size, (US$ Million), 2021 vs 2025 vs 2032
Figure 29. Global Vendor Management System (VMS) Software Market Share by Region: 2025 vs 2032
Figure 30. Global Vendor Management System (VMS) Software Market Share by Players in 2025
Figure 31. Global Vendor Management System (VMS) Software Market Share by Company Type (Tier 1, Tier 2, and Tier 3)
Figure 32. The Top 10 and 5 Players Market Share by Vendor Management System (VMS) Software Revenue in 2025
Figure 33. North America Vendor Management System (VMS) Software Market Size YoY Growth (US$ Million), 2021–2032
Figure 34. North America Vendor Management System (VMS) Software Market Share by Country (2021–2032)
Figure 35. United States Vendor Management System (VMS) Software Market Size YoY Growth (US$ Million), 2021–2032
Figure 36. Canada Vendor Management System (VMS) Software Market Size YoY Growth (US$ Million), 2021–2032
Figure 37. Europe Vendor Management System (VMS) Software Market Size YoY Growth (US$ Million), 2021–2032
Figure 38. Europe Vendor Management System (VMS) Software Market Share by Country (2021–2032)
Figure 39. Germany Vendor Management System (VMS) Software Market Size YoY Growth (US$ Million), 2021–2032
Figure 40. France Vendor Management System (VMS) Software Market Size YoY Growth (US$ Million), 2021–2032
Figure 41. U.K. Vendor Management System (VMS) Software Market Size YoY Growth (US$ Million), 2021–2032
Figure 42. Italy Vendor Management System (VMS) Software Market Size YoY Growth (US$ Million), 2021–2032
Figure 43. Russia Vendor Management System (VMS) Software Market Size YoY Growth (US$ Million), 2021–2032
Figure 44. Ireland Vendor Management System (VMS) Software Market Size YoY Growth (US$ Million), 2021–2032
Figure 45. Asia-Pacific Vendor Management System (VMS) Software Market Size YoY Growth (US$ Million), 2021–2032
Figure 46. Asia-Pacific Vendor Management System (VMS) Software Market Share by Region (2021–2032)
Figure 47. China Vendor Management System (VMS) Software Market Size YoY Growth (US$ Million), 2021–2032
Figure 48. Japan Vendor Management System (VMS) Software Market Size YoY Growth (US$ Million), 2021–2032
Figure 49. South Korea Vendor Management System (VMS) Software Market Size YoY Growth (US$ Million), 2021–2032
Figure 50. Southeast Asia Vendor Management System (VMS) Software Market Size YoY Growth (US$ Million), 2021–2032
Figure 51. India Vendor Management System (VMS) Software Market Size YoY Growth (US$ Million), 2021–2032
Figure 52. Australia & New Zealand Vendor Management System (VMS) Software Market Size YoY Growth (US$ Million), 2021–2032
Figure 53. Latin America Vendor Management System (VMS) Software Market Size YoY Growth (US$ Million), 2021–2032
Figure 54. Latin America Vendor Management System (VMS) Software Market Share by Country (2021–2032)
Figure 55. Mexico Vendor Management System (VMS) Software Market Size YoY Growth (US$ Million), 2021–2032
Figure 56. Brazil Vendor Management System (VMS) Software Market Size YoY Growth (US$ Million), 2021–2032
Figure 57. Middle East & Africa Vendor Management System (VMS) Software Market Size YoY Growth (US$ Million), 2021–2032
Figure 58. Middle East & Africa Vendor Management System (VMS) Software Market Share by Country (2021–2032)
Figure 59. Israel Vendor Management System (VMS) Software Market Size YoY Growth (US$ Million), 2021–2032
Figure 60. Saudi Arabia Vendor Management System (VMS) Software Market Size YoY Growth (US$ Million), 2021–2032
Figure 61. UAE Vendor Management System (VMS) Software Market Size YoY Growth (US$ Million), 2021–2032
Figure 62. SAP Revenue Growth Rate in Vendor Management System (VMS) Software Business (2021–2026)
Figure 63. AgileOne (ActOne Group) Revenue Growth Rate in Vendor Management System (VMS) Software Business (2021–2026)
Figure 64. Magnit Revenue Growth Rate in Vendor Management System (VMS) Software Business (2021–2026)
Figure 65. Beeline Revenue Growth Rate in Vendor Management System (VMS) Software Business (2021–2026)
Figure 66. Oracle Revenue Growth Rate in Vendor Management System (VMS) Software Business (2021–2026)
Figure 67. Workday Revenue Growth Rate in Vendor Management System (VMS) Software Business (2021–2026)
Figure 68. GEP Revenue Growth Rate in Vendor Management System (VMS) Software Business (2021–2026)
Figure 69. Coupa Revenue Growth Rate in Vendor Management System (VMS) Software Business (2021–2026)
Figure 70. Ncontracts Revenue Growth Rate in Vendor Management System (VMS) Software Business (2021–2026)
Figure 71. Ceipal Revenue Growth Rate in Vendor Management System (VMS) Software Business (2021–2026)
Figure 72. Pixid Group Revenue Growth Rate in Vendor Management System (VMS) Software Business (2021–2026)
Figure 73. SimplifyVMS Revenue Growth Rate in Vendor Management System (VMS) Software Business (2021–2026)
Figure 74. Tradeshift Revenue Growth Rate in Vendor Management System (VMS) Software Business (2021–2026)
Figure 75. Vanta Revenue Growth Rate in Vendor Management System (VMS) Software Business (2021–2026)
Figure 76. Trio Workforce Solutions Revenue Growth Rate in Vendor Management System (VMS) Software Business (2021–2026)
Figure 77. Eqip Revenue Growth Rate in Vendor Management System (VMS) Software Business (2021–2026)
Figure 78. Ivalua Revenue Growth Rate in Vendor Management System (VMS) Software Business (2021–2026)
Figure 79. Gatekeeper Revenue Growth Rate in Vendor Management System (VMS) Software Business (2021–2026)
Figure 80. Paylocity Revenue Growth Rate in Vendor Management System (VMS) Software Business (2021–2026)
Figure 81. Prosperix Revenue Growth Rate in Vendor Management System (VMS) Software Business (2021–2026)
Figure 82. DirectSkills(zvoove) Revenue Growth Rate in Vendor Management System (VMS) Software Business (2021–2026)
Figure 83. Flextrack Revenue Growth Rate in Vendor Management System (VMS) Software Business (2021–2026)
Figure 84. Netive VMS Revenue Growth Rate in Vendor Management System (VMS) Software Business (2021–2026)
Figure 85. CobbleStone Revenue Growth Rate in Vendor Management System (VMS) Software Business (2021–2026)
Figure 86. Onspring Revenue Growth Rate in Vendor Management System (VMS) Software Business (2021–2026)
Figure 87. Flentis Revenue Growth Rate in Vendor Management System (VMS) Software Business (2021–2026)
Figure 88. Kissflow Revenue Growth Rate in Vendor Management System (VMS) Software Business (2021–2026)
Figure 89. Conexis VMS Revenue Growth Rate in Vendor Management System (VMS) Software Business (2021–2026)
Figure 90. BridgeVMS Revenue Growth Rate in Vendor Management System (VMS) Software Business (2021–2026)
Figure 91. Bottom-up and Top-down Approaches for This Report
Figure 92. Data Triangulation
Figure 93. Key Executives Interviewed