0
U.S. (TOLL FREE)
+1 (315) 215-3225
Automative

0
U.S. (TOLL FREE)
+1 (315) 215-3225
Global Power SiC Market Research Report 2025
Published Date: May 2025
|
Report Code: QYRE-Auto-34I15103
Home | Market Reports | Computers & Electronics| Electronics & Electrical| Electronic Components
Global Power SiC Market Research Report 2023
BUY CHAPTERS

Global Power SiC Market Research Report 2025

Code: QYRE-Auto-34I15103
Report
May 2025
Pages:153
QYResearch
Buy Now with 15% Discount
DESCRIPTION
TABLE OF CONTENT
TABLES & FIGURES

Power SiC Market Size

The global market for Power SiC was valued at US$ 4017 million in the year 2024 and is projected to reach a revised size of US$ 24620 million by 2031, growing at a CAGR of 30.0% during the forecast period.

Power SiC Market

Power SiC Market

This report studies the SiC Based Power Electronics, key segments cover SiC MOSFET, SiC Schottky Barrier Diodes (SBDs), SiC FETs, SiC JFETs etc.
Silicon carbide MOSFETs have the characteristics of low on-resistance and small switching losses, which can reduce device losses and improve system efficiency, and are more suitable for high-frequency circuits. It is widely used in the fields of new energy vehicle motor controller, vehicle power supply, solar inverter, charging pile, UPS, PFC power supply and other fields.
A silicon carbide (SiC) schottky diode is a semiconductor diode formed by the junction of a semiconductor with a metal. SiC Schottky barrier diodes have a much lower reverse leakage current than their Si counterparts and also a higher forward voltage. They significantly reduce losses and can therefore be used to increase system efficiency and reduce product size.
The key players of SiC MOSFET modules are STMicroelectronics, Infineon, Wolfspeed, Rohm, Onsemi, BYD Semiconductor, Microchip (Microsemi), Mitsubishi Electric (Vincotech) and Semikron Danfoss, etc. The top three players hold a share over 70 percent. The key players of SiC MOSFET Discrete are STMicroelectronics, Infineon, Wolfspeed, Rohm, and CETC 55, etc. The top five players hold a share over 80 percent. The key players of SiC SBD are STMicroelectronics, Infineon, Wolfspeed, Rohm, onsemi, Microchip (Microsemi), and San'an Optoelectronics, etc. The top five players hold a share over 70 percent.

Report Scope

This report aims to provide a comprehensive presentation of the global market for Power SiC, with both quantitative and qualitative analysis, to help readers develop business/growth strategies, assess the market competitive situation, analyze their position in the current marketplace, and make informed business decisions regarding Power SiC.
The Power SiC market size, estimations, and forecasts are provided in terms of output/shipments (K Units) and revenue ($ millions), considering 2024 as the base year, with history and forecast data for the period from 2020 to 2031. This report segments the global Power SiC market comprehensively. Regional market sizes, concerning products by Type, by Application, and by players, are also provided.
For a more in-depth understanding of the market, the report provides profiles of the competitive landscape, key competitors, and their respective market ranks. The report also discusses technological trends and new product developments.
The report will help the Power SiC manufacturers, new entrants, and industry chain related companies in this market with information on the revenues, production, and average price for the overall market and the sub-segments across the different segments, by company, by Type, by Application, and by regions.
Market Segmentation

Scope of Power SiC Market Report

Report Metric Details
Report Name Power SiC Market
Accounted market size in year US$ 4017 million
Forecasted market size in 2031 US$ 24620 million
CAGR 30.0%
Base Year year
Forecasted years 2025 - 2031
by Type
by Application
  • Automotive & EV/HEV
  • EV Charging
  • Industrial Motor/Drive
  • PV, Energy Storage, Wind Power
  • UPS, Data Center & Server
  • Rail Transport
  • Others
Production by Region
  • North America
  • Europe
  • China
  • Japan
Consumption by Region
  • North America (United States, Canada)
  • Europe (Germany, France, UK, Italy, Russia)
  • Asia-Pacific (China, Japan, South Korea, Taiwan)
  • Southeast Asia (India)
  • Latin America (Mexico, Brazil)
By Company STMicroelectronics, Infineon, Wolfspeed, Rohm, onsemi, BYD Semiconductor, Microchip (Microsemi), Mitsubishi Electric (Vincotech), Semikron Danfoss, Fuji Electric, Navitas (GeneSiC), Toshiba, Qorvo (UnitedSiC), San'an Optoelectronics, Littelfuse (IXYS), CETC 55, WeEn Semiconductors, BASiC Semiconductor, SemiQ, Diodes Incorporated, SanRex, Alpha & Omega Semiconductor, Bosch, KEC Corporation, PANJIT Group, Nexperia, Vishay Intertechnology, Zhuzhou CRRC Times Electric, China Resources Microelectronics Limited, StarPower, Yangzhou Yangjie Electronic Technology, Guangdong AccoPower Semiconductor, Changzhou Galaxy Century Microelectronics, Hangzhou Silan Microelectronics, Cissoid, SK powertech, InventChip Technology, Hebei Sinopack Electronic Technology, Oriental Semiconductor, Jilin Sino-Microelectronics, PN Junction Semiconductor (Hangzhou), United Nova Technology
Forecast units USD million in value
Report coverage Revenue and volume forecast, company share, competitive landscape, growth factors and trends

Chapter Outline

  • Chapter 1: Introduces the report scope of the report, executive summary of different market segments (by region, by Type, by Application, etc), including the market size of each market segment, future development potential, and so on. It offers a high-level view of the current state of the market and its likely evolution in the short to mid-term, and long term.
  • Chapter 2: Detailed analysis of Power SiC manufacturers competitive landscape, price, production and value market share, latest development plan, merger, and acquisition information, etc.
  • Chapter 3: Production/output, value of Power SiC by region/country. It provides a quantitative analysis of the market size and development potential of each region in the next six years.
  • Chapter 4: Consumption of Power SiC in regional level and country level. It provides a quantitative analysis of the market size and development potential of each region and its main countries and introduces the market development, future development prospects, market space, and production of each country in the world.
  • Chapter 5: Provides the analysis of various market segments by Type, covering the market size and development potential of each market segment, to help readers find the blue ocean market in different market segments.
  • Chapter 6: Provides the analysis of various market segments by Application, covering the market size and development potential of each market segment, to help readers find the blue ocean market in different downstream markets.
  • Chapter 7: Provides profiles of key players, introducing the basic situation of the main companies in the market in detail, including product production/output, value, price, gross margin, product introduction, recent development, etc.
  • Chapter 8: Analysis of industrial chain, including the upstream and downstream of the industry.
  • Chapter 9: Introduces the market dynamics, latest developments of the market, the driving factors and restrictive factors of the market, the challenges and risks faced by manufacturers in the industry, and the analysis of relevant policies in the industry.
  • Chapter 10: The main points and conclusions of the report.

FAQ for this report

How fast is Power SiC Market growing?

Ans: The Power SiC Market witnessing a CAGR of 30.0% during the forecast period 2025-2031.

What is the Power SiC Market size in 2031?

Ans: The Power SiC Market size in 2031 will be US$ 24620 million.

Who are the main players in the Power SiC Market report?

Ans: The main players in the Power SiC Market are STMicroelectronics, Infineon, Wolfspeed, Rohm, onsemi, BYD Semiconductor, Microchip (Microsemi), Mitsubishi Electric (Vincotech), Semikron Danfoss, Fuji Electric, Navitas (GeneSiC), Toshiba, Qorvo (UnitedSiC), San'an Optoelectronics, Littelfuse (IXYS), CETC 55, WeEn Semiconductors, BASiC Semiconductor, SemiQ, Diodes Incorporated, SanRex, Alpha & Omega Semiconductor, Bosch, KEC Corporation, PANJIT Group, Nexperia, Vishay Intertechnology, Zhuzhou CRRC Times Electric, China Resources Microelectronics Limited, StarPower, Yangzhou Yangjie Electronic Technology, Guangdong AccoPower Semiconductor, Changzhou Galaxy Century Microelectronics, Hangzhou Silan Microelectronics, Cissoid, SK powertech, InventChip Technology, Hebei Sinopack Electronic Technology, Oriental Semiconductor, Jilin Sino-Microelectronics, PN Junction Semiconductor (Hangzhou), United Nova Technology

What are the Application segmentation covered in the Power SiC Market report?

Ans: The Applications covered in the Power SiC Market report are Automotive & EV/HEV, EV Charging, Industrial Motor/Drive, PV, Energy Storage, Wind Power, UPS, Data Center & Server, Rail Transport, Others

What are the Type segmentation covered in the Power SiC Market report?

Ans: The Types covered in the Power SiC Market report are SiC MOSFET Module, SiC MOSFET Discrete, SiC Diode (SiC SBD), Others (SiC JFETs & FETs)

Recommended Reports

SiC MOSFET Markets

SiC Diode Markets

SiC Power Module

1 Power SiC Market Overview
1.1 Product Definition
1.2 Power SiC by Type
1.2.1 Global Power SiC Market Value Growth Rate Analysis by Type: 2024 VS 2031
1.2.2 SiC MOSFET Module
1.2.3 SiC MOSFET Discrete
1.2.4 SiC Diode (SiC SBD)
1.2.5 Others (SiC JFETs & FETs)
1.3 Power SiC by Application
1.3.1 Global Power SiC Market Value Growth Rate Analysis by Application: 2024 VS 2031
1.3.2 Automotive & EV/HEV
1.3.3 EV Charging
1.3.4 Industrial Motor/Drive
1.3.5 PV, Energy Storage, Wind Power
1.3.6 UPS, Data Center & Server
1.3.7 Rail Transport
1.3.8 Others
1.4 Global Market Growth Prospects
1.4.1 Global Power SiC Production Value Estimates and Forecasts (2020-2031)
1.4.2 Global Power SiC Production Capacity Estimates and Forecasts (2020-2031)
1.4.3 Global Power SiC Production Estimates and Forecasts (2020-2031)
1.4.4 Global Power SiC Market Average Price Estimates and Forecasts (2020-2031)
1.5 Assumptions and Limitations
2 Market Competition by Manufacturers
2.1 Global Power SiC Production Market Share by Manufacturers (2020-2025)
2.2 Global Power SiC Production Value Market Share by Manufacturers (2020-2025)
2.3 Global Key Players of Power SiC, Industry Ranking, 2023 VS 2024
2.4 Global Power SiC Market Share by Company Type (Tier 1, Tier 2, and Tier 3)
2.5 Global Power SiC Average Price by Manufacturers (2020-2025)
2.6 Global Key Manufacturers of Power SiC, Manufacturing Base Distribution and Headquarters
2.7 Global Key Manufacturers of Power SiC, Product Offered and Application
2.8 Global Key Manufacturers of Power SiC, Date of Enter into This Industry
2.9 Power SiC Market Competitive Situation and Trends
2.9.1 Power SiC Market Concentration Rate
2.9.2 Global 5 and 10 Largest Power SiC Players Market Share by Revenue
2.10 Mergers & Acquisitions, Expansion
3 Power SiC Production by Region
3.1 Global Power SiC Production Value Estimates and Forecasts by Region: 2020 VS 2024 VS 2031
3.2 Global Power SiC Production Value by Region (2020-2031)
3.2.1 Global Power SiC Production Value by Region (2020-2025)
3.2.2 Global Forecasted Production Value of Power SiC by Region (2026-2031)
3.3 Global Power SiC Production Estimates and Forecasts by Region: 2020 VS 2024 VS 2031
3.4 Global Power SiC Production Volume by Region (2020-2031)
3.4.1 Global Power SiC Production by Region (2020-2025)
3.4.2 Global Forecasted Production of Power SiC by Region (2026-2031)
3.5 Global Power SiC Market Price Analysis by Region (2020-2025)
3.6 Global Power SiC Production and Value, Year-over-Year Growth
3.6.1 North America Power SiC Production Value Estimates and Forecasts (2020-2031)
3.6.2 Europe Power SiC Production Value Estimates and Forecasts (2020-2031)
3.6.3 China Power SiC Production Value Estimates and Forecasts (2020-2031)
3.6.4 Japan Power SiC Production Value Estimates and Forecasts (2020-2031)
4 Power SiC Consumption by Region
4.1 Global Power SiC Consumption Estimates and Forecasts by Region: 2020 VS 2024 VS 2031
4.2 Global Power SiC Consumption by Region (2020-2031)
4.2.1 Global Power SiC Consumption by Region (2020-2025)
4.2.2 Global Power SiC Forecasted Consumption by Region (2026-2031)
4.3 North America
4.3.1 North America Power SiC Consumption Growth Rate by Country: 2020 VS 2024 VS 2031
4.3.2 North America Power SiC Consumption by Country (2020-2031)
4.3.3 U.S.
4.3.4 Canada
4.4 Europe
4.4.1 Europe Power SiC Consumption Growth Rate by Country: 2020 VS 2024 VS 2031
4.4.2 Europe Power SiC Consumption by Country (2020-2031)
4.4.3 Germany
4.4.4 France
4.4.5 U.K.
4.4.6 Italy
4.4.7 Netherlands
4.5 Asia Pacific
4.5.1 Asia Pacific Power SiC Consumption Growth Rate by Region: 2020 VS 2024 VS 2031
4.5.2 Asia Pacific Power SiC Consumption by Region (2020-2031)
4.5.3 China
4.5.4 Japan
4.5.5 South Korea
4.5.6 China Taiwan
4.5.7 Southeast Asia
4.5.8 India
4.6 Latin America, Middle East & Africa
4.6.1 Latin America, Middle East & Africa Power SiC Consumption Growth Rate by Country: 2020 VS 2024 VS 2031
4.6.2 Latin America, Middle East & Africa Power SiC Consumption by Country (2020-2031)
4.6.3 Mexico
4.6.4 Brazil
4.6.5 Israel
5 Segment by Type
5.1 Global Power SiC Production by Type (2020-2031)
5.1.1 Global Power SiC Production by Type (2020-2025)
5.1.2 Global Power SiC Production by Type (2026-2031)
5.1.3 Global Power SiC Production Market Share by Type (2020-2031)
5.2 Global Power SiC Production Value by Type (2020-2031)
5.2.1 Global Power SiC Production Value by Type (2020-2025)
5.2.2 Global Power SiC Production Value by Type (2026-2031)
5.2.3 Global Power SiC Production Value Market Share by Type (2020-2031)
5.3 Global Power SiC Price by Type (2020-2031)
6 Segment by Application
6.1 Global Power SiC Production by Application (2020-2031)
6.1.1 Global Power SiC Production by Application (2020-2025)
6.1.2 Global Power SiC Production by Application (2026-2031)
6.1.3 Global Power SiC Production Market Share by Application (2020-2031)
6.2 Global Power SiC Production Value by Application (2020-2031)
6.2.1 Global Power SiC Production Value by Application (2020-2025)
6.2.2 Global Power SiC Production Value by Application (2026-2031)
6.2.3 Global Power SiC Production Value Market Share by Application (2020-2031)
6.3 Global Power SiC Price by Application (2020-2031)
7 Key Companies Profiled
7.1 STMicroelectronics
7.1.1 STMicroelectronics Power SiC Company Information
7.1.2 STMicroelectronics Power SiC Product Portfolio
7.1.3 STMicroelectronics Power SiC Production, Value, Price and Gross Margin (2020-2025)
7.1.4 STMicroelectronics Main Business and Markets Served
7.1.5 STMicroelectronics Recent Developments/Updates
7.2 Infineon
7.2.1 Infineon Power SiC Company Information
7.2.2 Infineon Power SiC Product Portfolio
7.2.3 Infineon Power SiC Production, Value, Price and Gross Margin (2020-2025)
7.2.4 Infineon Main Business and Markets Served
7.2.5 Infineon Recent Developments/Updates
7.3 Wolfspeed
7.3.1 Wolfspeed Power SiC Company Information
7.3.2 Wolfspeed Power SiC Product Portfolio
7.3.3 Wolfspeed Power SiC Production, Value, Price and Gross Margin (2020-2025)
7.3.4 Wolfspeed Main Business and Markets Served
7.3.5 Wolfspeed Recent Developments/Updates
7.4 Rohm
7.4.1 Rohm Power SiC Company Information
7.4.2 Rohm Power SiC Product Portfolio
7.4.3 Rohm Power SiC Production, Value, Price and Gross Margin (2020-2025)
7.4.4 Rohm Main Business and Markets Served
7.4.5 Rohm Recent Developments/Updates
7.5 onsemi
7.5.1 onsemi Power SiC Company Information
7.5.2 onsemi Power SiC Product Portfolio
7.5.3 onsemi Power SiC Production, Value, Price and Gross Margin (2020-2025)
7.5.4 onsemi Main Business and Markets Served
7.5.5 onsemi Recent Developments/Updates
7.6 BYD Semiconductor
7.6.1 BYD Semiconductor Power SiC Company Information
7.6.2 BYD Semiconductor Power SiC Product Portfolio
7.6.3 BYD Semiconductor Power SiC Production, Value, Price and Gross Margin (2020-2025)
7.6.4 BYD Semiconductor Main Business and Markets Served
7.6.5 BYD Semiconductor Recent Developments/Updates
7.7 Microchip (Microsemi)
7.7.1 Microchip (Microsemi) Power SiC Company Information
7.7.2 Microchip (Microsemi) Power SiC Product Portfolio
7.7.3 Microchip (Microsemi) Power SiC Production, Value, Price and Gross Margin (2020-2025)
7.7.4 Microchip (Microsemi) Main Business and Markets Served
7.7.5 Microchip (Microsemi) Recent Developments/Updates
7.8 Mitsubishi Electric (Vincotech)
7.8.1 Mitsubishi Electric (Vincotech) Power SiC Company Information
7.8.2 Mitsubishi Electric (Vincotech) Power SiC Product Portfolio
7.8.3 Mitsubishi Electric (Vincotech) Power SiC Production, Value, Price and Gross Margin (2020-2025)
7.8.4 Mitsubishi Electric (Vincotech) Main Business and Markets Served
7.8.5 Mitsubishi Electric (Vincotech) Recent Developments/Updates
7.9 Semikron Danfoss
7.9.1 Semikron Danfoss Power SiC Company Information
7.9.2 Semikron Danfoss Power SiC Product Portfolio
7.9.3 Semikron Danfoss Power SiC Production, Value, Price and Gross Margin (2020-2025)
7.9.4 Semikron Danfoss Main Business and Markets Served
7.9.5 Semikron Danfoss Recent Developments/Updates
7.10 Fuji Electric
7.10.1 Fuji Electric Power SiC Company Information
7.10.2 Fuji Electric Power SiC Product Portfolio
7.10.3 Fuji Electric Power SiC Production, Value, Price and Gross Margin (2020-2025)
7.10.4 Fuji Electric Main Business and Markets Served
7.10.5 Fuji Electric Recent Developments/Updates
7.11 Navitas (GeneSiC)
7.11.1 Navitas (GeneSiC) Power SiC Company Information
7.11.2 Navitas (GeneSiC) Power SiC Product Portfolio
7.11.3 Navitas (GeneSiC) Power SiC Production, Value, Price and Gross Margin (2020-2025)
7.11.4 Navitas (GeneSiC) Main Business and Markets Served
7.11.5 Navitas (GeneSiC) Recent Developments/Updates
7.12 Toshiba
7.12.1 Toshiba Power SiC Company Information
7.12.2 Toshiba Power SiC Product Portfolio
7.12.3 Toshiba Power SiC Production, Value, Price and Gross Margin (2020-2025)
7.12.4 Toshiba Main Business and Markets Served
7.12.5 Toshiba Recent Developments/Updates
7.13 Qorvo (UnitedSiC)
7.13.1 Qorvo (UnitedSiC) Power SiC Company Information
7.13.2 Qorvo (UnitedSiC) Power SiC Product Portfolio
7.13.3 Qorvo (UnitedSiC) Power SiC Production, Value, Price and Gross Margin (2020-2025)
7.13.4 Qorvo (UnitedSiC) Main Business and Markets Served
7.13.5 Qorvo (UnitedSiC) Recent Developments/Updates
7.14 San'an Optoelectronics
7.14.1 San'an Optoelectronics Power SiC Company Information
7.14.2 San'an Optoelectronics Power SiC Product Portfolio
7.14.3 San'an Optoelectronics Power SiC Production, Value, Price and Gross Margin (2020-2025)
7.14.4 San'an Optoelectronics Main Business and Markets Served
7.14.5 San'an Optoelectronics Recent Developments/Updates
7.15 Littelfuse (IXYS)
7.15.1 Littelfuse (IXYS) Power SiC Company Information
7.15.2 Littelfuse (IXYS) Power SiC Product Portfolio
7.15.3 Littelfuse (IXYS) Power SiC Production, Value, Price and Gross Margin (2020-2025)
7.15.4 Littelfuse (IXYS) Main Business and Markets Served
7.15.5 Littelfuse (IXYS) Recent Developments/Updates
7.16 CETC 55
7.16.1 CETC 55 Power SiC Company Information
7.16.2 CETC 55 Power SiC Product Portfolio
7.16.3 CETC 55 Power SiC Production, Value, Price and Gross Margin (2020-2025)
7.16.4 CETC 55 Main Business and Markets Served
7.16.5 CETC 55 Recent Developments/Updates
7.17 WeEn Semiconductors
7.17.1 WeEn Semiconductors Power SiC Company Information
7.17.2 WeEn Semiconductors Power SiC Product Portfolio
7.17.3 WeEn Semiconductors Power SiC Production, Value, Price and Gross Margin (2020-2025)
7.17.4 WeEn Semiconductors Main Business and Markets Served
7.17.5 WeEn Semiconductors Recent Developments/Updates
7.18 BASiC Semiconductor
7.18.1 BASiC Semiconductor Power SiC Company Information
7.18.2 BASiC Semiconductor Power SiC Product Portfolio
7.18.3 BASiC Semiconductor Power SiC Production, Value, Price and Gross Margin (2020-2025)
7.18.4 BASiC Semiconductor Main Business and Markets Served
7.18.5 BASiC Semiconductor Recent Developments/Updates
7.19 SemiQ
7.19.1 SemiQ Power SiC Company Information
7.19.2 SemiQ Power SiC Product Portfolio
7.19.3 SemiQ Power SiC Production, Value, Price and Gross Margin (2020-2025)
7.19.4 SemiQ Main Business and Markets Served
7.19.5 SemiQ Recent Developments/Updates
7.20 Diodes Incorporated
7.20.1 Diodes Incorporated Power SiC Company Information
7.20.2 Diodes Incorporated Power SiC Product Portfolio
7.20.3 Diodes Incorporated Power SiC Production, Value, Price and Gross Margin (2020-2025)
7.20.4 Diodes Incorporated Main Business and Markets Served
7.20.5 Diodes Incorporated Recent Developments/Updates
7.21 SanRex
7.21.1 SanRex Power SiC Company Information
7.21.2 SanRex Power SiC Product Portfolio
7.21.3 SanRex Power SiC Production, Value, Price and Gross Margin (2020-2025)
7.21.4 SanRex Main Business and Markets Served
7.21.5 SanRex Recent Developments/Updates
7.22 Alpha & Omega Semiconductor
7.22.1 Alpha & Omega Semiconductor Power SiC Company Information
7.22.2 Alpha & Omega Semiconductor Power SiC Product Portfolio
7.22.3 Alpha & Omega Semiconductor Power SiC Production, Value, Price and Gross Margin (2020-2025)
7.22.4 Alpha & Omega Semiconductor Main Business and Markets Served
7.22.5 Alpha & Omega Semiconductor Recent Developments/Updates
7.23 Bosch
7.23.1 Bosch Power SiC Company Information
7.23.2 Bosch Power SiC Product Portfolio
7.23.3 Bosch Power SiC Production, Value, Price and Gross Margin (2020-2025)
7.23.4 Bosch Main Business and Markets Served
7.23.5 Bosch Recent Developments/Updates
7.24 KEC Corporation
7.24.1 KEC Corporation Power SiC Company Information
7.24.2 KEC Corporation Power SiC Product Portfolio
7.24.3 KEC Corporation Power SiC Production, Value, Price and Gross Margin (2020-2025)
7.24.4 KEC Corporation Main Business and Markets Served
7.24.5 KEC Corporation Recent Developments/Updates
7.25 PANJIT Group
7.25.1 PANJIT Group Power SiC Company Information
7.25.2 PANJIT Group Power SiC Product Portfolio
7.25.3 PANJIT Group Power SiC Production, Value, Price and Gross Margin (2020-2025)
7.25.4 PANJIT Group Main Business and Markets Served
7.25.5 PANJIT Group Recent Developments/Updates
7.26 Nexperia
7.26.1 Nexperia Power SiC Company Information
7.26.2 Nexperia Power SiC Product Portfolio
7.26.3 Nexperia Power SiC Production, Value, Price and Gross Margin (2020-2025)
7.26.4 Nexperia Main Business and Markets Served
7.26.5 Nexperia Recent Developments/Updates
7.27 Vishay Intertechnology
7.27.1 Vishay Intertechnology Power SiC Company Information
7.27.2 Vishay Intertechnology Power SiC Product Portfolio
7.27.3 Vishay Intertechnology Power SiC Production, Value, Price and Gross Margin (2020-2025)
7.27.4 Vishay Intertechnology Main Business and Markets Served
7.27.5 Vishay Intertechnology Recent Developments/Updates
7.28 Zhuzhou CRRC Times Electric
7.28.1 Zhuzhou CRRC Times Electric Power SiC Company Information
7.28.2 Zhuzhou CRRC Times Electric Power SiC Product Portfolio
7.28.3 Zhuzhou CRRC Times Electric Power SiC Production, Value, Price and Gross Margin (2020-2025)
7.28.4 Zhuzhou CRRC Times Electric Main Business and Markets Served
7.28.5 Zhuzhou CRRC Times Electric Recent Developments/Updates
7.29 China Resources Microelectronics Limited
7.29.1 China Resources Microelectronics Limited Power SiC Company Information
7.29.2 China Resources Microelectronics Limited Power SiC Product Portfolio
7.29.3 China Resources Microelectronics Limited Power SiC Production, Value, Price and Gross Margin (2020-2025)
7.29.4 China Resources Microelectronics Limited Main Business and Markets Served
7.29.5 China Resources Microelectronics Limited Recent Developments/Updates
7.30 StarPower
7.30.1 StarPower Power SiC Company Information
7.30.2 StarPower Power SiC Product Portfolio
7.30.3 StarPower Power SiC Production, Value, Price and Gross Margin (2020-2025)
7.30.4 StarPower Main Business and Markets Served
7.30.5 StarPower Recent Developments/Updates
7.31 Yangzhou Yangjie Electronic Technology
7.31.1 Yangzhou Yangjie Electronic Technology Power SiC Company Information
7.31.2 Yangzhou Yangjie Electronic Technology Power SiC Product Portfolio
7.31.3 Yangzhou Yangjie Electronic Technology Power SiC Production, Value, Price and Gross Margin (2020-2025)
7.31.4 Yangzhou Yangjie Electronic Technology Main Business and Markets Served
7.31.5 Yangzhou Yangjie Electronic Technology Recent Developments/Updates
7.32 Guangdong AccoPower Semiconductor
7.32.1 Guangdong AccoPower Semiconductor Power SiC Company Information
7.32.2 Guangdong AccoPower Semiconductor Power SiC Product Portfolio
7.32.3 Guangdong AccoPower Semiconductor Power SiC Production, Value, Price and Gross Margin (2020-2025)
7.32.4 Guangdong AccoPower Semiconductor Main Business and Markets Served
7.32.5 Guangdong AccoPower Semiconductor Recent Developments/Updates
7.33 Changzhou Galaxy Century Microelectronics
7.33.1 Changzhou Galaxy Century Microelectronics Power SiC Company Information
7.33.2 Changzhou Galaxy Century Microelectronics Power SiC Product Portfolio
7.33.3 Changzhou Galaxy Century Microelectronics Power SiC Production, Value, Price and Gross Margin (2020-2025)
7.33.4 Changzhou Galaxy Century Microelectronics Main Business and Markets Served
7.33.5 Changzhou Galaxy Century Microelectronics Recent Developments/Updates
7.34 Hangzhou Silan Microelectronics
7.34.1 Hangzhou Silan Microelectronics Power SiC Company Information
7.34.2 Hangzhou Silan Microelectronics Power SiC Product Portfolio
7.34.3 Hangzhou Silan Microelectronics Power SiC Production, Value, Price and Gross Margin (2020-2025)
7.34.4 Hangzhou Silan Microelectronics Main Business and Markets Served
7.34.5 Hangzhou Silan Microelectronics Recent Developments/Updates
7.35 Cissoid
7.35.1 Cissoid Power SiC Company Information
7.35.2 Cissoid Power SiC Product Portfolio
7.35.3 Cissoid Power SiC Production, Value, Price and Gross Margin (2020-2025)
7.35.4 Cissoid Main Business and Markets Served
7.35.5 Cissoid Recent Developments/Updates
7.36 SK powertech
7.36.1 SK powertech Power SiC Company Information
7.36.2 SK powertech Power SiC Product Portfolio
7.36.3 SK powertech Power SiC Production, Value, Price and Gross Margin (2020-2025)
7.36.4 SK powertech Main Business and Markets Served
7.36.5 SK powertech Recent Developments/Updates
7.37 InventChip Technology
7.37.1 InventChip Technology Power SiC Company Information
7.37.2 InventChip Technology Power SiC Product Portfolio
7.37.3 InventChip Technology Power SiC Production, Value, Price and Gross Margin (2020-2025)
7.37.4 InventChip Technology Main Business and Markets Served
7.37.5 InventChip Technology Recent Developments/Updates
7.38 Hebei Sinopack Electronic Technology
7.38.1 Hebei Sinopack Electronic Technology Power SiC Company Information
7.38.2 Hebei Sinopack Electronic Technology Power SiC Product Portfolio
7.38.3 Hebei Sinopack Electronic Technology Power SiC Production, Value, Price and Gross Margin (2020-2025)
7.38.4 Hebei Sinopack Electronic Technology Main Business and Markets Served
7.38.5 Hebei Sinopack Electronic Technology Recent Developments/Updates
7.39 Oriental Semiconductor
7.39.1 Oriental Semiconductor Power SiC Company Information
7.39.2 Oriental Semiconductor Power SiC Product Portfolio
7.39.3 Oriental Semiconductor Power SiC Production, Value, Price and Gross Margin (2020-2025)
7.39.4 Oriental Semiconductor Main Business and Markets Served
7.39.5 Oriental Semiconductor Recent Developments/Updates
7.40 Jilin Sino-Microelectronics
7.40.1 Jilin Sino-Microelectronics Power SiC Company Information
7.40.2 Jilin Sino-Microelectronics Power SiC Product Portfolio
7.40.3 Jilin Sino-Microelectronics Power SiC Production, Value, Price and Gross Margin (2020-2025)
7.40.4 Jilin Sino-Microelectronics Main Business and Markets Served
7.40.5 Jilin Sino-Microelectronics Recent Developments/Updates
8 Industry Chain and Sales Channels Analysis
8.1 Power SiC Industry Chain Analysis
8.2 Power SiC Raw Material Supply Analysis
8.2.1 Key Raw Materials
8.2.2 Raw Materials Key Suppliers
8.3 Power SiC Production Mode & Process Analysis
8.4 Power SiC Sales and Marketing
8.4.1 Power SiC Sales Channels
8.4.2 Power SiC Distributors
8.5 Power SiC Customer Analysis
9 Power SiC Market Dynamics
9.1 Power SiC Industry Trends
9.2 Power SiC Market Drivers
9.3 Power SiC Market Challenges
9.4 Power SiC Market Restraints
10 Research Findings and Conclusion
11 Methodology and Data Source
11.1 Methodology/Research Approach
11.1.1 Research Programs/Design
11.1.2 Market Size Estimation
11.1.3 Market Breakdown and Data Triangulation
11.2 Data Source
11.2.1 Secondary Sources
11.2.2 Primary Sources
11.3 Author List
11.4 Disclaimer
List of Tables
 Table 1. Global Power SiC Market Value by Type, (US$ Million) & (2024 VS 2031)
 Table 2. Global Power SiC Market Value by Application, (US$ Million) & (2024 VS 2031)
 Table 3. Global Power SiC Production Capacity (K Units) by Manufacturers in 2024
 Table 4. Global Power SiC Production by Manufacturers (2020-2025) & (K Units)
 Table 5. Global Power SiC Production Market Share by Manufacturers (2020-2025)
 Table 6. Global Power SiC Production Value by Manufacturers (2020-2025) & (US$ Million)
 Table 7. Global Power SiC Production Value Share by Manufacturers (2020-2025)
 Table 8. Global Key Players of Power SiC, Industry Ranking, 2023 VS 2024
 Table 9. Company Type (Tier 1, Tier 2, and Tier 3) & (based on the Production Value in Power SiC as of 2024)
 Table 10. Global Market Power SiC Average Price by Manufacturers (US$/Unit) & (2020-2025)
 Table 11. Global Key Manufacturers of Power SiC, Manufacturing Base Distribution and Headquarters
 Table 12. Global Key Manufacturers of Power SiC, Product Offered and Application
 Table 13. Global Key Manufacturers of Power SiC, Date of Enter into This Industry
 Table 14. Global Power SiC Manufacturers Market Concentration Ratio (CR5 and HHI)
 Table 15. Mergers & Acquisitions, Expansion Plans
 Table 16. Global Power SiC Production Value by Region: 2020 VS 2024 VS 2031 (US$ Million)
 Table 17. Global Power SiC Production Value (US$ Million) by Region (2020-2025)
 Table 18. Global Power SiC Production Value Market Share by Region (2020-2025)
 Table 19. Global Power SiC Production Value (US$ Million) Forecast by Region (2026-2031)
 Table 20. Global Power SiC Production Value Market Share Forecast by Region (2026-2031)
 Table 21. Global Power SiC Production Comparison by Region: 2020 VS 2024 VS 2031 (K Units)
 Table 22. Global Power SiC Production (K Units) by Region (2020-2025)
 Table 23. Global Power SiC Production Market Share by Region (2020-2025)
 Table 24. Global Power SiC Production (K Units) Forecast by Region (2026-2031)
 Table 25. Global Power SiC Production Market Share Forecast by Region (2026-2031)
 Table 26. Global Power SiC Market Average Price (US$/Unit) by Region (2020-2025)
 Table 27. Global Power SiC Market Average Price (US$/Unit) by Region (2026-2031)
 Table 28. Global Power SiC Consumption Growth Rate by Region: 2020 VS 2024 VS 2031 (K Units)
 Table 29. Global Power SiC Consumption by Region (2020-2025) & (K Units)
 Table 30. Global Power SiC Consumption Market Share by Region (2020-2025)
 Table 31. Global Power SiC Forecasted Consumption by Region (2026-2031) & (K Units)
 Table 32. Global Power SiC Forecasted Consumption Market Share by Region (2026-2031)
 Table 33. North America Power SiC Consumption Growth Rate by Country: 2020 VS 2024 VS 2031 (K Units)
 Table 34. North America Power SiC Consumption by Country (2020-2025) & (K Units)
 Table 35. North America Power SiC Consumption by Country (2026-2031) & (K Units)
 Table 36. Europe Power SiC Consumption Growth Rate by Country: 2020 VS 2024 VS 2031 (K Units)
 Table 37. Europe Power SiC Consumption by Country (2020-2025) & (K Units)
 Table 38. Europe Power SiC Consumption by Country (2026-2031) & (K Units)
 Table 39. Asia Pacific Power SiC Consumption Growth Rate by Region: 2020 VS 2024 VS 2031 (K Units)
 Table 40. Asia Pacific Power SiC Consumption by Region (2020-2025) & (K Units)
 Table 41. Asia Pacific Power SiC Consumption by Region (2026-2031) & (K Units)
 Table 42. Latin America, Middle East & Africa Power SiC Consumption Growth Rate by Country: 2020 VS 2024 VS 2031 (K Units)
 Table 43. Latin America, Middle East & Africa Power SiC Consumption by Country (2020-2025) & (K Units)
 Table 44. Latin America, Middle East & Africa Power SiC Consumption by Country (2026-2031) & (K Units)
 Table 45. Global Power SiC Production (K Units) by Type (2020-2025)
 Table 46. Global Power SiC Production (K Units) by Type (2026-2031)
 Table 47. Global Power SiC Production Market Share by Type (2020-2025)
 Table 48. Global Power SiC Production Market Share by Type (2026-2031)
 Table 49. Global Power SiC Production Value (US$ Million) by Type (2020-2025)
 Table 50. Global Power SiC Production Value (US$ Million) by Type (2026-2031)
 Table 51. Global Power SiC Production Value Market Share by Type (2020-2025)
 Table 52. Global Power SiC Production Value Market Share by Type (2026-2031)
 Table 53. Global Power SiC Price (US$/Unit) by Type (2020-2025)
 Table 54. Global Power SiC Price (US$/Unit) by Type (2026-2031)
 Table 55. Global Power SiC Production (K Units) by Application (2020-2025)
 Table 56. Global Power SiC Production (K Units) by Application (2026-2031)
 Table 57. Global Power SiC Production Market Share by Application (2020-2025)
 Table 58. Global Power SiC Production Market Share by Application (2026-2031)
 Table 59. Global Power SiC Production Value (US$ Million) by Application (2020-2025)
 Table 60. Global Power SiC Production Value (US$ Million) by Application (2026-2031)
 Table 61. Global Power SiC Production Value Market Share by Application (2020-2025)
 Table 62. Global Power SiC Production Value Market Share by Application (2026-2031)
 Table 63. Global Power SiC Price (US$/Unit) by Application (2020-2025)
 Table 64. Global Power SiC Price (US$/Unit) by Application (2026-2031)
 Table 65. STMicroelectronics Power SiC Company Information
 Table 66. STMicroelectronics Power SiC Specification and Application
 Table 67. STMicroelectronics Power SiC Production (K Units), Value (US$ Million), Price (US$/Unit) and Gross Margin (2020-2025)
 Table 68. STMicroelectronics Main Business and Markets Served
 Table 69. STMicroelectronics Recent Developments/Updates
 Table 70. Infineon Power SiC Company Information
 Table 71. Infineon Power SiC Specification and Application
 Table 72. Infineon Power SiC Production (K Units), Value (US$ Million), Price (US$/Unit) and Gross Margin (2020-2025)
 Table 73. Infineon Main Business and Markets Served
 Table 74. Infineon Recent Developments/Updates
 Table 75. Wolfspeed Power SiC Company Information
 Table 76. Wolfspeed Power SiC Specification and Application
 Table 77. Wolfspeed Power SiC Production (K Units), Value (US$ Million), Price (US$/Unit) and Gross Margin (2020-2025)
 Table 78. Wolfspeed Main Business and Markets Served
 Table 79. Wolfspeed Recent Developments/Updates
 Table 80. Rohm Power SiC Company Information
 Table 81. Rohm Power SiC Specification and Application
 Table 82. Rohm Power SiC Production (K Units), Value (US$ Million), Price (US$/Unit) and Gross Margin (2020-2025)
 Table 83. Rohm Main Business and Markets Served
 Table 84. Rohm Recent Developments/Updates
 Table 85. onsemi Power SiC Company Information
 Table 86. onsemi Power SiC Specification and Application
 Table 87. onsemi Power SiC Production (K Units), Value (US$ Million), Price (US$/Unit) and Gross Margin (2020-2025)
 Table 88. onsemi Main Business and Markets Served
 Table 89. onsemi Recent Developments/Updates
 Table 90. BYD Semiconductor Power SiC Company Information
 Table 91. BYD Semiconductor Power SiC Specification and Application
 Table 92. BYD Semiconductor Power SiC Production (K Units), Value (US$ Million), Price (US$/Unit) and Gross Margin (2020-2025)
 Table 93. BYD Semiconductor Main Business and Markets Served
 Table 94. BYD Semiconductor Recent Developments/Updates
 Table 95. Microchip (Microsemi) Power SiC Company Information
 Table 96. Microchip (Microsemi) Power SiC Specification and Application
 Table 97. Microchip (Microsemi) Power SiC Production (K Units), Value (US$ Million), Price (US$/Unit) and Gross Margin (2020-2025)
 Table 98. Microchip (Microsemi) Main Business and Markets Served
 Table 99. Microchip (Microsemi) Recent Developments/Updates
 Table 100. Mitsubishi Electric (Vincotech) Power SiC Company Information
 Table 101. Mitsubishi Electric (Vincotech) Power SiC Specification and Application
 Table 102. Mitsubishi Electric (Vincotech) Power SiC Production (K Units), Value (US$ Million), Price (US$/Unit) and Gross Margin (2020-2025)
 Table 103. Mitsubishi Electric (Vincotech) Main Business and Markets Served
 Table 104. Mitsubishi Electric (Vincotech) Recent Developments/Updates
 Table 105. Semikron Danfoss Power SiC Company Information
 Table 106. Semikron Danfoss Power SiC Specification and Application
 Table 107. Semikron Danfoss Power SiC Production (K Units), Value (US$ Million), Price (US$/Unit) and Gross Margin (2020-2025)
 Table 108. Semikron Danfoss Main Business and Markets Served
 Table 109. Semikron Danfoss Recent Developments/Updates
 Table 110. Fuji Electric Power SiC Company Information
 Table 111. Fuji Electric Power SiC Specification and Application
 Table 112. Fuji Electric Power SiC Production (K Units), Value (US$ Million), Price (US$/Unit) and Gross Margin (2020-2025)
 Table 113. Fuji Electric Main Business and Markets Served
 Table 114. Fuji Electric Recent Developments/Updates
 Table 115. Navitas (GeneSiC) Power SiC Company Information
 Table 116. Navitas (GeneSiC) Power SiC Specification and Application
 Table 117. Navitas (GeneSiC) Power SiC Production (K Units), Value (US$ Million), Price (US$/Unit) and Gross Margin (2020-2025)
 Table 118. Navitas (GeneSiC) Main Business and Markets Served
 Table 119. Navitas (GeneSiC) Recent Developments/Updates
 Table 120. Toshiba Power SiC Company Information
 Table 121. Toshiba Power SiC Specification and Application
 Table 122. Toshiba Power SiC Production (K Units), Value (US$ Million), Price (US$/Unit) and Gross Margin (2020-2025)
 Table 123. Toshiba Main Business and Markets Served
 Table 124. Toshiba Recent Developments/Updates
 Table 125. Qorvo (UnitedSiC) Power SiC Company Information
 Table 126. Qorvo (UnitedSiC) Power SiC Specification and Application
 Table 127. Qorvo (UnitedSiC) Power SiC Production (K Units), Value (US$ Million), Price (US$/Unit) and Gross Margin (2020-2025)
 Table 128. Qorvo (UnitedSiC) Main Business and Markets Served
 Table 129. Qorvo (UnitedSiC) Recent Developments/Updates
 Table 130. San'an Optoelectronics Power SiC Company Information
 Table 131. San'an Optoelectronics Power SiC Specification and Application
 Table 132. San'an Optoelectronics Power SiC Production (K Units), Value (US$ Million), Price (US$/Unit) and Gross Margin (2020-2025)
 Table 133. San'an Optoelectronics Main Business and Markets Served
 Table 134. San'an Optoelectronics Recent Developments/Updates
 Table 135. Littelfuse (IXYS) Power SiC Company Information
 Table 136. Littelfuse (IXYS) Power SiC Specification and Application
 Table 137. Littelfuse (IXYS) Power SiC Production (K Units), Value (US$ Million), Price (US$/Unit) and Gross Margin (2020-2025)
 Table 138. Littelfuse (IXYS) Main Business and Markets Served
 Table 139. Littelfuse (IXYS) Recent Developments/Updates
 Table 140. CETC 55 Power SiC Company Information
 Table 141. CETC 55 Power SiC Specification and Application
 Table 142. CETC 55 Power SiC Production (K Units), Value (US$ Million), Price (US$/Unit) and Gross Margin (2020-2025)
 Table 143. CETC 55 Main Business and Markets Served
 Table 144. CETC 55 Recent Developments/Updates
 Table 145. WeEn Semiconductors Power SiC Company Information
 Table 146. WeEn Semiconductors Power SiC Specification and Application
 Table 147. WeEn Semiconductors Power SiC Production (K Units), Value (US$ Million), Price (US$/Unit) and Gross Margin (2020-2025)
 Table 148. WeEn Semiconductors Main Business and Markets Served
 Table 149. WeEn Semiconductors Recent Developments/Updates
 Table 150. BASiC Semiconductor Power SiC Company Information
 Table 151. BASiC Semiconductor Power SiC Specification and Application
 Table 152. BASiC Semiconductor Power SiC Production (K Units), Value (US$ Million), Price (US$/Unit) and Gross Margin (2020-2025)
 Table 153. BASiC Semiconductor Main Business and Markets Served
 Table 154. BASiC Semiconductor Recent Developments/Updates
 Table 155. SemiQ Power SiC Company Information
 Table 156. SemiQ Power SiC Specification and Application
 Table 157. SemiQ Power SiC Production (K Units), Value (US$ Million), Price (US$/Unit) and Gross Margin (2020-2025)
 Table 158. SemiQ Main Business and Markets Served
 Table 159. SemiQ Recent Developments/Updates
 Table 160. Diodes Incorporated Power SiC Company Information
 Table 161. Diodes Incorporated Power SiC Specification and Application
 Table 162. Diodes Incorporated Power SiC Production (K Units), Value (US$ Million), Price (US$/Unit) and Gross Margin (2020-2025)
 Table 163. Diodes Incorporated Main Business and Markets Served
 Table 164. Diodes Incorporated Recent Developments/Updates
 Table 165. SanRex Power SiC Company Information
 Table 166. SanRex Power SiC Specification and Application
 Table 167. SanRex Power SiC Production (K Units), Value (US$ Million), Price (US$/Unit) and Gross Margin (2020-2025)
 Table 168. SanRex Main Business and Markets Served
 Table 169. SanRex Recent Developments/Updates
 Table 170. Alpha & Omega Semiconductor Power SiC Company Information
 Table 171. Alpha & Omega Semiconductor Power SiC Specification and Application
 Table 172. Alpha & Omega Semiconductor Power SiC Production (K Units), Value (US$ Million), Price (US$/Unit) and Gross Margin (2020-2025)
 Table 173. Alpha & Omega Semiconductor Main Business and Markets Served
 Table 174. Alpha & Omega Semiconductor Recent Developments/Updates
 Table 175. Bosch Power SiC Company Information
 Table 176. Bosch Power SiC Specification and Application
 Table 177. Bosch Power SiC Production (K Units), Value (US$ Million), Price (US$/Unit) and Gross Margin (2020-2025)
 Table 178. Bosch Main Business and Markets Served
 Table 179. Bosch Recent Developments/Updates
 Table 180. KEC Corporation Power SiC Company Information
 Table 181. KEC Corporation Power SiC Specification and Application
 Table 182. KEC Corporation Power SiC Production (K Units), Value (US$ Million), Price (US$/Unit) and Gross Margin (2020-2025)
 Table 183. KEC Corporation Main Business and Markets Served
 Table 184. KEC Corporation Recent Developments/Updates
 Table 185. PANJIT Group Power SiC Company Information
 Table 186. PANJIT Group Power SiC Specification and Application
 Table 187. PANJIT Group Power SiC Production (K Units), Value (US$ Million), Price (US$/Unit) and Gross Margin (2020-2025)
 Table 188. PANJIT Group Main Business and Markets Served
 Table 189. PANJIT Group Recent Developments/Updates
 Table 190. Nexperia Power SiC Company Information
 Table 191. Nexperia Power SiC Specification and Application
 Table 192. Nexperia Power SiC Production (K Units), Value (US$ Million), Price (US$/Unit) and Gross Margin (2020-2025)
 Table 193. Nexperia Main Business and Markets Served
 Table 194. Nexperia Recent Developments/Updates
 Table 195. Vishay Intertechnology Power SiC Company Information
 Table 196. Vishay Intertechnology Power SiC Specification and Application
 Table 197. Vishay Intertechnology Power SiC Production (K Units), Value (US$ Million), Price (US$/Unit) and Gross Margin (2020-2025)
 Table 198. Vishay Intertechnology Main Business and Markets Served
 Table 199. Vishay Intertechnology Recent Developments/Updates
 Table 200. Zhuzhou CRRC Times Electric Power SiC Company Information
 Table 201. Zhuzhou CRRC Times Electric Power SiC Specification and Application
 Table 202. Zhuzhou CRRC Times Electric Power SiC Production (K Units), Value (US$ Million), Price (US$/Unit) and Gross Margin (2020-2025)
 Table 203. Zhuzhou CRRC Times Electric Main Business and Markets Served
 Table 204. Zhuzhou CRRC Times Electric Recent Developments/Updates
 Table 205. China Resources Microelectronics Limited Power SiC Company Information
 Table 206. China Resources Microelectronics Limited Power SiC Specification and Application
 Table 207. China Resources Microelectronics Limited Power SiC Production (K Units), Value (US$ Million), Price (US$/Unit) and Gross Margin (2020-2025)
 Table 208. China Resources Microelectronics Limited Main Business and Markets Served
 Table 209. China Resources Microelectronics Limited Recent Developments/Updates
 Table 210. StarPower Power SiC Company Information
 Table 211. StarPower Power SiC Specification and Application
 Table 212. StarPower Power SiC Production (K Units), Value (US$ Million), Price (US$/Unit) and Gross Margin (2020-2025)
 Table 213. StarPower Main Business and Markets Served
 Table 214. StarPower Recent Developments/Updates
 Table 215. Yangzhou Yangjie Electronic Technology Power SiC Company Information
 Table 216. Yangzhou Yangjie Electronic Technology Power SiC Specification and Application
 Table 217. Yangzhou Yangjie Electronic Technology Power SiC Production (K Units), Value (US$ Million), Price (US$/Unit) and Gross Margin (2020-2025)
 Table 218. Yangzhou Yangjie Electronic Technology Main Business and Markets Served
 Table 219. Yangzhou Yangjie Electronic Technology Recent Developments/Updates
 Table 220. Guangdong AccoPower Semiconductor Power SiC Company Information
 Table 221. Guangdong AccoPower Semiconductor Power SiC Specification and Application
 Table 222. Guangdong AccoPower Semiconductor Power SiC Production (K Units), Value (US$ Million), Price (US$/Unit) and Gross Margin (2020-2025)
 Table 223. Guangdong AccoPower Semiconductor Main Business and Markets Served
 Table 224. Guangdong AccoPower Semiconductor Recent Developments/Updates
 Table 225. Changzhou Galaxy Century Microelectronics Power SiC Company Information
 Table 226. Changzhou Galaxy Century Microelectronics Power SiC Specification and Application
 Table 227. Changzhou Galaxy Century Microelectronics Power SiC Production (K Units), Value (US$ Million), Price (US$/Unit) and Gross Margin (2020-2025)
 Table 228. Changzhou Galaxy Century Microelectronics Main Business and Markets Served
 Table 229. Changzhou Galaxy Century Microelectronics Recent Developments/Updates
 Table 230. Hangzhou Silan Microelectronics Power SiC Company Information
 Table 231. Hangzhou Silan Microelectronics Power SiC Specification and Application
 Table 232. Hangzhou Silan Microelectronics Power SiC Production (K Units), Value (US$ Million), Price (US$/Unit) and Gross Margin (2020-2025)
 Table 233. Hangzhou Silan Microelectronics Main Business and Markets Served
 Table 234. Hangzhou Silan Microelectronics Recent Developments/Updates
 Table 235. Cissoid Power SiC Company Information
 Table 236. Cissoid Power SiC Specification and Application
 Table 237. Cissoid Power SiC Production (K Units), Value (US$ Million), Price (US$/Unit) and Gross Margin (2020-2025)
 Table 238. Cissoid Main Business and Markets Served
 Table 239. Cissoid Recent Developments/Updates
 Table 240. SK powertech Power SiC Company Information
 Table 241. SK powertech Power SiC Specification and Application
 Table 242. SK powertech Power SiC Production (K Units), Value (US$ Million), Price (US$/Unit) and Gross Margin (2020-2025)
 Table 243. SK powertech Main Business and Markets Served
 Table 244. SK powertech Recent Developments/Updates
 Table 245. InventChip Technology Power SiC Company Information
 Table 246. InventChip Technology Power SiC Specification and Application
 Table 247. InventChip Technology Power SiC Production (K Units), Value (US$ Million), Price (US$/Unit) and Gross Margin (2020-2025)
 Table 248. InventChip Technology Main Business and Markets Served
 Table 249. InventChip Technology Recent Developments/Updates
 Table 250. Hebei Sinopack Electronic Technology Power SiC Company Information
 Table 251. Hebei Sinopack Electronic Technology Power SiC Specification and Application
 Table 252. Hebei Sinopack Electronic Technology Power SiC Production (K Units), Value (US$ Million), Price (US$/Unit) and Gross Margin (2020-2025)
 Table 253. Hebei Sinopack Electronic Technology Main Business and Markets Served
 Table 254. Hebei Sinopack Electronic Technology Recent Developments/Updates
 Table 255. Oriental Semiconductor Power SiC Company Information
 Table 256. Oriental Semiconductor Power SiC Specification and Application
 Table 257. Oriental Semiconductor Power SiC Production (K Units), Value (US$ Million), Price (US$/Unit) and Gross Margin (2020-2025)
 Table 258. Oriental Semiconductor Main Business and Markets Served
 Table 259. Oriental Semiconductor Recent Developments/Updates
 Table 260. Jilin Sino-Microelectronics Power SiC Company Information
 Table 261. Jilin Sino-Microelectronics Power SiC Specification and Application
 Table 262. Jilin Sino-Microelectronics Power SiC Production (K Units), Value (US$ Million), Price (US$/Unit) and Gross Margin (2020-2025)
 Table 263. Jilin Sino-Microelectronics Main Business and Markets Served
 Table 264. Jilin Sino-Microelectronics Recent Developments/Updates
 Table 265. Key Raw Materials Lists
 Table 266. Raw Materials Key Suppliers Lists
 Table 267. Power SiC Distributors List
 Table 268. Power SiC Customers List
 Table 269. Power SiC Market Trends
 Table 270. Power SiC Market Drivers
 Table 271. Power SiC Market Challenges
 Table 272. Power SiC Market Restraints
 Table 273. Research Programs/Design for This Report
 Table 274. Key Data Information from Secondary Sources
 Table 275. Key Data Information from Primary Sources
 Table 276. Authors List of This Report


List of Figures
 Figure 1. Product Picture of Power SiC
 Figure 2. Global Power SiC Market Value by Type, (US$ Million) & (2020-2031)
 Figure 3. Global Power SiC Market Share by Type: 2024 VS 2031
 Figure 4. SiC MOSFET Module Product Picture
 Figure 5. SiC MOSFET Discrete Product Picture
 Figure 6. SiC Diode (SiC SBD) Product Picture
 Figure 7. Others (SiC JFETs & FETs) Product Picture
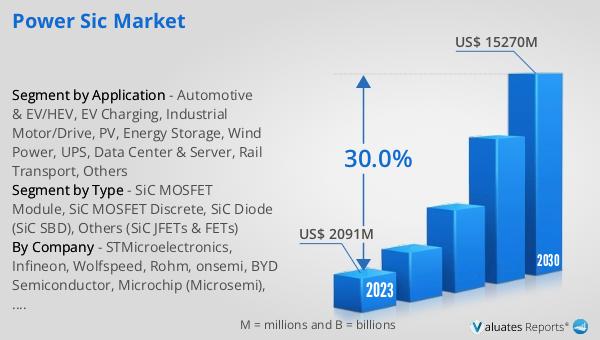
 Figure 8. Global Power SiC Market Value by Application, (US$ Million) & (2020-2031)
 Figure 9. Global Power SiC Market Share by Application: 2024 VS 2031
 Figure 10. Automotive & EV/HEV
 Figure 11. EV Charging
 Figure 12. Industrial Motor/Drive
 Figure 13. PV, Energy Storage, Wind Power
 Figure 14. UPS, Data Center & Server
 Figure 15. Rail Transport
 Figure 16. Others
 Figure 17. Global Power SiC Production Value (US$ Million), 2020 VS 2024 VS 2031
 Figure 18. Global Power SiC Production Value (US$ Million) & (2020-2031)
 Figure 19. Global Power SiC Production Capacity (K Units) & (2020-2031)
 Figure 20. Global Power SiC Production (K Units) & (2020-2031)
 Figure 21. Global Power SiC Average Price (US$/Unit) & (2020-2031)
 Figure 22. Power SiC Report Years Considered
 Figure 23. Power SiC Production Share by Manufacturers in 2024
 Figure 24. Global Power SiC Production Value Share by Manufacturers (2024)
 Figure 25. Power SiC Market Share by Company Type (Tier 1, Tier 2, and Tier 3): 2020 VS 2024
 Figure 26. The Global 5 and 10 Largest Players: Market Share by Power SiC Revenue in 2024
 Figure 27. Global Power SiC Production Value by Region: 2020 VS 2024 VS 2031 (US$ Million)
 Figure 28. Global Power SiC Production Value Market Share by Region: 2020 VS 2024 VS 2031
 Figure 29. Global Power SiC Production Comparison by Region: 2020 VS 2024 VS 2031 (K Units)
 Figure 30. Global Power SiC Production Market Share by Region: 2020 VS 2024 VS 2031
 Figure 31. North America Power SiC Production Value (US$ Million) Growth Rate (2020-2031)
 Figure 32. Europe Power SiC Production Value (US$ Million) Growth Rate (2020-2031)
 Figure 33. China Power SiC Production Value (US$ Million) Growth Rate (2020-2031)
 Figure 34. Japan Power SiC Production Value (US$ Million) Growth Rate (2020-2031)
 Figure 35. Global Power SiC Consumption by Region: 2020 VS 2024 VS 2031 (K Units)
 Figure 36. Global Power SiC Consumption Market Share by Region: 2020 VS 2024 VS 2031
 Figure 37. North America Power SiC Consumption and Growth Rate (2020-2031) & (K Units)
 Figure 38. North America Power SiC Consumption Market Share by Country (2020-2031)
 Figure 39. U.S. Power SiC Consumption and Growth Rate (2020-2031) & (K Units)
 Figure 40. Canada Power SiC Consumption and Growth Rate (2020-2031) & (K Units)
 Figure 41. Europe Power SiC Consumption and Growth Rate (2020-2031) & (K Units)
 Figure 42. Europe Power SiC Consumption Market Share by Country (2020-2031)
 Figure 43. Germany Power SiC Consumption and Growth Rate (2020-2031) & (K Units)
 Figure 44. France Power SiC Consumption and Growth Rate (2020-2031) & (K Units)
 Figure 45. U.K. Power SiC Consumption and Growth Rate (2020-2031) & (K Units)
 Figure 46. Italy Power SiC Consumption and Growth Rate (2020-2031) & (K Units)
 Figure 47. Netherlands Power SiC Consumption and Growth Rate (2020-2031) & (K Units)
 Figure 48. Asia Pacific Power SiC Consumption and Growth Rate (2020-2031) & (K Units)
 Figure 49. Asia Pacific Power SiC Consumption Market Share by Region (2020-2031)
 Figure 50. China Power SiC Consumption and Growth Rate (2020-2031) & (K Units)
 Figure 51. Japan Power SiC Consumption and Growth Rate (2020-2031) & (K Units)
 Figure 52. South Korea Power SiC Consumption and Growth Rate (2020-2031) & (K Units)
 Figure 53. China Taiwan Power SiC Consumption and Growth Rate (2020-2031) & (K Units)
 Figure 54. Southeast Asia Power SiC Consumption and Growth Rate (2020-2031) & (K Units)
 Figure 55. India Power SiC Consumption and Growth Rate (2020-2031) & (K Units)
 Figure 56. Latin America, Middle East & Africa Power SiC Consumption and Growth Rate (2020-2031) & (K Units)
 Figure 57. Latin America, Middle East & Africa Power SiC Consumption Market Share by Country (2020-2031)
 Figure 58. Mexico Power SiC Consumption and Growth Rate (2020-2031) & (K Units)
 Figure 59. Brazil Power SiC Consumption and Growth Rate (2020-2031) & (K Units)
 Figure 60. Israel Power SiC Consumption and Growth Rate (2020-2031) & (K Units)
 Figure 61. Global Production Market Share of Power SiC by Type (2020-2031)
 Figure 62. Global Production Value Market Share of Power SiC by Type (2020-2031)
 Figure 63. Global Power SiC Price (US$/Unit) by Type (2020-2031)
 Figure 64. Global Production Market Share of Power SiC by Application (2020-2031)
 Figure 65. Global Production Value Market Share of Power SiC by Application (2020-2031)
 Figure 66. Global Power SiC Price (US$/Unit) by Application (2020-2031)
 Figure 67. Power SiC Value Chain
 Figure 68. Channels of Distribution (Direct Vs Distribution)
 Figure 69. Bottom-up and Top-down Approaches for This Report
 Figure 70. Data Triangulation
SELECT A FORMAT
Added to Cart
Electronic (PDF)

$2900

This license allows only one user to access the PDF.
Electronic (PDF)

$4350

This license allows 1 - 5 user to access the PDF, license is suitable for small groups of 5 users working together
Electronic (PDF)

$5800

This license allows users/teams in a same Enterprise to use this report, various departments within an enterpise can use this report
Add to Cart
Buy Now (15% Discount)

OUR CUSTOMER

Leap India

RELATED REPORTS

Global PC-Based Motion Controller for Semiconductor Market Research Report 2025

120 Pages
Type: Report
Code: QYRE-Auto-22K17724
Fri Sep 12 00:00:00 UTC 2025

Add to Cart

Global Printed Circuit Borard (PCB) Design Software Market Research Report 2025

120 Pages
Type: Report
Code: QYRE-Auto-2Z2096
Fri Sep 12 00:00:00 UTC 2025

Add to Cart

Global Semiconductor Spintronics Market Research Report 2025

120 Pages
Type: Report
Code: QYRE-Auto-17L3332
Thu Sep 11 00:00:00 UTC 2025

Add to Cart

Global Spintronics Market Research Report 2025

120 Pages
Type: Report
Code: QYRE-Auto-4I2028
Thu Sep 11 00:00:00 UTC 2025

Add to Cart