List of Tables
Table 1. Rapid Injection Molding Market Trends
Table 2. Rapid Injection Molding Market Drivers & Opportunities
Table 3. Rapid Injection Molding Market Challenges
Table 4. Rapid Injection Molding Market Restraints
Table 5. Global Rapid Injection Molding Revenue by Company (US$ Million), 2021–2026
Table 6. Global Rapid Injection Molding Revenue Market Share by Company (2021–2026)
Table 7. Key Companies’ R&D and Operations Footprint and Headquarters
Table 8. Key Companies Rapid Injection Molding Product Type
Table 9. Key Companies General Availability (GA) Timeline for Rapid Injection Molding
Table 10. Global Rapid Injection Molding Companies Market Concentration Ratio (CR5 and HHI)
Table 11. Global Companies by Tier (Tier 1, Tier 2, Tier 3), based on Rapid Injection Molding revenue, 2025
Table 12. Mergers & Acquisitions and Expansion Plans
Table 13. Global Rapid Injection Molding Sales Value by Type: 2021 vs 2025 vs 2032 (US$ Million)
Table 14. Global Rapid Injection Molding Sales Value by Type (US$ Million), 2021–2026
Table 15. Global Rapid Injection Molding Sales Value by Type (US$ Million), 2027–2032
Table 16. Global Rapid Injection Molding Sales Market Share in Value by Type (2021–2026)
Table 17. Global Rapid Injection Molding Sales Market Share in Value by Type (2027–2032)
Table 18. Global Rapid Injection Molding Sales Value by Tooling Material: 2021 vs 2025 vs 2032 (US$ Million)
Table 19. Global Rapid Injection Molding Sales Value by Tooling Material (US$ Million), 2021–2026
Table 20. Global Rapid Injection Molding Sales Value by Tooling Material (US$ Million), 2027–2032
Table 21. Global Rapid Injection Molding Sales Market Share in Value by Tooling Material (2021–2026)
Table 22. Global Rapid Injection Molding Sales Market Share in Value by Tooling Material (2027–2032)
Table 23. Global Rapid Injection Molding Sales Value by Production Batch and Purpose: 2021 vs 2025 vs 2032 (US$ Million)
Table 24. Global Rapid Injection Molding Sales Value by Production Batch and Purpose (US$ Million), 2021–2026
Table 25. Global Rapid Injection Molding Sales Value by Production Batch and Purpose (US$ Million), 2027–2032
Table 26. Global Rapid Injection Molding Sales Market Share in Value by Production Batch and Purpose (2021–2026)
Table 27. Global Rapid Injection Molding Sales Market Share in Value by Production Batch and Purpose (2027–2032)
Table 28. Global Rapid Injection Molding Sales Value by Application: 2021 vs 2025 vs 2032 (US$ Million)
Table 29. Global Rapid Injection Molding Sales Value by Application (US$ Million), 2021–2026
Table 30. Global Rapid Injection Molding Sales Value by Application (US$ Million), 2027–2032
Table 31. Global Rapid Injection Molding Sales Market Share in Value by Application (2021–2026)
Table 32. Global Rapid Injection Molding Sales Market Share in Value by Application (2027–2032)
Table 33. Global Rapid Injection Molding Sales Value by Region, (US$ Million), 2021 vs 2025 vs 2032
Table 34. Global Rapid Injection Molding Sales Value by Region (US$ Million), 2021–2026
Table 35. Global Rapid Injection Molding Sales Value by Region (US$ Million), 2027–2032
Table 36. Global Rapid Injection Molding Sales Value by Region (%), 2021–2026
Table 37. Global Rapid Injection Molding Sales Value by Region (%), 2027–2032
Table 38. Key Countries/Regions Rapid Injection Molding Sales Value Growth Trends, (US$ Million): 2021 vs 2025 vs 2032
Table 39. Key Countries/Regions Rapid Injection Molding Sales Value, (US$ Million), 2021–2026
Table 40. Key Countries/Regions Rapid Injection Molding Sales Value, (US$ Million), 2027–2032
Table 41. Sino Manufacturing Basic Information List
Table 42. Sino Manufacturing Description and Business Overview
Table 43. Sino Manufacturing Rapid Injection Molding Products, Services, and Solutions
Table 44. Revenue (US$ Million) in Rapid Injection Molding Business of Sino Manufacturing (2021–2026)
Table 45. Sino Manufacturing Recent Developments
Table 46. Xcentric Mold & Engineering Basic Information List
Table 47. Xcentric Mold & Engineering Description and Business Overview
Table 48. Xcentric Mold & Engineering Rapid Injection Molding Products, Services, and Solutions
Table 49. Revenue (US$ Million) in Rapid Injection Molding Business of Xcentric Mold & Engineering (2021–2026)
Table 50. Xcentric Mold & Engineering Recent Developments
Table 51. ICOMold Basic Information List
Table 52. ICOMold Description and Business Overview
Table 53. ICOMold Rapid Injection Molding Products, Services, and Solutions
Table 54. Revenue (US$ Million) in Rapid Injection Molding Business of ICOMold (2021–2026)
Table 55. ICOMold Recent Developments
Table 56. Protolabs Basic Information List
Table 57. Protolabs Description and Business Overview
Table 58. Protolabs Rapid Injection Molding Products, Services, and Solutions
Table 59. Revenue (US$ Million) in Rapid Injection Molding Business of Protolabs (2021–2026)
Table 60. Protolabs Recent Developments
Table 61. RapidDirect Basic Information List
Table 62. RapidDirect Description and Business Overview
Table 63. RapidDirect Rapid Injection Molding Products, Services, and Solutions
Table 64. Revenue (US$ Million) in Rapid Injection Molding Business of RapidDirect (2021–2026)
Table 65. RapidDirect Recent Developments
Table 66. Star Rapid Basic Information List
Table 67. Star Rapid Description and Business Overview
Table 68. Star Rapid Rapid Injection Molding Products, Services, and Solutions
Table 69. Revenue (US$ Million) in Rapid Injection Molding Business of Star Rapid (2021–2026)
Table 70. Star Rapid Recent Developments
Table 71. DLUX 3D Printing Basic Information List
Table 72. DLUX 3D Printing Description and Business Overview
Table 73. DLUX 3D Printing Rapid Injection Molding Products, Services, and Solutions
Table 74. Revenue (US$ Million) in Rapid Injection Molding Business of DLUX 3D Printing (2021–2026)
Table 75. DLUX 3D Printing Recent Developments
Table 76. Jabil Basic Information List
Table 77. Jabil Description and Business Overview
Table 78. Jabil Rapid Injection Molding Products, Services, and Solutions
Table 79. Revenue (US$ Million) in Rapid Injection Molding Business of Jabil (2021–2026)
Table 80. Jabil Recent Developments
Table 81. Uidea Rapid Prototype Basic Information List
Table 82. Uidea Rapid Prototype Description and Business Overview
Table 83. Uidea Rapid Prototype Rapid Injection Molding Products, Services, and Solutions
Table 84. Revenue (US$ Million) in Rapid Injection Molding Business of Uidea Rapid Prototype (2021–2026)
Table 85. Uidea Rapid Prototype Recent Developments
Table 86. Bay Area Rapid Manufacturing (BARM) Basic Information List
Table 87. Bay Area Rapid Manufacturing (BARM) Description and Business Overview
Table 88. Bay Area Rapid Manufacturing (BARM) Rapid Injection Molding Products, Services, and Solutions
Table 89. Revenue (US$ Million) in Rapid Injection Molding Business of Bay Area Rapid Manufacturing (BARM) (2021–2026)
Table 90. Bay Area Rapid Manufacturing (BARM) Recent Developments
Table 91. Firstcut by Proto Labs Basic Information List
Table 92. Firstcut by Proto Labs Description and Business Overview
Table 93. Firstcut by Proto Labs Rapid Injection Molding Products, Services, and Solutions
Table 94. Revenue (US$ Million) in Rapid Injection Molding Business of Firstcut by Proto Labs (2021–2026)
Table 95. Firstcut by Proto Labs Recent Developments
Table 96. Indotech Basic Information List
Table 97. Indotech Description and Business Overview
Table 98. Indotech Rapid Injection Molding Products, Services, and Solutions
Table 99. Revenue (US$ Million) in Rapid Injection Molding Business of Indotech (2021–2026)
Table 100. Indotech Recent Developments
Table 101. Fast Radius Basic Information List
Table 102. Fast Radius Description and Business Overview
Table 103. Fast Radius Rapid Injection Molding Products, Services, and Solutions
Table 104. Revenue (US$ Million) in Rapid Injection Molding Business of Fast Radius (2021–2026)
Table 105. Fast Radius Recent Developments
Table 106. Fathom Basic Information List
Table 107. Fathom Description and Business Overview
Table 108. Fathom Rapid Injection Molding Products, Services, and Solutions
Table 109. Revenue (US$ Million) in Rapid Injection Molding Business of Fathom (2021–2026)
Table 110. Fathom Recent Developments
Table 111. Midwest Mold Services Basic Information List
Table 112. Midwest Mold Services Description and Business Overview
Table 113. Midwest Mold Services Rapid Injection Molding Products, Services, and Solutions
Table 114. Revenue (US$ Million) in Rapid Injection Molding Business of Midwest Mold Services (2021–2026)
Table 115. Midwest Mold Services Recent Developments
Table 116. Quickparts Basic Information List
Table 117. Quickparts Description and Business Overview
Table 118. Quickparts Rapid Injection Molding Products, Services, and Solutions
Table 119. Revenue (US$ Million) in Rapid Injection Molding Business of Quickparts (2021–2026)
Table 120. Quickparts Recent Developments
Table 121. PTI Engineered Plastics Basic Information List
Table 122. PTI Engineered Plastics Description and Business Overview
Table 123. PTI Engineered Plastics Rapid Injection Molding Products, Services, and Solutions
Table 124. Revenue (US$ Million) in Rapid Injection Molding Business of PTI Engineered Plastics (2021–2026)
Table 125. PTI Engineered Plastics Recent Developments
Table 126. Stratasys Direct Manufacturing Basic Information List
Table 127. Stratasys Direct Manufacturing Description and Business Overview
Table 128. Stratasys Direct Manufacturing Rapid Injection Molding Products, Services, and Solutions
Table 129. Revenue (US$ Million) in Rapid Injection Molding Business of Stratasys Direct Manufacturing (2021–2026)
Table 130. Stratasys Direct Manufacturing Recent Developments
Table 131. Prismier Basic Information List
Table 132. Prismier Description and Business Overview
Table 133. Prismier Rapid Injection Molding Products, Services, and Solutions
Table 134. Revenue (US$ Million) in Rapid Injection Molding Business of Prismier (2021–2026)
Table 135. Prismier Recent Developments
Table 136. BTL Prototypes Basic Information List
Table 137. BTL Prototypes Description and Business Overview
Table 138. BTL Prototypes Rapid Injection Molding Products, Services, and Solutions
Table 139. Revenue (US$ Million) in Rapid Injection Molding Business of BTL Prototypes (2021–2026)
Table 140. BTL Prototypes Recent Developments
Table 141. Premier Die Casting Basic Information List
Table 142. Premier Die Casting Description and Business Overview
Table 143. Premier Die Casting Rapid Injection Molding Products, Services, and Solutions
Table 144. Revenue (US$ Million) in Rapid Injection Molding Business of Premier Die Casting (2021–2026)
Table 145. Premier Die Casting Recent Developments
Table 146. Kintec Basic Information List
Table 147. Kintec Description and Business Overview
Table 148. Kintec Rapid Injection Molding Products, Services, and Solutions
Table 149. Revenue (US$ Million) in Rapid Injection Molding Business of Kintec (2021–2026)
Table 150. Kintec Recent Developments
Table 151. APT Mold Manufacturing Basic Information List
Table 152. APT Mold Manufacturing Description and Business Overview
Table 153. APT Mold Manufacturing Rapid Injection Molding Products, Services, and Solutions
Table 154. Revenue (US$ Million) in Rapid Injection Molding Business of APT Mold Manufacturing (2021–2026)
Table 155. APT Mold Manufacturing Recent Developments
Table 156. Product Development Solutions Basic Information List
Table 157. Product Development Solutions Description and Business Overview
Table 158. Product Development Solutions Rapid Injection Molding Products, Services, and Solutions
Table 159. Revenue (US$ Million) in Rapid Injection Molding Business of Product Development Solutions (2021–2026)
Table 160. Product Development Solutions Recent Developments
Table 161. Silicon Valley Manufacturing Basic Information List
Table 162. Silicon Valley Manufacturing Description and Business Overview
Table 163. Silicon Valley Manufacturing Rapid Injection Molding Products, Services, and Solutions
Table 164. Revenue (US$ Million) in Rapid Injection Molding Business of Silicon Valley Manufacturing (2021–2026)
Table 165. Silicon Valley Manufacturing Recent Developments
Table 166. IMO Plastic Mold Basic Information List
Table 167. IMO Plastic Mold Description and Business Overview
Table 168. IMO Plastic Mold Rapid Injection Molding Products, Services, and Solutions
Table 169. Revenue (US$ Million) in Rapid Injection Molding Business of IMO Plastic Mold (2021–2026)
Table 170. IMO Plastic Mold Recent Developments
Table 171. 3ERP Basic Information List
Table 172. 3ERP Description and Business Overview
Table 173. 3ERP Rapid Injection Molding Products, Services, and Solutions
Table 174. Revenue (US$ Million) in Rapid Injection Molding Business of 3ERP (2021–2026)
Table 175. 3ERP Recent Developments
Table 176. Revenue (US$ Million) in Rapid Injection Molding Business of Company 40 (2021–2026)
Table 177. Company 40 Recent Developments
Table 178. Key Raw Materials Lists
Table 179. Key Suppliers of Raw Materials Lists
Table 180. Rapid Injection Molding Downstream Customers
Table 181. Rapid Injection Molding Distributors List
Table 182. Research Programs/Design for This Report
Table 183. Key Data Information from Secondary Sources
Table 184. Key Data Information from Primary Sources
List of Figures
Figure 1. Rapid Injection Molding Product Picture
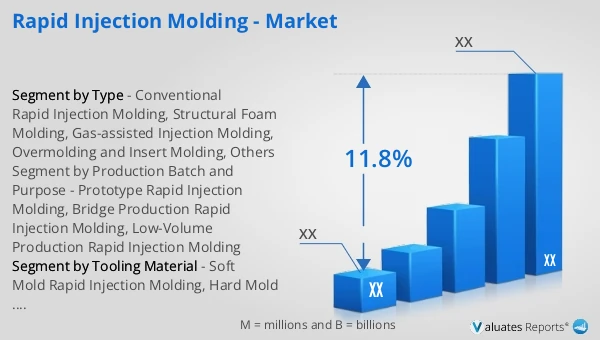
Figure 2. Global Rapid Injection Molding Sales Value, 2021 vs 2025 vs 2032 (US$ Million)
Figure 3. Global Rapid Injection Molding Sales Value (US$ Million), 2021–2032
Figure 4. Rapid Injection Molding Report Years Considered
Figure 5. Global Rapid Injection Molding Players Revenue Ranking (US$ Million), 2025
Figure 6. The 5 and 10 Largest Companies in the World: Market Share by Rapid Injection Molding Revenue in 2025
Figure 7. Rapid Injection Molding Market Share by Company Type (Tier 1, Tier 2, and Tier 3): 2021 vs 2025
Figure 8. Conventional Rapid Injection Molding Picture
Figure 9. Structural Foam Molding Picture
Figure 10. Gas-assisted Injection Molding Picture
Figure 11. Overmolding and Insert Molding Picture
Figure 12. Others Picture
Figure 13. Global Rapid Injection Molding Sales Value by Type (US$ Million), 2021 vs 2025 vs 2032
Figure 14. Global Rapid Injection Molding Sales Value Market Share by Type, 2025 & 2032
Figure 15. Soft Mold Rapid Injection Molding Picture
Figure 16. Hard Mold Rapid Injection Molding Picture
Figure 17. Global Rapid Injection Molding Sales Value by Tooling Material (US$ Million), 2021 vs 2025 vs 2032
Figure 18. Global Rapid Injection Molding Sales Value Market Share by Tooling Material, 2025 & 2032
Figure 19. Prototype Rapid Injection Molding Picture
Figure 20. Bridge Production Rapid Injection Molding Picture
Figure 21. Low-Volume Production Rapid Injection Molding Picture
Figure 22. Global Rapid Injection Molding Sales Value by Production Batch and Purpose (US$ Million), 2021 vs 2025 vs 2032
Figure 23. Global Rapid Injection Molding Sales Value Market Share by Production Batch and Purpose, 2025 & 2032
Figure 24. Product Picture of Medical Devices
Figure 25. Product Picture of Automotive Industry
Figure 26. Product Picture of Aerospace Industry
Figure 27. Product Picture of Consumer Electronics
Figure 28. Product Picture of Industrial Equipment
Figure 29. Product Picture of Others
Figure 30. Global Rapid Injection Molding Sales Value by Application (US$ Million), 2021 vs 2025 vs 2032
Figure 31. Global Rapid Injection Molding Sales Value Market Share by Application, 2025 & 2032
Figure 32. North America Rapid Injection Molding Sales Value (US$ Million), 2021–2032
Figure 33. North America Rapid Injection Molding Sales Value by Country (%), 2025 vs 2032
Figure 34. Europe Rapid Injection Molding Sales Value (US$ Million), 2021–2032
Figure 35. Europe Rapid Injection Molding Sales Value by Country (%), 2025 vs 2032
Figure 36. Asia Pacific Rapid Injection Molding Sales Value (US$ Million), 2021–2032
Figure 37. Asia Pacific Rapid Injection Molding Sales Value by Subregion (%), 2025 vs 2032
Figure 38. South America Rapid Injection Molding Sales Value (US$ Million), 2021–2032
Figure 39. South America Rapid Injection Molding Sales Value by Country (%), 2025 vs 2032
Figure 40. Middle East & Africa Rapid Injection Molding Sales Value (US$ Million), 2021–2032
Figure 41. Middle East & Africa Rapid Injection Molding Sales Value by Country (%), 2025 vs 2032
Figure 42. Key Countries/Regions Rapid Injection Molding Sales Value (%), 2021–2032
Figure 43. United States Rapid Injection Molding Sales Value (US$ Million), 2021–2032
Figure 44. United States Rapid Injection Molding Sales Value by Type (%), 2025 vs 2032
Figure 45. United States Rapid Injection Molding Sales Value by Application (%), 2025 vs 2032
Figure 46. Europe Rapid Injection Molding Sales Value (US$ Million), 2021–2032
Figure 47. Europe Rapid Injection Molding Sales Value by Type (%), 2025 vs 2032
Figure 48. Europe Rapid Injection Molding Sales Value by Application (%), 2025 vs 2032
Figure 49. China Rapid Injection Molding Sales Value (US$ Million), 2021–2032
Figure 50. China Rapid Injection Molding Sales Value by Type (%), 2025 vs 2032
Figure 51. China Rapid Injection Molding Sales Value by Application (%), 2025 vs 2032
Figure 52. Japan Rapid Injection Molding Sales Value (US$ Million), 2021–2032
Figure 53. Japan Rapid Injection Molding Sales Value by Type (%), 2025 vs 2032
Figure 54. Japan Rapid Injection Molding Sales Value by Application (%), 2025 vs 2032
Figure 55. South Korea Rapid Injection Molding Sales Value (US$ Million), 2021–2032
Figure 56. South Korea Rapid Injection Molding Sales Value by Type (%), 2025 vs 2032
Figure 57. South Korea Rapid Injection Molding Sales Value by Application (%), 2025 vs 2032
Figure 58. Southeast Asia Rapid Injection Molding Sales Value (US$ Million), 2021–2032
Figure 59. Southeast Asia Rapid Injection Molding Sales Value by Type (%), 2025 vs 2032
Figure 60. Southeast Asia Rapid Injection Molding Sales Value by Application (%), 2025 vs 2032
Figure 61. India Rapid Injection Molding Sales Value (US$ Million), 2021–2032
Figure 62. India Rapid Injection Molding Sales Value by Type (%), 2025 vs 2032
Figure 63. India Rapid Injection Molding Sales Value by Application (%), 2025 vs 2032
Figure 64. Rapid Injection Molding Value Chain
Figure 65. Rapid Injection Molding Cost Structure
Figure 66. Channels of Distribution (Direct Sales, and Distribution)
Figure 67. Bottom-up and Top-down Approaches for This Report
Figure 68. Data Triangulation
Figure 69. Key Executives Interviewed