List of Tables
Table 1. Global Carbon Wrap Solution Market Size Growth Rate by Type (US$ Million): 2021 vs 2025 vs 2032
Table 2. Key Players of Wet Bonding
Table 3. Key Players of Precast Slab Bonding
Table 4. Key Players of Prestressed Carbon Fiber Plate
Table 5. Key Players of Embedded Reinforcement
Table 6. Global Carbon Wrap Solution Market Size Growth Rate by Strengthening Structure (US$ Million): 2021 vs 2025 vs 2032
Table 7. Key Players of Concrete Structure Strengthening
Table 8. Key Players of Steel Structure Strengthening
Table 9. Key Players of Timber Structure Strengthening
Table 10. Key Players of Others
Table 11. Global Carbon Wrap Solution Market Size Growth Rate by Material Forms (US$ Million): 2021 vs 2025 vs 2032
Table 12. Key Players of Carbon Fiber Cloth
Table 13. Key Players of Carbon Fiber Sheet
Table 14. Key Players of Carbon Fiber Mesh
Table 15. Key Players of Others
Table 16. Global Carbon Wrap Solution Market Size Growth Rate by Strengthening Mechanism (US$ Million): 2021 vs 2025 vs 2032
Table 17. Key Players of Flexural Strengthening
Table 18. Key Players of Shear Strengthening
Table 19. Key Players of Constraint Strengthening
Table 20. Key Players of Durability Strengthening
Table 21. Global Carbon Wrap Solution Market Size Growth by Application (US$ Million): 2021 vs 2025 vs 2032
Table 22. Global Carbon Wrap Solution Market Size by Region (US$ Million): 2021 vs 2025 vs 2032
Table 23. Global Carbon Wrap Solution Market Size by Region (US$ Million), 2021–2026
Table 24. Global Carbon Wrap Solution Market Share by Region (2021–2026)
Table 25. Global Carbon Wrap Solution Forecasted Market Size by Region (US$ Million), 2027–2032
Table 26. Global Carbon Wrap Solution Market Share by Region (2027–2032)
Table 27. Carbon Wrap Solution Market Trends
Table 28. Carbon Wrap Solution Market Drivers
Table 29. Carbon Wrap Solution Market Challenges
Table 30. Carbon Wrap Solution Market Restraints
Table 31. Global Carbon Wrap Solution Revenue by Players (US$ Million), 2021–2026
Table 32. Global Carbon Wrap Solution Market Share by Players (2021–2026)
Table 33. Global Top Carbon Wrap Solution Players by Tier (Tier 1, Tier 2, and Tier 3), based on Carbon Wrap Solution Revenue, 2025
Table 34. Ranking of Global Top Carbon Wrap Solution Companies by Revenue (US$ Million) in 2025
Table 35. Global 5 Largest Players Market Share by Carbon Wrap Solution Revenue (CR5 and HHI), 2021–2026
Table 36. Global Key Players of Carbon Wrap Solution, Headquarters and Area Served
Table 37. Global Key Players of Carbon Wrap Solution, Products and Applications
Table 38. Global Key Players of Carbon Wrap Solution, Date of General Availability (GA)
Table 39. Mergers and Acquisitions, Expansion Plans
Table 40. Global Carbon Wrap Solution Market Size by Type (US$ Million), 2021–2026
Table 41. Global Carbon Wrap Solution Revenue Market Share by Type (2021–2026)
Table 42. Global Carbon Wrap Solution Forecasted Market Size by Type (US$ Million), 2027–2032
Table 43. Global Carbon Wrap Solution Revenue Market Share by Type (2027–2032)
Table 44. Global Carbon Wrap Solution Market Size by Application (US$ Million), 2021–2026
Table 45. Global Carbon Wrap Solution Revenue Market Share by Application (2021–2026)
Table 46. Global Carbon Wrap Solution Forecasted Market Size by Application (US$ Million), 2027–2032
Table 47. Global Carbon Wrap Solution Revenue Market Share by Application (2027–2032)
Table 48. North America Carbon Wrap Solution Market Size Growth Rate by Country (US$ Million): 2021 vs 2025 vs 2032
Table 49. North America Carbon Wrap Solution Market Size by Country (US$ Million), 2021–2026
Table 50. North America Carbon Wrap Solution Market Size by Country (US$ Million), 2027–2032
Table 51. Europe Carbon Wrap Solution Market Size Growth Rate by Country (US$ Million): 2021 vs 2025 vs 2032
Table 52. Europe Carbon Wrap Solution Market Size by Country (US$ Million), 2021–2026
Table 53. Europe Carbon Wrap Solution Market Size by Country (US$ Million), 2027–2032
Table 54. Asia-Pacific Carbon Wrap Solution Market Size Growth Rate by Region (US$ Million): 2021 vs 2025 vs 2032
Table 55. Asia-Pacific Carbon Wrap Solution Market Size by Region (US$ Million), 2021–2026
Table 56. Asia-Pacific Carbon Wrap Solution Market Size by Region (US$ Million), 2027–2032
Table 57. Latin America Carbon Wrap Solution Market Size Growth Rate by Country (US$ Million): 2021 vs 2025 vs 2032
Table 58. Latin America Carbon Wrap Solution Market Size by Country (US$ Million), 2021–2026
Table 59. Latin America Carbon Wrap Solution Market Size by Country (US$ Million), 2027–2032
Table 60. Middle East & Africa Carbon Wrap Solution Market Size Growth Rate by Country (US$ Million): 2021 vs 2025 vs 2032
Table 61. Middle East & Africa Carbon Wrap Solution Market Size by Country (US$ Million), 2021–2026
Table 62. Middle East & Africa Carbon Wrap Solution Market Size by Country (US$ Million), 2027–2032
Table 63. UCC Company Details
Table 64. UCC Business Overview
Table 65. UCC Carbon Wrap Solution Product
Table 66. UCC Revenue in Carbon Wrap Solution Business (US$ Million), 2021–2026
Table 67. UCC Recent Development
Table 68. Horse Construction Company Details
Table 69. Horse Construction Business Overview
Table 70. Horse Construction Carbon Wrap Solution Product
Table 71. Horse Construction Revenue in Carbon Wrap Solution Business (US$ Million), 2021–2026
Table 72. Horse Construction Recent Development
Table 73. CarbonWrap Company Details
Table 74. CarbonWrap Business Overview
Table 75. CarbonWrap Carbon Wrap Solution Product
Table 76. CarbonWrap Revenue in Carbon Wrap Solution Business (US$ Million), 2021–2026
Table 77. CarbonWrap Recent Development
Table 78. DYWIDAG Company Details
Table 79. DYWIDAG Business Overview
Table 80. DYWIDAG Carbon Wrap Solution Product
Table 81. DYWIDAG Revenue in Carbon Wrap Solution Business (US$ Million), 2021–2026
Table 82. DYWIDAG Recent Development
Table 83. CSC Services Company Details
Table 84. CSC Services Business Overview
Table 85. CSC Services Carbon Wrap Solution Product
Table 86. CSC Services Revenue in Carbon Wrap Solution Business (US$ Million), 2021–2026
Table 87. CSC Services Recent Development
Table 88. Leakseal Structure Solutions PVT.LTD Company Details
Table 89. Leakseal Structure Solutions PVT.LTD Business Overview
Table 90. Leakseal Structure Solutions PVT.LTD Carbon Wrap Solution Product
Table 91. Leakseal Structure Solutions PVT.LTD Revenue in Carbon Wrap Solution Business (US$ Million), 2021–2026
Table 92. Leakseal Structure Solutions PVT.LTD Recent Development
Table 93. Structural Technologies Company Details
Table 94. Structural Technologies Business Overview
Table 95. Structural Technologies Carbon Wrap Solution Product
Table 96. Structural Technologies Revenue in Carbon Wrap Solution Business (US$ Million), 2021–2026
Table 97. Structural Technologies Recent Development
Table 98. Advanced FRP Systems Company Details
Table 99. Advanced FRP Systems Business Overview
Table 100. Advanced FRP Systems Carbon Wrap Solution Product
Table 101. Advanced FRP Systems Revenue in Carbon Wrap Solution Business (US$ Million), 2021–2026
Table 102. Advanced FRP Systems Recent Development
Table 103. CTech-LLC Company Details
Table 104. CTech-LLC Business Overview
Table 105. CTech-LLC Carbon Wrap Solution Product
Table 106. CTech-LLC Revenue in Carbon Wrap Solution Business (US$ Million), 2021–2026
Table 107. CTech-LLC Recent Development
Table 108. USD Solutions Company Details
Table 109. USD Solutions Business Overview
Table 110. USD Solutions Carbon Wrap Solution Product
Table 111. USD Solutions Revenue in Carbon Wrap Solution Business (US$ Million), 2021–2026
Table 112. USD Solutions Recent Development
Table 113. Dragon Industrial Wrap Company Details
Table 114. Dragon Industrial Wrap Business Overview
Table 115. Dragon Industrial Wrap Carbon Wrap Solution Product
Table 116. Dragon Industrial Wrap Revenue in Carbon Wrap Solution Business (US$ Million), 2021–2026
Table 117. Dragon Industrial Wrap Recent Development
Table 118. Satiate Solutions Company Details
Table 119. Satiate Solutions Business Overview
Table 120. Satiate Solutions Carbon Wrap Solution Product
Table 121. Satiate Solutions Revenue in Carbon Wrap Solution Business (US$ Million), 2021–2026
Table 122. Satiate Solutions Recent Development
Table 123. Gubbi Civil Engineers Company Details
Table 124. Gubbi Civil Engineers Business Overview
Table 125. Gubbi Civil Engineers Carbon Wrap Solution Product
Table 126. Gubbi Civil Engineers Revenue in Carbon Wrap Solution Business (US$ Million), 2021–2026
Table 127. Gubbi Civil Engineers Recent Development
Table 128. Carbon Tech Europe BV Company Details
Table 129. Carbon Tech Europe BV Business Overview
Table 130. Carbon Tech Europe BV Carbon Wrap Solution Product
Table 131. Carbon Tech Europe BV Revenue in Carbon Wrap Solution Business (US$ Million), 2021–2026
Table 132. Carbon Tech Europe BV Recent Development
Table 133. Rhino Carbon Fiber Company Details
Table 134. Rhino Carbon Fiber Business Overview
Table 135. Rhino Carbon Fiber Carbon Wrap Solution Product
Table 136. Rhino Carbon Fiber Revenue in Carbon Wrap Solution Business (US$ Million), 2021–2026
Table 137. Rhino Carbon Fiber Recent Development
Table 138. Deacon Rocket Wrap Company Details
Table 139. Deacon Rocket Wrap Business Overview
Table 140. Deacon Rocket Wrap Carbon Wrap Solution Product
Table 141. Deacon Rocket Wrap Revenue in Carbon Wrap Solution Business (US$ Million), 2021–2026
Table 142. Deacon Rocket Wrap Recent Development
Table 143. HydraTech LLC Company Details
Table 144. HydraTech LLC Business Overview
Table 145. HydraTech LLC Carbon Wrap Solution Product
Table 146. HydraTech LLC Revenue in Carbon Wrap Solution Business (US$ Million), 2021–2026
Table 147. HydraTech LLC Recent Development
Table 148. Belzona Company Details
Table 149. Belzona Business Overview
Table 150. Belzona Carbon Wrap Solution Product
Table 151. Belzona Revenue in Carbon Wrap Solution Business (US$ Million), 2021–2026
Table 152. Belzona Recent Development
Table 153. Research Programs/Design for This Report
Table 154. Key Data Information from Secondary Sources
Table 155. Key Data Information from Primary Sources
Table 156. Authors List of This Report
List of Figures
Figure 1. Carbon Wrap Solution Picture
Figure 2. Global Carbon Wrap Solution Market Size Comparison by Type (US$ Million), 2021–2032
Figure 3. Global Carbon Wrap Solution Market Share by Type: 2025 vs 2032
Figure 4. Wet Bonding Features
Figure 5. Precast Slab Bonding Features
Figure 6. Prestressed Carbon Fiber Plate Features
Figure 7. Embedded Reinforcement Features
Figure 8. Global Carbon Wrap Solution Market Size Comparison by Strengthening Structure (US$ Million), 2021–2032
Figure 9. Concrete Structure Strengthening Features
Figure 10. Steel Structure Strengthening Features
Figure 11. Timber Structure Strengthening Features
Figure 12. Others Features
Figure 13. Global Carbon Wrap Solution Market Size Comparison by Material Forms (US$ Million), 2021–2032
Figure 14. Carbon Fiber Cloth Features
Figure 15. Carbon Fiber Sheet Features
Figure 16. Carbon Fiber Mesh Features
Figure 17. Others Features
Figure 18. Global Carbon Wrap Solution Market Size Comparison by Strengthening Mechanism (US$ Million), 2021–2032
Figure 19. Flexural Strengthening Features
Figure 20. Shear Strengthening Features
Figure 21. Constraint Strengthening Features
Figure 22. Durability Strengthening Features
Figure 23. Global Carbon Wrap Solution Market Size by Application (US$ Million), 2021–2032
Figure 24. Global Carbon Wrap Solution Market Share by Application: 2025 vs 2032
Figure 25. Power Case Studies
Figure 26. Water Case Studies
Figure 27. Infrastructure Case Studies
Figure 28. Marine Case Studies
Figure 29. Others Case Studies
Figure 30. Carbon Wrap Solution Report Years Considered
Figure 31. Global Carbon Wrap Solution Market Size (US$ Million), Year-over-Year: 2021–2032
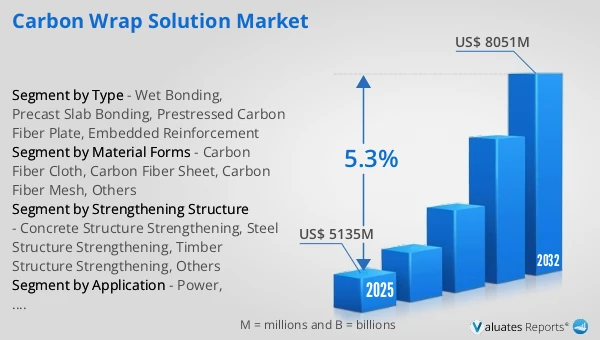
Figure 32. Global Carbon Wrap Solution Market Size, (US$ Million), 2021 vs 2025 vs 2032
Figure 33. Global Carbon Wrap Solution Market Share by Region: 2025 vs 2032
Figure 34. Global Carbon Wrap Solution Market Share by Players in 2025
Figure 35. Global Carbon Wrap Solution Market Share by Company Type (Tier 1, Tier 2, and Tier 3)
Figure 36. The Top 10 and 5 Players Market Share by Carbon Wrap Solution Revenue in 2025
Figure 37. North America Carbon Wrap Solution Market Size YoY Growth (US$ Million), 2021–2032
Figure 38. North America Carbon Wrap Solution Market Share by Country (2021–2032)
Figure 39. United States Carbon Wrap Solution Market Size YoY Growth (US$ Million), 2021–2032
Figure 40. Canada Carbon Wrap Solution Market Size YoY Growth (US$ Million), 2021–2032
Figure 41. Europe Carbon Wrap Solution Market Size YoY Growth (US$ Million), 2021–2032
Figure 42. Europe Carbon Wrap Solution Market Share by Country (2021–2032)
Figure 43. Germany Carbon Wrap Solution Market Size YoY Growth (US$ Million), 2021–2032
Figure 44. France Carbon Wrap Solution Market Size YoY Growth (US$ Million), 2021–2032
Figure 45. U.K. Carbon Wrap Solution Market Size YoY Growth (US$ Million), 2021–2032
Figure 46. Italy Carbon Wrap Solution Market Size YoY Growth (US$ Million), 2021–2032
Figure 47. Russia Carbon Wrap Solution Market Size YoY Growth (US$ Million), 2021–2032
Figure 48. Ireland Carbon Wrap Solution Market Size YoY Growth (US$ Million), 2021–2032
Figure 49. Asia-Pacific Carbon Wrap Solution Market Size YoY Growth (US$ Million), 2021–2032
Figure 50. Asia-Pacific Carbon Wrap Solution Market Share by Region (2021–2032)
Figure 51. China Carbon Wrap Solution Market Size YoY Growth (US$ Million), 2021–2032
Figure 52. Japan Carbon Wrap Solution Market Size YoY Growth (US$ Million), 2021–2032
Figure 53. South Korea Carbon Wrap Solution Market Size YoY Growth (US$ Million), 2021–2032
Figure 54. Southeast Asia Carbon Wrap Solution Market Size YoY Growth (US$ Million), 2021–2032
Figure 55. India Carbon Wrap Solution Market Size YoY Growth (US$ Million), 2021–2032
Figure 56. Australia & New Zealand Carbon Wrap Solution Market Size YoY Growth (US$ Million), 2021–2032
Figure 57. Latin America Carbon Wrap Solution Market Size YoY Growth (US$ Million), 2021–2032
Figure 58. Latin America Carbon Wrap Solution Market Share by Country (2021–2032)
Figure 59. Mexico Carbon Wrap Solution Market Size YoY Growth (US$ Million), 2021–2032
Figure 60. Brazil Carbon Wrap Solution Market Size YoY Growth (US$ Million), 2021–2032
Figure 61. Middle East & Africa Carbon Wrap Solution Market Size YoY Growth (US$ Million), 2021–2032
Figure 62. Middle East & Africa Carbon Wrap Solution Market Share by Country (2021–2032)
Figure 63. Israel Carbon Wrap Solution Market Size YoY Growth (US$ Million), 2021–2032
Figure 64. Saudi Arabia Carbon Wrap Solution Market Size YoY Growth (US$ Million), 2021–2032
Figure 65. UAE Carbon Wrap Solution Market Size YoY Growth (US$ Million), 2021–2032
Figure 66. UCC Revenue Growth Rate in Carbon Wrap Solution Business (2021–2026)
Figure 67. Horse Construction Revenue Growth Rate in Carbon Wrap Solution Business (2021–2026)
Figure 68. CarbonWrap Revenue Growth Rate in Carbon Wrap Solution Business (2021–2026)
Figure 69. DYWIDAG Revenue Growth Rate in Carbon Wrap Solution Business (2021–2026)
Figure 70. CSC Services Revenue Growth Rate in Carbon Wrap Solution Business (2021–2026)
Figure 71. Leakseal Structure Solutions PVT.LTD Revenue Growth Rate in Carbon Wrap Solution Business (2021–2026)
Figure 72. Structural Technologies Revenue Growth Rate in Carbon Wrap Solution Business (2021–2026)
Figure 73. Advanced FRP Systems Revenue Growth Rate in Carbon Wrap Solution Business (2021–2026)
Figure 74. CTech-LLC Revenue Growth Rate in Carbon Wrap Solution Business (2021–2026)
Figure 75. USD Solutions Revenue Growth Rate in Carbon Wrap Solution Business (2021–2026)
Figure 76. Dragon Industrial Wrap Revenue Growth Rate in Carbon Wrap Solution Business (2021–2026)
Figure 77. Satiate Solutions Revenue Growth Rate in Carbon Wrap Solution Business (2021–2026)
Figure 78. Gubbi Civil Engineers Revenue Growth Rate in Carbon Wrap Solution Business (2021–2026)
Figure 79. Carbon Tech Europe BV Revenue Growth Rate in Carbon Wrap Solution Business (2021–2026)
Figure 80. Rhino Carbon Fiber Revenue Growth Rate in Carbon Wrap Solution Business (2021–2026)
Figure 81. Deacon Rocket Wrap Revenue Growth Rate in Carbon Wrap Solution Business (2021–2026)
Figure 82. HydraTech LLC Revenue Growth Rate in Carbon Wrap Solution Business (2021–2026)
Figure 83. Belzona Revenue Growth Rate in Carbon Wrap Solution Business (2021–2026)
Figure 84. Bottom-up and Top-down Approaches for This Report
Figure 85. Data Triangulation
Figure 86. Key Executives Interviewed